You are not logged in.
This means you
CAN ONLY VIEW reports that were published prior to Monday, February 26, 2024.
You
MUST UPGRADE YOUR MEMBERSHIP if you want to see any current reports.
AFTER MARKET UPDATE - MONDAY, MAY 23RD, 2022
Previous After Market Report Next After Market Report >>>
|
|
|
|
DOW |
+618.34 |
31,880.24 |
+1.98% |
|
Volume |
970,601,256 |
-18% |
|
Volume |
4,481,469,200 |
-17% |
|
NASDAQ |
+180.66 |
11,535.27 |
+1.59% |
|
Advancers |
2,158 |
69% |
|
Advancers |
2,640 |
59% |
|
S&P 500 |
+72.39 |
3,973.75 |
+1.86% |
|
Decliners |
988 |
31% |
|
Decliners |
1,818 |
41% |
|
Russell 2000 |
+19.50 |
1,792.76 |
+1.10% |
|
52 Wk Highs |
36 |
|
|
52 Wk Highs |
30 |
|
|
S&P 600 |
+12.51 |
1,184.50 |
+1.07% |
|
52 Wk Lows |
143 |
|
|
52 Wk Lows |
217 |
|
|
Damaging losses last week quickly negated Tuesday's follow-through day and signaled a continuation of the market correction (M criteria). New buying efforts should be avoided until more decisive strength returns.
|
 |
Major Indices Rose With Lighter Volume Totals
Kenneth J. Gruneisen - Passed the CAN SLIM® Master's Exam
The Dow added 618 points, consolidating from its eighth consecutive weekly decline--and longest such losing streak in nearly a century. The S&P 500 advanced 1.9% after briefly wading in bear market territory (defined as a 20% drawdown from a recent peak) during intraday trading Friday. The Nasdaq Composite climbed 1.6%. Both the S&P 500 and Nasdaq just came off a seventh straight weekly drop, their worst runs since 2001, amid increasing recessionary concerns. Volume totals reported were lighter than the prior session on the NYSE and on the Nasdaq exchange, revealing lackluster institutional buying demand. Advancers led decliners by a 2-1 margin on the NYSE and 3-2 on the Nasdaq exchange. Leadership improved as there were 19 high-ranked companies from the Leaders List that hit new 52-week highs and were listed on the BreakOuts Page, versus 9 on the prior session. New 52-week lows totals still solidly outnumbered new 52-week highs on both the NYSE and the Nasdaq exchange. Damaging losses for the major indices last week effectively negated Tuesday's noted follow-through day, quickly signaling a continuation of the market correction (M criteria).
Chart courtesy of www.stockcharts.com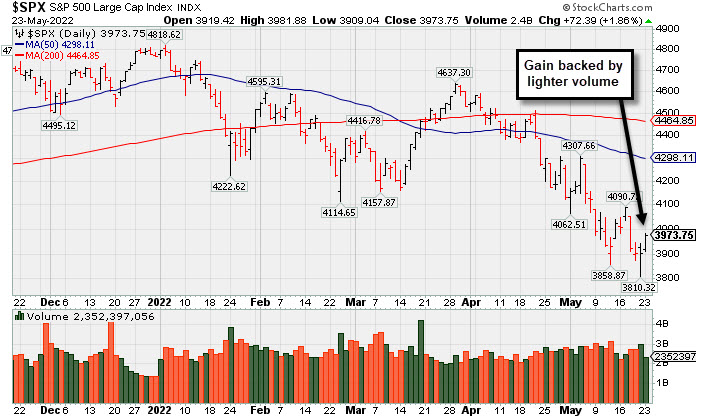 PICTURED: The S&P 500 Index posted a gain with lighter volume following a "positive reversal" on the prior session after hitting a new 2022 low.
U.S. stocks finished higher on Monday in a broad-based relief rally. Oversold conditions and depressed positioning were once again cited as helping buoy risk appetite. Further aiding sentiment was the prospect of the Biden administration rescinding some Trump-era tariffs imposed on Chinese goods in order to alleviate some inflation pressure. Amid the perceived risk on mood, a gauge of the U.S. dollar fell 1%. Treasuries weakened, with the yield on the 10-year note rising eight basis points (0.08%) to 2.86%.
All 11 S&P 500 sectors closed in positive territory, with Financials pacing gains. JPMorgan Chase & Co. (JPM +6.19%) rose following upbeat comments regarding the state of the U.S. economy from CEO Jamie Dimon during the firm’s Investor Day. Other bank shares caught a tailwind from the remarks, which included a boost to JPMorgan’s net interest income guidance. The KBW Bank Index jumped 4.1% in its best day since early March. In other corporate news, VMware Inc. (VMW +24.78%) surged amid reports chipmaker Broadcom Inc. (AVGO -3.10%) was engaged in discussions to purchase the cloud-computing company in a cash and stock deal.
|
 Kenneth J. Gruneisen started out as a licensed stockbroker in August 1987, a couple of months prior to the historic stock market crash that took the Dow Jones Industrial Average down -22.6% in a single day. He has published daily fact-based fundamental and technical analysis on high-ranked stocks online for two decades. Through FACTBASEDINVESTING.COM, Kenneth provides educational articles, news, market commentary, and other information regarding proven investment systems that work in good times and bad.
Comments contained in the body of this report are technical opinions only and are not necessarily those of Gruneisen Growth Corp. The material herein has been obtained from sources believed to be reliable and accurate, however, its accuracy and completeness cannot be guaranteed. Our firm, employees, and customers may effect transactions, including transactions contrary to any recommendation herein, or have positions in the securities mentioned herein or options with respect thereto. Any recommendation contained in this report may not be suitable for all investors and it is not to be deemed an offer or solicitation on our part with respect to the purchase or sale of any securities. |
|
 |
Financial and Commodity-Linked Groups Led Gainers
Kenneth J. Gruneisen - Passed the CAN SLIM® Master's Exam
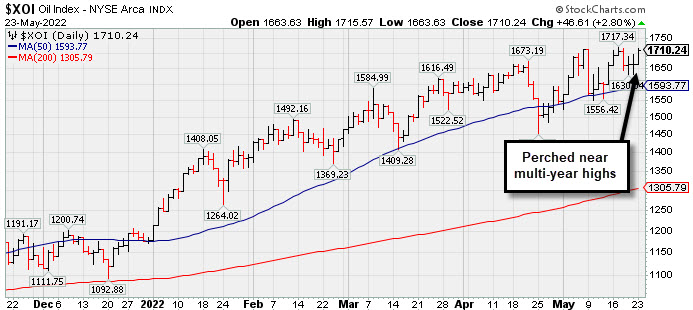
The Bank Index ($BKX +4.08%) and Broker/Dealer Index ($XBD +2.06%) posted influential gains while the Retail Index ($RLX +0.41%) edged higher. The Networking Index ($NWX +0.94%), Semiconductor Index ($SOX +0.55%), and Biotech Index ($BTK +0.53%) each ended higher. The Oil Services Index ($OSX +4.84%) and Integrated Oil Index ($XOI +2.80%) posted standout gains while the Gold & Silver Index ($XAU +0.70%) also edged higher.
PICTURED: The Integrated Oil Index ($XOI +2.80%) remains perched near multi-year highs.
| Oil Services |
$OSX |
77.99 |
+3.60 |
+4.84% |
+47.92% |
| Integrated Oil |
$XOI |
1,710.24 |
+46.61 |
+2.80% |
+45.16% |
| Semiconductor |
$SOX |
2,898.43 |
+15.78 |
+0.55% |
-26.55% |
| Networking |
$NWX |
725.26 |
+6.77 |
+0.94% |
-25.31% |
| Broker/Dealer |
$XBD |
402.20 |
+8.12 |
+2.06% |
-17.39% |
| Retail |
$RLX |
2,878.81 |
+11.86 |
+0.41% |
-31.89% |
| Gold & Silver |
$XAU |
130.43 |
+0.91 |
+0.70% |
-1.52% |
| Bank |
$BKX |
110.85 |
+4.34 |
+4.08% |
-16.16% |
| Biotech |
$BTK |
4,578.69 |
+24.06 |
+0.53% |
-17.03% |
|
|
|
 |
|
|
|
Color Codes Explained :
Y - Better candidates highlighted by our
staff of experts.
G - Previously featured
in past reports as yellow but may no longer be buyable under the
guidelines.
***Last / Change / Volume data in this table is the closing quote data***
Symbol/Exchange
Company Name
Industry Group |
PRICE |
CHANGE
(%Change) |
Day High |
Volume
(% DAV)
(% 50 day avg vol) |
52 Wk Hi
% From Hi |
Featured
Date |
Price
Featured |
Pivot Featured |
|
Max Buy |
 CI
-
NYSE
CI
-
NYSE
Cigna Corp
Medical-Managed Care
|
$263.37
|
+3.88
1.50% |
$265.76
|
1,082,765
71.05% of 50 DAV
50 DAV is 1,524,000
|
$271.71
-3.07%
|
5/6/2022
|
$263.52
|
PP = $269.97
|
|
MB = $283.47
|
 Most Recent Note - 5/23/2022 5:13:33 PM
Y - Posted a gain today with lighter volume, consolidating above its 50 DMA line ($252) after challenging its all-time high last week. Subsequent gains above the pivot point backed by at least +40% above average volume may trigger a technical buy signal. Reported a strong +27% earnings increase on +7% sales revenues for the Mar '22 quarter versus the year ago period, its 3rd strong quarterly comparison above the +25% minimum guideline (C criteria). Annual earnings growth (A criteria) has been strong.
>>> FEATURED STOCK ARTICLE : Cigna Rises Near All-Time High - 5/6/2022 |
View all notes |
Set NEW NOTE alert |
Company Profile |
SEC
News |
Chart |
Request a new note
C
A
S
I |
PAG
-
NYSE
Penske Automotive Grp
Retail/Whlsle-Automobile
|
$108.32
|
+0.31
0.29% |
$108.61
|
272,954
80.28% of 50 DAV
50 DAV is 340,000
|
$119.47
-9.33%
|
5/13/2022
|
$114.88
|
PP = $114.57
|
|
MB = $120.30
|
Most Recent Note - 5/23/2022 5:15:59 PM
Y - Volume totals have been cooling while sputtering after completely negating the recent technical breakout amid widespread market weakness. Its 50 DMA line ($103) defines near term support below prior highs.
>>> FEATURED STOCK ARTICLE : Breakout With Volume-Driven Gain to New High - 5/13/2022 |
View all notes |
Set NEW NOTE alert |
Company Profile |
SEC
News |
Chart |
Request a new note
C
A
S
I |
LLY
-
NYSE
Eli Lilly & Co
Medical-Diversified
|
$302.60
|
+3.75
1.25% |
$304.92
|
2,859,596
96.58% of 50 DAV
50 DAV is 2,961,000
|
$314.00
-3.63%
|
5/16/2022
|
$302.46
|
PP = $314.10
|
|
MB = $329.81
|
Most Recent Note - 5/23/2022 5:14:56 PM
Y - Consolidating above its 50 DMA line ($292) which recently acted as support. Perched within striking distance of its 52-week high and its color code was changed to yellow. Pivot point cited was based on its 4/07/22 high plus 10 cents. Three of the past 4 quarterly comparisons were above the +25% minimum earnings guideline (C criteria).
>>> FEATURED STOCK ARTICLE : Eli Lilly & Co Challenges All-Time High - 5/16/2022 |
View all notes |
Set NEW NOTE alert |
Company Profile |
SEC
News |
Chart |
Request a new note
C
A
S
I |
|
|
|
THESE ARE NOT BUY RECOMMENDATIONS!
Comments contained in the body of this report are technical
opinions only. The material herein has been obtained
from sources believed to be reliable and accurate, however,
its accuracy and completeness cannot be guaranteed.
This site is not an investment advisor, hence it does
not endorse or recommend any securities or other investments.
Any recommendation contained in this report may not
be suitable for all investors and it is not to be deemed
an offer or solicitation on our part with respect to
the purchase or sale of any securities. All trademarks,
service marks and trade names appearing in this report
are the property of their respective owners, and are
likewise used for identification purposes only.
This report is a service available
only to active Paid Premium Members.
You may opt-out of receiving report notifications
at any time. Questions or comments may be submitted
by writing to Premium Membership Services 665 S.E. 10 Street, Suite 201 Deerfield Beach, FL 33441-5634 or by calling 1-800-965-8307
or 954-785-1121.
|
|
|