You are not logged in.
This means you
CAN ONLY VIEW reports that were published prior to Monday, April 14, 2025.
You
MUST UPGRADE YOUR MEMBERSHIP if you want to see any current reports.
AFTER MARKET UPDATE - FRIDAY, MAY 16TH, 2014
Previous After Market Report Next After Market Report >>>
|
|
|
|
DOW |
+44.50 |
16,491.31 |
+0.27% |
|
Volume |
762,678,570 |
+4% |
|
Volume |
1,614,272,610 |
-16% |
|
NASDAQ |
+21.30 |
4,090.59 |
+0.52% |
|
Advancers |
2,048 |
65% |
|
Advancers |
1,632 |
58% |
|
S&P 500 |
+7.01 |
1,877.86 |
+0.37% |
|
Decliners |
998 |
32% |
|
Decliners |
1,085 |
39% |
|
Russell 2000 |
+6.92 |
1,102.91 |
+0.63% |
|
52 Wk Highs |
74 |
|
|
52 Wk Highs |
9 |
|
|
S&P 600 |
+5.11 |
639.08 |
+0.81% |
|
52 Wk Lows |
36 |
|
|
52 Wk Lows |
80 |
|
|
 |
Dow and S&P 500 Index Remain Above 50-Day Moving Average Lines
Kenneth J. Gruneisen - Passed the CAN SLIM® Master's Exam
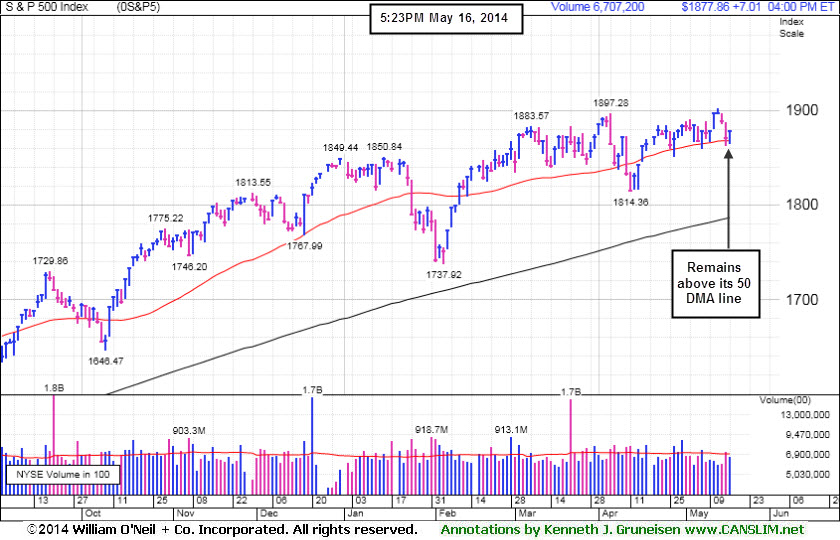
Despite Friday's gains, the Dow Jones Industrial Average snapped a two-week winning streak as it declined -0.6%, still finishing above its 50-day moving average (DMA) line. The S&P 500 Index was down less than -0.1% on the week. The Nasdaq Composite Index managed to finish with a weekly gain of +0.5%. The volume was reported mixed, higher than the prior session total on the NYSE and lower on the Nasdaq exchange. Breadth was positive as advancers led decliners by a 2-1 margin on the NYSE and 3-2 on the Nasdaq exchange. There were 10 high-ranked companies from the CANSLIM.net Leaders List that made new 52-week highs and appeared on the CANSLIM.net BreakOuts Page, up from the total of 5 stocks on the prior session. New 52-week highs outnumbered new 52-week lows on the NYSE while new lows outnumbered new highs on the Nasdaq exchange. There were gains for all 6 high-ranked companies currently included on the Featured Stocks Page. It was recently noted that the Dow Jones Industrial Average and S&P 500 Index both tallied gains into new high territory. Technically that is favorable, however, uncertain market action overall has led the newspaper to still hold off from officially shifting its view that the market direction (M criteria) is back in a "confirmed uptrend". While awaiting a more definitive read on the market any new buying efforts should be very selective and only focused in stocks meeting all key criteria of the fact-based investment system. Keep in mind that any sustained and meaningful market advance requires leadership - a healthy crop of stocks hitting new 52-week highs.
On the economic front, the University of Michigan consumer confidence survey unexpectedly dropped this month from a nine-month high. On the upside, housing starts surprisingly jumped in April to the highest level since last November and building permits also increased more than anticipated.
Nine of the 10 S&P 500 sectors advanced. Telecommunications and consumer staples were the best performing groups as Verizon (VZ +2.3%) and Altria (MO +1.4%) rose. Late gains in technology also helped lift the market as Apple (AAPL +1.2%) gained ground. Energy was the only sector that closed in negative territory, led by Chesapeake Energy's (CHK -4.7%) drop.
Teasuries fell for the first time in four days. The 10-year note declined 9/32 to yield 2.52%. The 30-year bond lost 12/32 to yield 3.34%.
The CANSLIM.net Featured Stocks Page shows the most action-worthy candidates and their latest notes and a Headline Link directs members to the latest detailed analysis with data-packed graphs annotated by a Certified expert along with links to additional resources. The Premium Member Homepage includes "dynamic archives" to all prior pay reports published. Watch for an announcement via email concerning the next WEBCAST.
PICTURED: The S&P 500 Index remains above its 50-day moving average (DMA) line and perched -1.3%off its all-time high hit on Tuesday.
The
|
 Kenneth J. Gruneisen started out as a licensed stockbroker in August 1987, a couple of months prior to the historic stock market crash that took the Dow Jones Industrial Average down -22.6% in a single day. He has published daily fact-based fundamental and technical analysis on high-ranked stocks online for two decades. Through FACTBASEDINVESTING.COM, Kenneth provides educational articles, news, market commentary, and other information regarding proven investment systems that work in good times and bad.
Comments contained in the body of this report are technical opinions only and are not necessarily those of Gruneisen Growth Corp. The material herein has been obtained from sources believed to be reliable and accurate, however, its accuracy and completeness cannot be guaranteed. Our firm, employees, and customers may effect transactions, including transactions contrary to any recommendation herein, or have positions in the securities mentioned herein or options with respect thereto. Any recommendation contained in this report may not be suitable for all investors and it is not to be deemed an offer or solicitation on our part with respect to the purchase or sale of any securities. |
|
 |
Retail and Semiconductor Indexes Rose
Kenneth J. Gruneisen - Passed the CAN SLIM® Master's Exam
The Retail Index ($RLX +1.21%) posted a gain on Friday and was a positive influence on the major averages. The Bank Index ($BKX -0.22%) edged lower while the Broker/Dealer Index ($XBD +0.32%) eked out a small gain. The Semiconductor Index ($SOX +1.05%) led the tech sector higher, meanwhile the Networking Index ($NWX -0.48%) and the Biotechnology Index ($BTK -0.28%) edged lower. Commodity-linked groups fell as the Gold & Silver Index ($XAU -0.91%) and Integrated Oil Index ($XOI -0.34%) ended with small losses.
Charts courtesy www.stockcharts.com
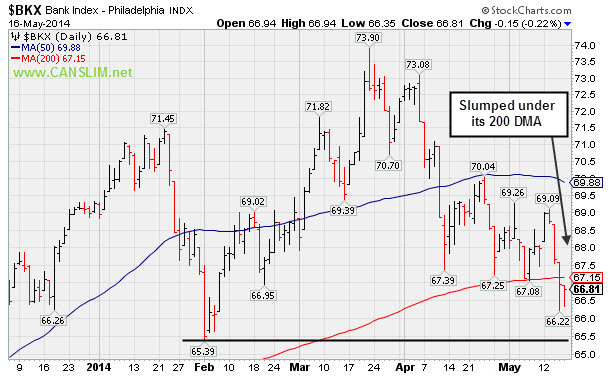
PICTURED 1: The Bank Index ($BKX -0.22%) edged lower, failing to rebound above the 200-day moving average (DMA) line.
Charts courtesy www.stockcharts.com
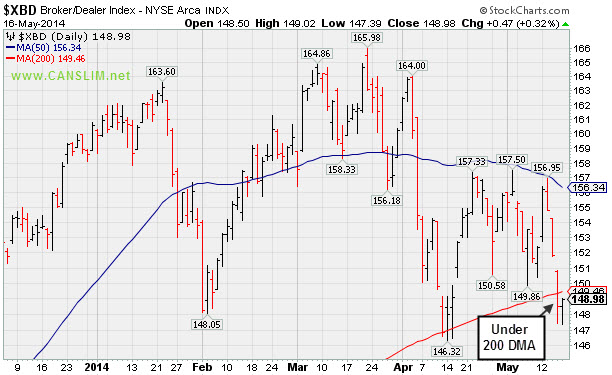
PICTURED 2: The Broker/Dealer Index ($XBD +0.32%) is also below its 200 DMA line. History has proven that the major averages are prone to serious downdrafts when financial stocks are weak, so it would be encouraging for the financial indexes to make a stand soon and rebound. Further technical deterioration in the financial indexes would be an ominous sign and it would bode poorly for the broader market outlook.
| Oil Services |
$OSX |
282.18 |
+0.10 |
+0.04% |
+0.41% |
| Integrated Oil |
$XOI |
1,604.56 |
-5.41 |
-0.34% |
+6.75% |
| Semiconductor |
$SOX |
576.01 |
+6.01 |
+1.05% |
+7.66% |
| Networking |
$NWX |
325.73 |
-1.57 |
-0.48% |
+0.55% |
| Broker/Dealer |
$XBD |
148.98 |
+0.47 |
+0.32% |
-7.21% |
| Retail |
$RLX |
851.90 |
+10.19 |
+1.21% |
-9.35% |
| Gold & Silver |
$XAU |
88.86 |
-0.82 |
-0.91% |
+5.60% |
| Bank |
$BKX |
66.81 |
-0.15 |
-0.22% |
-3.54% |
| Biotech |
$BTK |
2,502.03 |
-6.98 |
-0.28% |
+7.36% |
|
|
|
 |
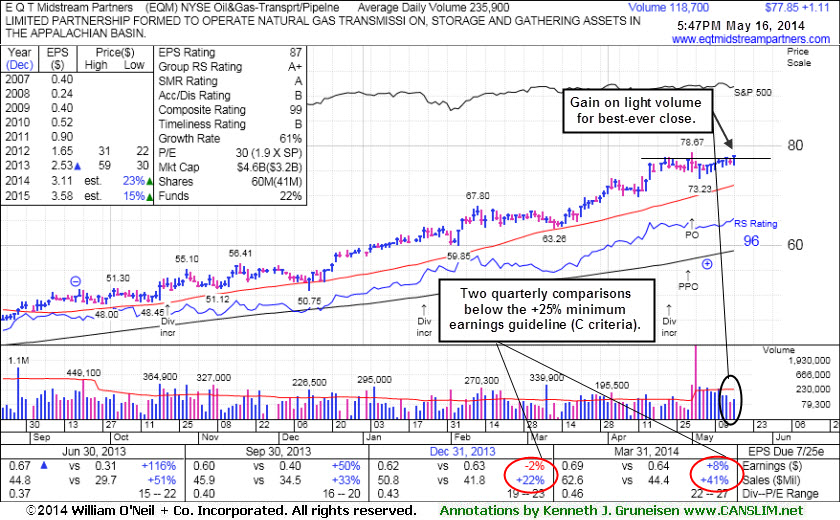
Best Ever Close With Light Volume Gain
Kenneth J. Gruneisen - Passed the CAN SLIM® Master's Exam
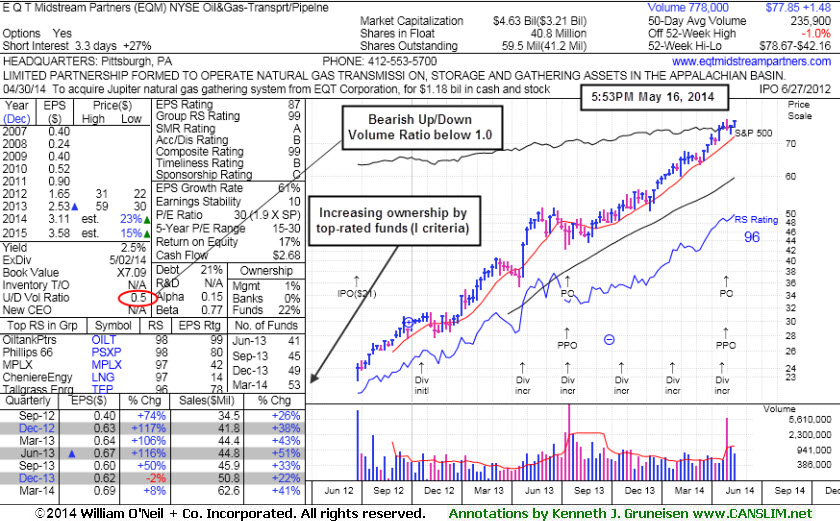
E Q T Midstream Partners (EQM +$1.11 or +1.45% to $77.85) inched higher today for a best-ever close with a gain on lighter volume. It completed a new Public Offering of 10.75 Million common units on 5/01/14. Fundamental concerns remain after 2 consecutive sub par quarters below the +25% minimum earnings guideline. Its 50-day moving average (DMA) line ($72.01) defines near-term support where a violation may trigger a technical sell signal. Since its last appearance in this FSU section on 4/28/14 under the headline, "Strength Continues; Earnings Below +25% Minimum Guideline for a 2nd Quarter", it stubbornly held its ground and made gradual progress. It reported earnings +8% on +41% sales revenues for the Mar '14 quarter, a 2nd consecutive quarterly comparison below the +25% minimum earnings guideline (C criteria). Its 50-day moving average (DMA) line ($69.01 now) defines near-term support where a subsequent violation may trigger a technical sell signal.
It is up +46.4% since first highlighted in yellow in the 12/12/13 mid-day report (read here) with new pivot point cited based on its 11/18/13 high plus 10 cents. The fact-based system suggests watching for technical sell signals rather than selling purely on fundmentals, yet is wise to sometimes lock in gains at the +20% level. For those watching it and still giving it the benefit of the doubt, its 50-day moving average (DMA) line defines support for the near term while subsequent violations may trigger more worrisome technical sell signals.
It completed a new Public Offering on 7/16/13, then made gradual progress afterward. This MLP in the Natural Gas business has seen the number of top-rated funds owning its shares rise from 20 in Jun '12 to 53 in Mar '14, a reassuring sign concerning the I criteria. Its Up/Down Volume Ratio of 0.5 is an unbiased indication its shares have been under distributional over the past 50 days.
|
|
|
Color Codes Explained :
Y - Better candidates highlighted by our
staff of experts.
G - Previously featured
in past reports as yellow but may no longer be buyable under the
guidelines.
***Last / Change / Volume data in this table is the closing quote data***
Symbol/Exchange
Company Name
Industry Group |
PRICE |
CHANGE
(%Change) |
Day High |
Volume
(% DAV)
(% 50 day avg vol) |
52 Wk Hi
% From Hi |
Featured
Date |
Price
Featured |
Pivot Featured |
|
Max Buy |
AL
-
NYSE
Air Lease Corp Cl A
DIVERSIFIED SERVICES - Rental and Leasing Services
|
$38.37
|
-0.09
-0.23% |
$38.61
|
596,825
84.90% of 50 DAV
50 DAV is 703,000
|
$40.36
-4.93%
|
5/9/2014
|
$38.27
|
PP = $38.25
|
|
MB = $40.16
|
Most Recent Note - 5/13/2014 5:53:03 PM
Y - Small loss today with above average volume. Rallied near its "max buy" level with volume-driven gains. Prior highs near $38 define near-term support to watch on pullbacks.
>>> FEATURED STOCK ARTICLE : Volume Heavy Following Gap Up Gain for New 52-Week High - 5/9/2014
View all notes |
Set NEW NOTE alert |
CANSLIM.net Company Profile |
SEC
News |
Chart |
Request a new note
C
A N
S L
I M


|
EQM
-
NYSE
E Q T Midstream Partners
ENERGY - Oil and Gas Pipelines
|
$77.85
|
+1.11
1.45% |
$78.09
|
118,727
50.52% of 50 DAV
50 DAV is 235,000
|
$78.67
-1.04%
|
12/12/2013
|
$53.17
|
PP = $56.51
|
|
MB = $59.34
|
 Most Recent Note - 5/16/2014 6:15:21 PM
G - Inched higher today for a best ever close with a gain on light volume. Completed a new Public Offering of 10.75 Million common units on 5/01/14. Fundamental concerns remain after 2 consecutive sub par quarters below the +25% minimum earnings guideline. Its 50 DMA line defines near-term support where a violation may trigger a technical sell signal. See the latest FSU analysis for more details and new annotated graphs.
>>> FEATURED STOCK ARTICLE : Best Ever Close With Light Volume Gain - 5/16/2014
View all notes |
Set NEW NOTE alert |
CANSLIM.net Company Profile |
SEC
News |
Chart |
Request a new note
C
A N
S L
I M
|
GRFS
-
NASDAQ
Grifols Sa Ads
Medical-Ethical Drugs
|
$40.78
|
-0.47
-1.14% |
$41.59
|
1,308,937
221.10% of 50 DAV
50 DAV is 592,000
|
$43.45
-6.14%
|
5/15/2014
|
$41.14
|
PP = $43.55
|
|
MB = $45.73
|
Most Recent Note - 5/16/2014 12:20:33 PM
Y - Consolidating near its 50 DMA line today, pulling back for a 2nd consecutive session with above average volume, indicating distributional pressure. Highlighted in yellow with pivot point cited based on its 3/11/14 high plus 10 cents in the 5/15/14 mid-day report (read here). This Spanish firm from the Medical- Ethical Drugs industry has little resistance remaining due to overhead supply. Subsequent volume-driven gains for new highs are needed to trigger a technical buy signal. Reported earnings +34% on +25% sales revenues for the Mar '14 quarter, marking its 4th consecutive quarter with earnings above the +25% minimum guideline (C criteria). See the latest FSU analysis for more details and annotated graphs.
>>> FEATURED STOCK ARTICLE : Perched Within Close Striking Distance of New Highs - 5/15/2014
View all notes |
Set NEW NOTE alert |
CANSLIM.net Company Profile |
SEC
News |
Chart |
Request a new note
C
A N
S L
I M
|
ICON
-
NASDAQ
Iconix Brand Group Inc
CONSUMER NON-DURABLES - Textile - Apparel Footwear
|
$41.47
|
+0.17
0.41% |
$41.54
|
351,460
59.67% of 50 DAV
50 DAV is 589,000
|
$43.34
-4.31%
|
4/30/2014
|
$42.50
|
PP = $42.57
|
|
MB = $44.70
|
Most Recent Note - 5/14/2014 5:57:33 PM
Y - Reported earnings +33% on +11% sales revenues for the Mar '14 quarter, continuing its streak of earning increases above the +25% minimum guideline (C criteria). Finished in the upper third of its intra-day range today after slumping near its 50 DMA line. A violation of that short-term average would raise concerns and trigger a technical sell signal. Confirming gains above the pivot point with above average volume could trigger a new (or add-on) technical buy signal.
>>> FEATURED STOCK ARTICLE : Stalled After Hitting a New 52-Week High - 5/7/2014
View all notes |
Set NEW NOTE alert |
CANSLIM.net Company Profile |
SEC
News |
Chart |
Request a new note
C
A N
S L
I M
|
TRN
-
NYSE
Trinity Industries Inc
TRANSPORTATION - Railroads
|
$81.09
|
+0.76
0.95% |
$81.49
|
1,044,941
81.70% of 50 DAV
50 DAV is 1,279,000
|
$82.04
-1.16%
|
4/30/2014
|
$75.57
|
PP = $76.05
|
|
MB = $79.85
|
Most Recent Note - 5/13/2014 5:46:36 PM
G - Rallied further above its "max buy" level with today's 8th consecutive volume-driven gain. Prior highs in the $75-76 area define near-term support to watch on pullbacks.
>>> FEATURED STOCK ARTICLE : Rose Beyond "Max Buy" Level With 7th Consecutive Gain - 5/12/2014
View all notes |
Set NEW NOTE alert |
CANSLIM.net Company Profile |
SEC
News |
Chart |
Request a new note
C
A N
S L
I M
|
Symbol/Exchange
Company Name
Industry Group |
PRICE |
CHANGE
(%Change) |
Day High |
Volume
(% DAV)
(% 50 day avg vol) |
52 Wk Hi
% From Hi |
Featured
Date |
Price
Featured |
Pivot Featured |
|
Max Buy |
WLK
-
NYSE
Westlake Chemical Corp
CHEMICALS - Specialty Chemicals
|
$75.45
|
+1.42
1.92% |
$75.51
|
628,184
91.71% of 50 DAV
50 DAV is 685,000
|
$77.64
-2.82%
|
4/29/2014
|
$72.79
|
PP = $69.31
|
|
MB = $72.78
|
Most Recent Note - 5/13/2014 5:47:53 PM
G - Quietly consolidating -3.7% off its 52-week high. Prior highs in the $69 area define near-term support to watch. Reported +28% earnings on +19% sales for the Mar '14 quarter.
>>> FEATURED STOCK ARTICLE : Extended From Base Following Volume Driven Gains - 5/8/2014
View all notes |
Set NEW NOTE alert |
CANSLIM.net Company Profile |
SEC
News |
Chart |
Request a new note
C
A N
S L
I M
|
|
|
|
THESE ARE NOT BUY RECOMMENDATIONS!
Comments contained in the body of this report are technical
opinions only. The material herein has been obtained
from sources believed to be reliable and accurate, however,
its accuracy and completeness cannot be guaranteed.
This site is not an investment advisor, hence it does
not endorse or recommend any securities or other investments.
Any recommendation contained in this report may not
be suitable for all investors and it is not to be deemed
an offer or solicitation on our part with respect to
the purchase or sale of any securities. All trademarks,
service marks and trade names appearing in this report
are the property of their respective owners, and are
likewise used for identification purposes only.
This report is a service available
only to active Paid Premium Members.
You may opt-out of receiving report notifications
at any time. Questions or comments may be submitted
by writing to Premium Membership Services 665 S.E. 10 Street, Suite 201 Deerfield Beach, FL 33441-5634 or by calling 1-800-965-8307
or 954-785-1121.
|
|
|

