You are not logged in.
This means you
CAN ONLY VIEW reports that were published prior to Tuesday, April 15, 2025.
You
MUST UPGRADE YOUR MEMBERSHIP if you want to see any current reports.
AFTER MARKET UPDATE - MONDAY, MAY 19TH, 2014
Previous After Market Report Next After Market Report >>>
|
|
|
|
DOW |
+20.55 |
16,511.86 |
+0.12% |
|
Volume |
572,850,040 |
-25% |
|
Volume |
1,478,919,140 |
-8% |
|
NASDAQ |
+35.23 |
4,125.82 |
+0.86% |
|
Advancers |
1,980 |
63% |
|
Advancers |
1,874 |
67% |
|
S&P 500 |
+7.22 |
1,885.08 |
+0.38% |
|
Decliners |
1,068 |
34% |
|
Decliners |
826 |
30% |
|
Russell 2000 |
+11.52 |
1,114.43 |
+1.04% |
|
52 Wk Highs |
103 |
|
|
52 Wk Highs |
37 |
|
|
S&P 600 |
+5.51 |
644.59 |
+0.86% |
|
52 Wk Lows |
12 |
|
|
52 Wk Lows |
55 |
|
|
 |
Indices Rose With Less Volume Conviction
Kenneth J. Gruneisen - Passed the CAN SLIM® Master's Exam
Behind Monday's gains the volume was reported lighter than the prior session totals on the NYSE and on the Nasdaq exchange, a sign of lackluster buying efforts coming from the institutional crowd. Breadth was positive as advancers led decliners by nearly a 2-1 margin on the NYSE and more than 2-1 on the Nasdaq exchange. Leadership contracted as there were 30 high-ranked companies from the CANSLIM.net Leaders List that made new 52-week highs and appeared on the CANSLIM.net BreakOuts Page, up from the total of 5 stocks on the prior session. New 52-week highs outnumbered new 52-week lows on the NYSE while new lows outnumbered new highs on the Nasdaq exchange. There were gains for 5 of the 6 high-ranked companies currently included on the Featured Stocks Page. It was recently noted that the Dow Jones Industrial Average and S&P 500 Index both tallied gains into new high territory. Technically that is favorable, however, uncertain market action overall has led the newspaper to still hold off from officially shifting its view that the market direction (M criteria) is back in a "confirmed uptrend". While awaiting a more definitive read on the market any new buying efforts should be very selective and only focused in stocks meeting all key criteria of the fact-based investment system. Keep in mind that any sustained and meaningful market advance requires leadership - a healthy crop of stocks hitting new 52-week highs.
Stocks posted gains on Monday. The Dow Jones Industrial Average rose 21 points to 16,511. The S&P 500 was 7 points higher at 1,885. The NASDAQ climbed 35 points to 4,125.
The major averages advanced following more company M&A news. DirecTV (DTV -1.77%) fell after the satellite TV operator agreed to be acquired by AT&T (T -0.98%) for $48.5 billion. Abbott Labs (ABT -0.98%) edged lower after its proposed deal to purchase CFR Pharmaceuticals for approximately $3 billion. Shares of Pfizer (PFE +0.55%) posted a small gain after AstraZeneca (AZN -12.01%) rejected the company's $117 billion takeover offer.
On the earnings front, Campbell Soup (CPB -2.35%) fell after providing a reduced full-year forecast. Urban Outfitters (URBN -0.11%) inched lower ahead of its scheduled quarterly results after the close.
Seven of 10 sectors in the S&P 500 finished in positive territory. Technology rose the most on the session as Apple (AAPL +1.18%) and Facebook (FB +2.05%) posted gains. Utilities were the worst performing group with American Electric (AEP -3.19%) and Duke Energy (DUK -1.47%) both on the decline.
Treasuries finished lower with the 10-year note falling 6/32 to yield 2.55%.
The CANSLIM.net Featured Stocks Page shows the most action-worthy candidates and their latest notes and a Headline Link directs members to the latest detailed analysis with data-packed graphs annotated by a Certified expert along with links to additional resources. The Premium Member Homepage includes "dynamic archives" to all prior pay reports published. Watch for an announcement via email concerning the next WEBCAST.
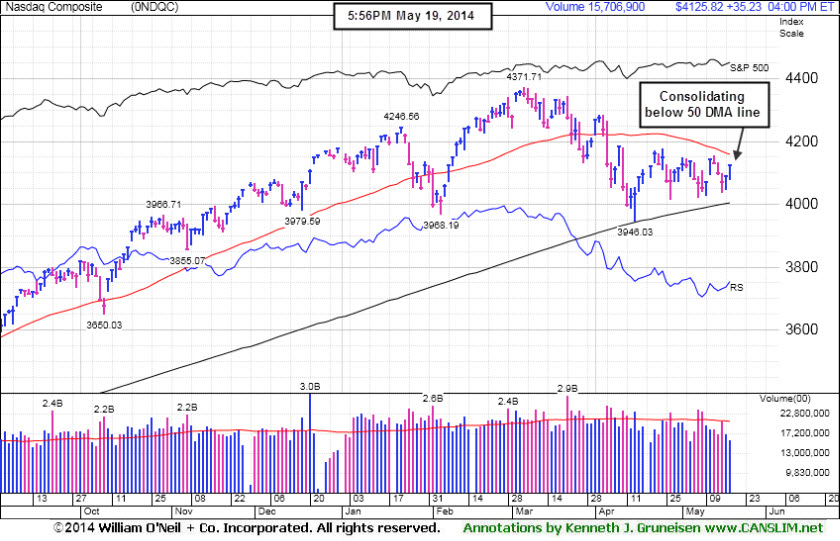
PICTURED: The Nasdaq Composite Index is consolidating below its 50-day moving average line which is downward sloping. That short-term average may act as resistance while a rebound above it would help the tech-heavy index's technical stance and outlook improve.
|
 Kenneth J. Gruneisen started out as a licensed stockbroker in August 1987, a couple of months prior to the historic stock market crash that took the Dow Jones Industrial Average down -22.6% in a single day. He has published daily fact-based fundamental and technical analysis on high-ranked stocks online for two decades. Through FACTBASEDINVESTING.COM, Kenneth provides educational articles, news, market commentary, and other information regarding proven investment systems that work in good times and bad.
Comments contained in the body of this report are technical opinions only and are not necessarily those of Gruneisen Growth Corp. The material herein has been obtained from sources believed to be reliable and accurate, however, its accuracy and completeness cannot be guaranteed. Our firm, employees, and customers may effect transactions, including transactions contrary to any recommendation herein, or have positions in the securities mentioned herein or options with respect thereto. Any recommendation contained in this report may not be suitable for all investors and it is not to be deemed an offer or solicitation on our part with respect to the purchase or sale of any securities. |
|
 |
Financial, Tech, and Energy-Related Groups Rose
Kenneth J. Gruneisen - Passed the CAN SLIM® Master's Exam
The Bank Index ($BKX +1.03%) and the Broker/Dealer Index ($XBD +1.33%) posted influential gains on Monday. The Networking Index ($NWX +2.10%), Biotechnology Index ($BTK +1.99%), and Semiconductor Index ($SOX +1.05%) posted solid gains which helped the Nasdaq Composite Index outpace the other major indices. Energy-related shares had a positive bias as the Integrated Oil Index ($XOI +0.34%) and the Oil Services Index ($OSX +0.86%) posted modest gains. The Retail Index ($RLX +0.16%) and the Gold & Silver Index ($XAU +0.27%) also edged higher.
Charts courtesy www.stockcharts.com
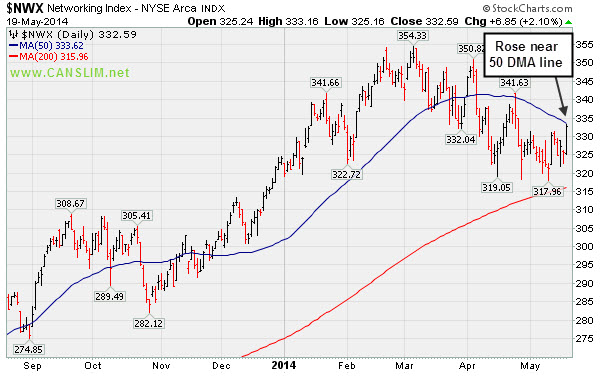
PICTURED: The Networking Index ($NWX +2.10%) rose near its 50-day moving average (DMA) line.
| Oil Services |
$OSX |
284.61 |
+2.43 |
+0.86% |
+1.27% |
| Integrated Oil |
$XOI |
1,610.00 |
+5.44 |
+0.34% |
+7.11% |
| Semiconductor |
$SOX |
582.05 |
+6.04 |
+1.05% |
+8.79% |
| Networking |
$NWX |
332.59 |
+6.86 |
+2.10% |
+2.67% |
| Broker/Dealer |
$XBD |
150.96 |
+1.98 |
+1.33% |
-5.98% |
| Retail |
$RLX |
853.29 |
+1.39 |
+0.16% |
-9.21% |
| Gold & Silver |
$XAU |
89.10 |
+0.24 |
+0.27% |
+5.88% |
| Bank |
$BKX |
67.50 |
+0.69 |
+1.03% |
-2.54% |
| Biotech |
$BTK |
2,551.89 |
+49.86 |
+1.99% |
+9.50% |
|
|
|
 |
Submit Your Request for a Featured Stock Update
Kenneth J. Gruneisen - Passed the CAN SLIM® Master's Exam
Market conditions (the M criteria) are challenging at times. There are few stocks included on the Featured Stocks list and none of the companies need additional review in detail with annotated graphs. At times like these we have an opportunity to look back and review previously featured stocks which were dropped. This can serve as an educational review of the investment system's tactics. It is also a reminder that high-ranked leaders eventually fall out of favor. If you wish to request for a specific stock to receive more detailed coverage in this section please use the inquiry form to submit your request. Thank you! |
|
|
Color Codes Explained :
Y - Better candidates highlighted by our
staff of experts.
G - Previously featured
in past reports as yellow but may no longer be buyable under the
guidelines.
***Last / Change / Volume data in this table is the closing quote data***
Symbol/Exchange
Company Name
Industry Group |
PRICE |
CHANGE
(%Change) |
Day High |
Volume
(% DAV)
(% 50 day avg vol) |
52 Wk Hi
% From Hi |
Featured
Date |
Price
Featured |
Pivot Featured |
|
Max Buy |
AL
-
NYSE
Air Lease Corp Cl A
DIVERSIFIED SERVICES - Rental and Leasing Services
|
$38.73
|
+0.36
0.94% |
$38.85
|
714,094
101.87% of 50 DAV
50 DAV is 701,000
|
$40.36
-4.04%
|
5/9/2014
|
$38.27
|
PP = $38.25
|
|
MB = $40.16
|
Most Recent Note - 5/13/2014 5:53:03 PM
Y - Small loss today with above average volume. Rallied near its "max buy" level with volume-driven gains. Prior highs near $38 define near-term support to watch on pullbacks.
>>> FEATURED STOCK ARTICLE : Volume Heavy Following Gap Up Gain for New 52-Week High - 5/9/2014
View all notes |
Set NEW NOTE alert |
CANSLIM.net Company Profile |
SEC
News |
Chart |
Request a new note
C
A N
S L
I M


|
EQM
-
NYSE
E Q T Midstream Partners
ENERGY - Oil and Gas Pipelines
|
$77.66
|
-0.19
-0.24% |
$78.33
|
82,585
34.99% of 50 DAV
50 DAV is 236,000
|
$78.67
-1.28%
|
12/12/2013
|
$53.17
|
PP = $56.51
|
|
MB = $59.34
|
Most Recent Note - 5/16/2014 6:15:21 PM
G - Inched higher today for a best ever close with a gain on light volume. Completed a new Public Offering of 10.75 Million common units on 5/01/14. Fundamental concerns remain after 2 consecutive sub par quarters below the +25% minimum earnings guideline. Its 50 DMA line defines near-term support where a violation may trigger a technical sell signal. See the latest FSU analysis for more details and new annotated graphs.
>>> FEATURED STOCK ARTICLE : Best Ever Close With Light Volume Gain - 5/16/2014
View all notes |
Set NEW NOTE alert |
CANSLIM.net Company Profile |
SEC
News |
Chart |
Request a new note
C
A N
S L
I M
|
GRFS
-
NASDAQ
Grifols Sa Ads
Medical-Ethical Drugs
|
$42.12
|
+1.34
3.29% |
$42.36
|
1,141,392
188.97% of 50 DAV
50 DAV is 604,000
|
$43.45
-3.06%
|
5/15/2014
|
$41.14
|
PP = $43.55
|
|
MB = $45.73
|
 Most Recent Note - 5/19/2014 6:28:14 PM
Y - Tallied a solid gain today with above average volume, approaching the pivot point. This Spanish firm from the Medical- Ethical Drugs industry has little resistance remaining due to overhead supply. Subsequent volume-driven gains for new highs are needed to trigger a technical buy signal.
>>> FEATURED STOCK ARTICLE : Perched Within Close Striking Distance of New Highs - 5/15/2014
View all notes |
Set NEW NOTE alert |
CANSLIM.net Company Profile |
SEC
News |
Chart |
Request a new note
C
A N
S L
I M
|
ICON
-
NASDAQ
Iconix Brand Group Inc
CONSUMER NON-DURABLES - Textile - Apparel Footwear
|
$41.92
|
+0.45
1.09% |
$42.10
|
654,542
111.32% of 50 DAV
50 DAV is 588,000
|
$43.34
-3.28%
|
4/30/2014
|
$42.50
|
PP = $42.57
|
|
MB = $44.70
|
Most Recent Note - 5/14/2014 5:57:33 PM
Y - Reported earnings +33% on +11% sales revenues for the Mar '14 quarter, continuing its streak of earning increases above the +25% minimum guideline (C criteria). Finished in the upper third of its intra-day range today after slumping near its 50 DMA line. A violation of that short-term average would raise concerns and trigger a technical sell signal. Confirming gains above the pivot point with above average volume could trigger a new (or add-on) technical buy signal.
>>> FEATURED STOCK ARTICLE : Stalled After Hitting a New 52-Week High - 5/7/2014
View all notes |
Set NEW NOTE alert |
CANSLIM.net Company Profile |
SEC
News |
Chart |
Request a new note
C
A N
S L
I M
|
TRN
-
NYSE
Trinity Industries Inc
TRANSPORTATION - Railroads
|
$82.43
|
+1.34
1.65% |
$82.85
|
1,247,215
97.29% of 50 DAV
50 DAV is 1,282,000
|
$82.04
0.48%
|
4/30/2014
|
$75.57
|
PP = $76.05
|
|
MB = $79.85
|
Most Recent Note - 5/13/2014 5:46:36 PM
G - Rallied further above its "max buy" level with today's 8th consecutive volume-driven gain. Prior highs in the $75-76 area define near-term support to watch on pullbacks.
>>> FEATURED STOCK ARTICLE : Rose Beyond "Max Buy" Level With 7th Consecutive Gain - 5/12/2014
View all notes |
Set NEW NOTE alert |
CANSLIM.net Company Profile |
SEC
News |
Chart |
Request a new note
C
A N
S L
I M
|
Symbol/Exchange
Company Name
Industry Group |
PRICE |
CHANGE
(%Change) |
Day High |
Volume
(% DAV)
(% 50 day avg vol) |
52 Wk Hi
% From Hi |
Featured
Date |
Price
Featured |
Pivot Featured |
|
Max Buy |
WLK
-
NYSE
Westlake Chemical Corp
CHEMICALS - Specialty Chemicals
|
$76.22
|
+0.77
1.02% |
$77.29
|
560,257
82.03% of 50 DAV
50 DAV is 683,000
|
$77.64
-1.83%
|
4/29/2014
|
$72.79
|
PP = $69.31
|
|
MB = $72.78
|
Most Recent Note - 5/13/2014 5:47:53 PM
G - Quietly consolidating -3.7% off its 52-week high. Prior highs in the $69 area define near-term support to watch. Reported +28% earnings on +19% sales for the Mar '14 quarter.
>>> FEATURED STOCK ARTICLE : Extended From Base Following Volume Driven Gains - 5/8/2014
View all notes |
Set NEW NOTE alert |
CANSLIM.net Company Profile |
SEC
News |
Chart |
Request a new note
C
A N
S L
I M
|
|
|
|
THESE ARE NOT BUY RECOMMENDATIONS!
Comments contained in the body of this report are technical
opinions only. The material herein has been obtained
from sources believed to be reliable and accurate, however,
its accuracy and completeness cannot be guaranteed.
This site is not an investment advisor, hence it does
not endorse or recommend any securities or other investments.
Any recommendation contained in this report may not
be suitable for all investors and it is not to be deemed
an offer or solicitation on our part with respect to
the purchase or sale of any securities. All trademarks,
service marks and trade names appearing in this report
are the property of their respective owners, and are
likewise used for identification purposes only.
This report is a service available
only to active Paid Premium Members.
You may opt-out of receiving report notifications
at any time. Questions or comments may be submitted
by writing to Premium Membership Services 665 S.E. 10 Street, Suite 201 Deerfield Beach, FL 33441-5634 or by calling 1-800-965-8307
or 954-785-1121.
|
|
|

