You are not logged in.
This means you
CAN ONLY VIEW reports that were published prior to Tuesday, April 15, 2025.
You
MUST UPGRADE YOUR MEMBERSHIP if you want to see any current reports.
AFTER MARKET UPDATE - THURSDAY, MAY 15TH, 2014
Previous After Market Report Next After Market Report >>>
|
|
|
|
DOW |
-167.16 |
16,446.81 |
-1.01% |
|
Volume |
733,036,210 |
+21% |
|
Volume |
1,929,874,930 |
+18% |
|
NASDAQ |
-31.33 |
4,069.29 |
-0.76% |
|
Advancers |
928 |
29% |
|
Advancers |
838 |
29% |
|
S&P 500 |
-17.68 |
1,870.85 |
-0.94% |
|
Decliners |
2,130 |
67% |
|
Decliners |
1,919 |
67% |
|
Russell 2000 |
-7.15 |
1,095.99 |
-0.65% |
|
52 Wk Highs |
51 |
|
|
52 Wk Highs |
16 |
|
|
S&P 600 |
-3.29 |
633.97 |
-0.52% |
|
52 Wk Lows |
53 |
|
|
52 Wk Lows |
120 |
|
|
 |
Leadership Wanes as Major Averages Face Distributional Pressure
Kenneth J. Gruneisen - Passed the CAN SLIM® Master's Exam
On Thursday stocks were under pressure and the major indices finished lower. The volume was reported higher than the prior session total on the NYSE and on the Nasdaq exchange, a sign of distributional pressure or selling from the institutional crowd. Breadth was negative as decliners led advancers by more than a 2-1 margin on the NYSE and on the Nasdaq exchange. Leadership contracted as there were only 5 high-ranked companies from the CANSLIM.net Leaders List that made new 52-week highs and appeared on the CANSLIM.net BreakOuts Page, down from the total of 13 stocks on the prior session. New 52-week lows outnumbered new 52-week highs on the NYSE and on the Nasdaq exchange. There were losses for all 6 high-ranked companies currently included on the Featured Stocks Page. It was recently noted that the Dow Jones Industrial Average and S&P 500 Index both tallied gains into new high territory. Technically that is favorable, however, uncertain market action overall has led the newspaper to still hold off from officially shifting its view that the market direction (M criteria) is back in a "confirmed uptrend". While awaiting a more definitive read on the market any new buying efforts should be very selective and only focused in stocks meeting all key criteria of the fact-based investment system. Keep in mind that any sustained and meaningful market advance requires leadership - a healthy crop of stocks hitting new 52-week highs.
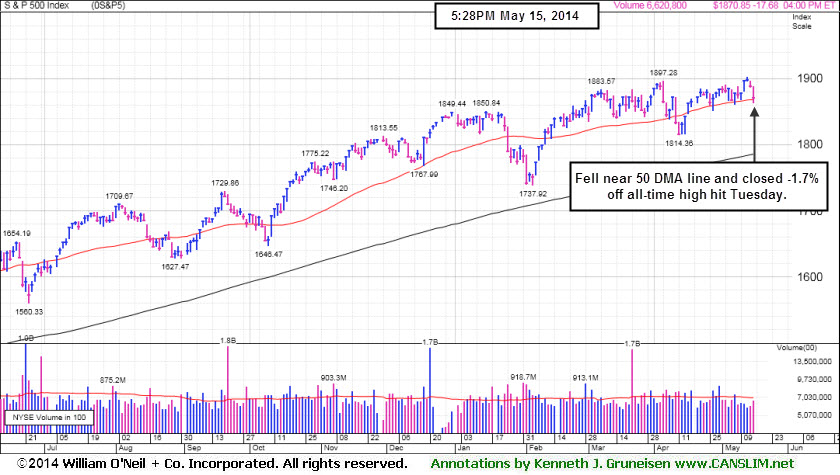
A batch of disappointing economic data was in focus Thursday as the Dow fell 167 points to 16,446. The S&P 500 lost 17 points to 1,870. The NASDAQ declined 31 points to 4,069.
Industrial production declined in April by the most since August 2012 and the Philadelphia Fed's manufacturing index slipped this month. Meanwhile, homebuilder confidence fell to the lowest level since last May. Additional pressure came from a resumed selloff in small-cap and internet stocks as investors took profits from last year's impressive returns. The Russell 2000 Index fell for a third day and is down about -9% from its March high.
Facebook (FB -2.21%) and Google (GOOGL -0.98%) declined. Nine of the 10 S&P 500 sectors retreated. Materials and energy were the worst performing groups as. Freeport-McMoRan (FCX -0.82%). and Exxon Mobil (XOM -1.48%) fell while commodity prices declined. Financial and consumer stocks were also notably weak as JP Morgan Chase & Co (JPM -1.56%).slumped and Wal-Mart (WMT -2.43%) fell after posting a disappointing profit tally.
Treasuries extended their recent rally. The 10-year note rose 12/32 to yield 2.50%. The 30-year bond gained 27/32 yield 3.33%.
The CANSLIM.net Featured Stocks Page shows the most action-worthy candidates and their latest notes and a Headline Link directs members to the latest detailed analysis with data-packed graphs annotated by a Certified expert along with links to additional resources. The Premium Member Homepage includes "dynamic archives" to all prior pay reports published. Watch for an announcement via email concerning the next WEBCAST.
PICTURED: The S&P 500 Index fell near its 50-day moving average line and finished -1.7% off its all-time high hit on Tuesday.
|
 Kenneth J. Gruneisen started out as a licensed stockbroker in August 1987, a couple of months prior to the historic stock market crash that took the Dow Jones Industrial Average down -22.6% in a single day. He has published daily fact-based fundamental and technical analysis on high-ranked stocks online for two decades. Through FACTBASEDINVESTING.COM, Kenneth provides educational articles, news, market commentary, and other information regarding proven investment systems that work in good times and bad.
Comments contained in the body of this report are technical opinions only and are not necessarily those of Gruneisen Growth Corp. The material herein has been obtained from sources believed to be reliable and accurate, however, its accuracy and completeness cannot be guaranteed. Our firm, employees, and customers may effect transactions, including transactions contrary to any recommendation herein, or have positions in the securities mentioned herein or options with respect thereto. Any recommendation contained in this report may not be suitable for all investors and it is not to be deemed an offer or solicitation on our part with respect to the purchase or sale of any securities. |
|
 |
Financial, Retail, and Commodity-Linked Groups Fell
Kenneth J. Gruneisen - Passed the CAN SLIM® Master's Exam
Losses for the Broker/Dealer Index ($XBD -2.17%) and the Bank Index ($BKX -1.05%) weighed on the major averages and the Retail Index ($RLX -1.06%) was also a negative influence. Commodity-linked groups also faced pressure as the Oil Services Index ($OSX -1.52%), Integrated Oil Index ($XOI -1.09%), and the Gold & Silver Index ($XAU -1.41%) lost ground. The Networking Index ($NWX +0.76%) posted a modest gain, meanwhile the Semiconductor Index ($SOX -1.18%) and the Biotechnology Index ($BTK -1.79%) both fell, rounding out a mostly negtaive session.
Charts courtesy www.stockcharts.com
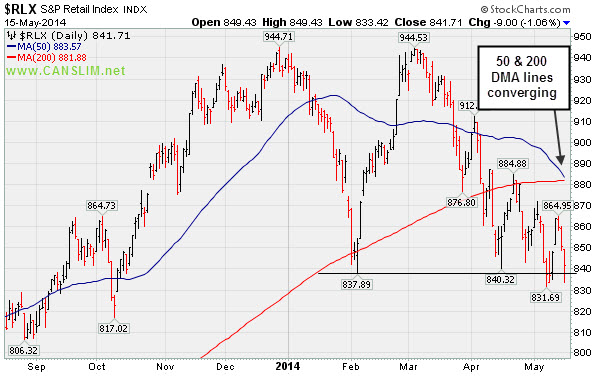
PICTURED: The Retail Index ($RLX -1.06%) is slumping near prior lows. Its 50-day and 20-day moving average (DMA) lines are converging and the short-term average has nearly crossed over the longer-term average which would be a bearish sign.
| Oil Services |
$OSX |
282.08 |
-4.36 |
-1.52% |
+0.37% |
| Integrated Oil |
$XOI |
1,609.97 |
-17.67 |
-1.09% |
+7.11% |
| Semiconductor |
$SOX |
570.00 |
-6.80 |
-1.18% |
+6.54% |
| Networking |
$NWX |
327.31 |
+2.46 |
+0.76% |
+1.04% |
| Broker/Dealer |
$XBD |
148.51 |
-3.29 |
-2.17% |
-7.50% |
| Retail |
$RLX |
841.71 |
-9.00 |
-1.06% |
-10.44% |
| Gold & Silver |
$XAU |
89.68 |
-1.28 |
-1.41% |
+6.57% |
| Bank |
$BKX |
66.96 |
-0.71 |
-1.05% |
-3.32% |
| Biotech |
$BTK |
2,509.02 |
-45.67 |
-1.79% |
+7.66% |
|
|
|
 |
Perched Within Close Striking Distance of New Highs
Kenneth J. Gruneisen - Passed the CAN SLIM® Master's Exam
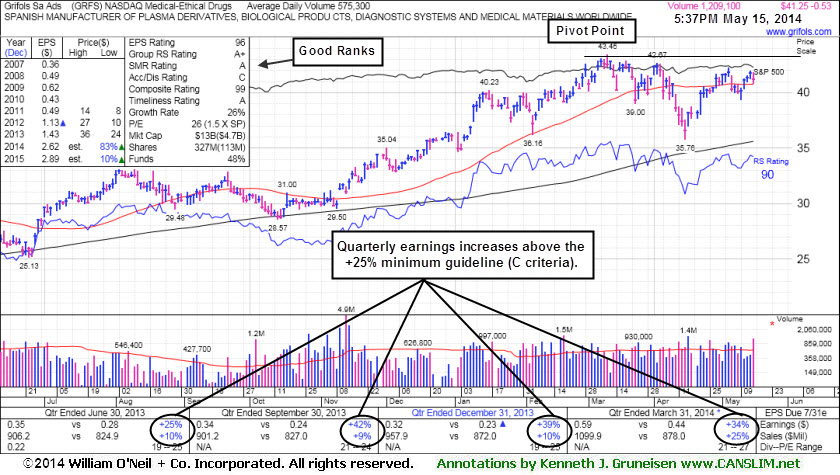
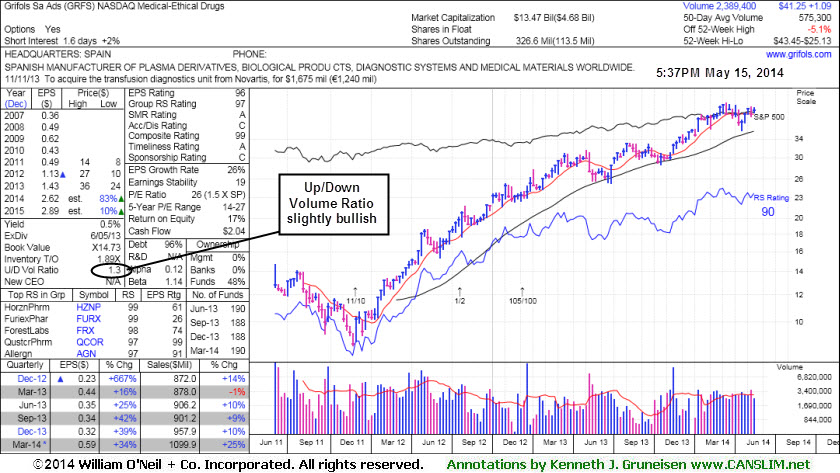
Grifols Sa Ads (GRFS -$0.53 or -1.27% to $41.25) was highlighted in yellow with pivot point cited based on its 3/11/14 high plus 10 cents in the earlier mid-day report (read here). This Spanish firm from the Medical- Ethical Drugs industry is consolidating near its 50-day moving average (DMA) line with little resistance remaining due to overhead supply. Subsequent volume-driven gains for new highs (N criteria) are needed to trigger a technical buy signal. Meanwhile, it is an ideal candidate for investors' watch lists.
It reported earnings +34% on +25% sales revenues for the Mar '14 quarter, marking its 4th consecutive quarter with earnings above the +25% minimum guideline (C criteria). Its annual earnings history (A criteria) has also been strong. The current Up/Down Volume Ratio of 1.3 is above the neutral 1.0 reading, an unbiased indication its shares have been under accumulation over the past 50 days.
|
|
|
Color Codes Explained :
Y - Better candidates highlighted by our
staff of experts.
G - Previously featured
in past reports as yellow but may no longer be buyable under the
guidelines.
***Last / Change / Volume data in this table is the closing quote data***
Symbol/Exchange
Company Name
Industry Group |
PRICE |
CHANGE
(%Change) |
Day High |
Volume
(% DAV)
(% 50 day avg vol) |
52 Wk Hi
% From Hi |
Featured
Date |
Price
Featured |
Pivot Featured |
|
Max Buy |
AL
-
NYSE
Air Lease Corp Cl A
DIVERSIFIED SERVICES - Rental and Leasing Services
|
$38.46
|
-0.68
-1.74% |
$39.16
|
629,786
89.71% of 50 DAV
50 DAV is 702,000
|
$40.36
-4.71%
|
5/9/2014
|
$38.27
|
PP = $38.25
|
|
MB = $40.16
|
Most Recent Note - 5/13/2014 5:53:03 PM
Y - Small loss today with above average volume. Rallied near its "max buy" level with volume-driven gains. Prior highs near $38 define near-term support to watch on pullbacks.
>>> FEATURED STOCK ARTICLE : Volume Heavy Following Gap Up Gain for New 52-Week High - 5/9/2014
View all notes |
Set NEW NOTE alert |
CANSLIM.net Company Profile |
SEC
News |
Chart |
Request a new note
C
A N
S L
I M


|
EQM
-
NYSE
E Q T Midstream Partners
ENERGY - Oil and Gas Pipelines
|
$76.74
|
-0.70
-0.90% |
$77.50
|
94,476
40.20% of 50 DAV
50 DAV is 235,000
|
$78.67
-2.45%
|
12/12/2013
|
$53.17
|
PP = $56.51
|
|
MB = $59.34
|
Most Recent Note - 5/13/2014 5:44:26 PM
G - Inched higher today for a 5th consecutive small gain on lighter volume, still hovering near its all-time high. Completed a new Public Offering of 10.75 Million common units on 5/01/14. Fundamental concerns remain after 2 consecutive sub par quarters below the +25% minimum earnings guideline. Its 50 DMA line ($71.34) defines near-term support where a violation may trigger a technical sell signal.
>>> FEATURED STOCK ARTICLE : Stength Contiunues; Earnings Below +25% Minimum Guideline for a 2nd Quarter - 4/28/2014
View all notes |
Set NEW NOTE alert |
CANSLIM.net Company Profile |
SEC
News |
Chart |
Request a new note
C
A N
S L
I M
|
GRFS
-
NASDAQ
Grifols Sa Ads
Medical-Ethical Drugs
|
$41.25
|
-0.53
-1.27% |
$41.85
|
1,209,173
210.29% of 50 DAV
50 DAV is 575,000
|
$43.45
-5.06%
|
5/15/2014
|
$41.14
|
PP = $43.55
|
|
MB = $45.73
|
 Most Recent Note - 5/15/2014 5:52:49 PM
Y - Highlighted in yellow with pivot point cited based on its 3/11/14 high plus 10 cents in the earlier mid-day report (read here). This Spanish firm from the Medical- Ethical Drugs industry is consolidating near its 50 DMA line with little resistance remaining due to overhead supply. Subsequent volume-driven gains for new highs are needed to trigger a technical buy signal. Reported earnings +34% on +25% sales revenues for the Mar '14 quarter, marking its 4th consecutive quarter with earnings above the +25% minimum guideline (C criteria). See the latest FSU analysis for more details and annotated graphs.
>>> FEATURED STOCK ARTICLE : Perched Within Close Striking Distance of New Highs - 5/15/2014
View all notes |
Set NEW NOTE alert |
CANSLIM.net Company Profile |
SEC
News |
Chart |
Request a new note
C
A N
S L
I M
|
ICON
-
NASDAQ
Iconix Brand Group Inc
CONSUMER NON-DURABLES - Textile - Apparel Footwear
|
$41.30
|
-0.43
-1.03% |
$41.63
|
354,656
59.11% of 50 DAV
50 DAV is 600,000
|
$43.34
-4.71%
|
4/30/2014
|
$42.50
|
PP = $42.57
|
|
MB = $44.70
|
Most Recent Note - 5/14/2014 5:57:33 PM
Y - Reported earnings +33% on +11% sales revenues for the Mar '14 quarter, continuing its streak of earning increases above the +25% minimum guideline (C criteria). Finished in the upper third of its intra-day range today after slumping near its 50 DMA line. A violation of that short-term average would raise concerns and trigger a technical sell signal. Confirming gains above the pivot point with above average volume could trigger a new (or add-on) technical buy signal.
>>> FEATURED STOCK ARTICLE : Stalled After Hitting a New 52-Week High - 5/7/2014
View all notes |
Set NEW NOTE alert |
CANSLIM.net Company Profile |
SEC
News |
Chart |
Request a new note
C
A N
S L
I M
|
TRN
-
NYSE
Trinity Industries Inc
TRANSPORTATION - Railroads
|
$80.33
|
-0.82
-1.01% |
$81.24
|
1,947,635
153.84% of 50 DAV
50 DAV is 1,266,000
|
$82.04
-2.08%
|
4/30/2014
|
$75.57
|
PP = $76.05
|
|
MB = $79.85
|
Most Recent Note - 5/13/2014 5:46:36 PM
G - Rallied further above its "max buy" level with today's 8th consecutive volume-driven gain. Prior highs in the $75-76 area define near-term support to watch on pullbacks.
>>> FEATURED STOCK ARTICLE : Rose Beyond "Max Buy" Level With 7th Consecutive Gain - 5/12/2014
View all notes |
Set NEW NOTE alert |
CANSLIM.net Company Profile |
SEC
News |
Chart |
Request a new note
C
A N
S L
I M
|
Symbol/Exchange
Company Name
Industry Group |
PRICE |
CHANGE
(%Change) |
Day High |
Volume
(% DAV)
(% 50 day avg vol) |
52 Wk Hi
% From Hi |
Featured
Date |
Price
Featured |
Pivot Featured |
|
Max Buy |
WLK
-
NYSE
Westlake Chemical Corp
CHEMICALS - Specialty Chemicals
|
$74.03
|
-0.46
-0.62% |
$74.64
|
656,455
95.97% of 50 DAV
50 DAV is 684,000
|
$77.64
-4.65%
|
4/29/2014
|
$72.79
|
PP = $69.31
|
|
MB = $72.78
|
Most Recent Note - 5/13/2014 5:47:53 PM
G - Quietly consolidating -3.7% off its 52-week high. Prior highs in the $69 area define near-term support to watch. Reported +28% earnings on +19% sales for the Mar '14 quarter.
>>> FEATURED STOCK ARTICLE : Extended From Base Following Volume Driven Gains - 5/8/2014
View all notes |
Set NEW NOTE alert |
CANSLIM.net Company Profile |
SEC
News |
Chart |
Request a new note
C
A N
S L
I M
|
|
|
|
THESE ARE NOT BUY RECOMMENDATIONS!
Comments contained in the body of this report are technical
opinions only. The material herein has been obtained
from sources believed to be reliable and accurate, however,
its accuracy and completeness cannot be guaranteed.
This site is not an investment advisor, hence it does
not endorse or recommend any securities or other investments.
Any recommendation contained in this report may not
be suitable for all investors and it is not to be deemed
an offer or solicitation on our part with respect to
the purchase or sale of any securities. All trademarks,
service marks and trade names appearing in this report
are the property of their respective owners, and are
likewise used for identification purposes only.
This report is a service available
only to active Paid Premium Members.
You may opt-out of receiving report notifications
at any time. Questions or comments may be submitted
by writing to Premium Membership Services 665 S.E. 10 Street, Suite 201 Deerfield Beach, FL 33441-5634 or by calling 1-800-965-8307
or 954-785-1121.
|
|
|

