***Last / Change / Volume data in this table is the closing quote data***
Symbol/Exchange
Company Name
Industry Group |
PRICE |
CHANGE
(%Change) |
Day High |
Volume
(% DAV)
(% 50 day avg vol) |
52 Wk Hi
% From Hi |
Featured
Date |
Price
Featured |
Pivot Featured |
|
Max Buy |
MLR
-
NYSE
Miller Industries Inc
AUTOMOTIVE - Auto Parts
|
$32.00
|
-0.80
-2.44% |
$32.56
|
49,316
117.42% of 50 DAV
50 DAV is 42,000
|
$35.26
-9.25%
|
11/30/2018
|
$28.35
|
PP = $29.50
|
|
MB = $30.98
|
 Most Recent Note - 5/13/2019 12:39:20 PM
G - Slumping below its 50 DMA line ($32.77). Prior low ($30.38 on 3/27/19) defines the next near-term support to watch. Reported March '19 quarterly earnings +29% on +24% sales revenues versus the year ago period, above the +25% minimum earnings guideline (C criteria).
>>> FEATURED STOCK ARTICLE : Below 50-Day Average After Damaging Losses - 4/8/2019 |
View all notes |
Set NEW NOTE alert |
Company Profile |
SEC
News |
Chart |
Request a new note
C
A
S
I |
NSP
-
NYSE
Insperity Inc
Comml Svcs-Outsourcing
|
$111.82
|
-4.56
-3.92% |
$114.57
|
363,702
108.57% of 50 DAV
50 DAV is 335,000
|
$132.50
-15.61%
|
4/16/2019
|
$129.59
|
PP = $132.60
|
|
MB = $139.23
|
Most Recent Note - 5/13/2019 5:29:06 PM
A rebound above the 50 DMA line ($123) is needed for its outlook to improve. Today's 6th consecutive loss tested its 200 DMA line ($112). Recently reported earnings +40% on +14% sales revenues for the Mar '19 quarter. It will be dropped from the Featured Stocks list tonight.
>>> FEATURED STOCK ARTICLE : Rebound Above 50-Day Moving Average Line Needed - 4/23/2019 |
View all notes |
Set NEW NOTE alert |
Company Profile |
SEC
News |
Chart |
Request a new note
C
A
S
I |
FTNT
-
NASDAQ
Fortinet Inc
Computer Sftwr-Security
|
$79.49
|
-3.41
-4.11% |
$81.76
|
1,917,413
108.15% of 50 DAV
50 DAV is 1,773,000
|
$96.96
-18.02%
|
4/10/2019
|
$89.76
|
PP = $88.70
|
|
MB = $93.14
|
Most Recent Note - 5/13/2019 5:31:04 PM
Slumped to close below its 200 DMA line ($80.02) and it will be dropped from the Featured Stocks list tonight. A rebound above the 50 DMA line ($86.62) is needed for its outlook to improve. Weak action came after it reported earnings +39% on +18% sales revenues for the Mar '19 quarter versus the year ago period.
>>> FEATURED STOCK ARTICLE : Volume-Driven Gain Cleared Flat Base and Little Resistance Remains - 4/10/2019 |
View all notes |
Set NEW NOTE alert |
Company Profile |
SEC
News |
Chart |
Request a new note
C
A
S
I |
SPSC
-
NASDAQ
S P S Commerce Inc
COMPUTER SOFTWARE and SERVICES - Application Software
|
$102.15
|
-2.21
-2.12% |
$103.07
|
134,936
91.79% of 50 DAV
50 DAV is 147,000
|
$115.00
-11.17%
|
3/26/2019
|
$107.12
|
PP = $113.41
|
|
MB = $119.08
|
Most Recent Note - 5/8/2019 1:37:07 PM
G - Consolidating near its 50 DMA line ($105.49). Prior highs in the $98-100 area define important near-term support to watch. Reported earnings +54% on +13% sales revenues for the quarter ended March 31, 2019 versus the year ago period.
>>> FEATURED STOCK ARTICLE : Sputtering Near 50-Day Average Line Building Base-On-Base - 5/1/2019 |
View all notes |
Set NEW NOTE alert |
Company Profile |
SEC
News |
Chart |
Request a new note
C
A
S
I |
SSNC
-
NASDAQ
S S & C Technologies
COMPUTER SOFTWARE and SERVICES - Application Software
|
$56.61
|
-2.25
-3.82% |
$57.96
|
1,460,574
93.21% of 50 DAV
50 DAV is 1,567,000
|
$67.73
-16.42%
|
2/15/2019
|
$59.73
|
PP = $61.07
|
|
MB = $64.12
|
Most Recent Note - 5/13/2019 5:26:10 PM
Slumped further below its 50 DMA line ($62.88) today and it will be dropped from the Featured Stocks list tonight. Reported earnings +72% on +170% sales revenues for the Mar '19 quarter and fundamentals remain strong.
>>> FEATURED STOCK ARTICLE : Needs Rebound Above 50-Day Average for Outlook to Improve - 5/8/2019 |
View all notes |
Set NEW NOTE alert |
Company Profile |
SEC
News |
Chart |
Request a new note
C
A
S
I |
Symbol/Exchange
Company Name
Industry Group |
PRICE |
CHANGE
(%Change) |
Day High |
Volume
(% DAV)
(% 50 day avg vol) |
52 Wk Hi
% From Hi |
Featured
Date |
Price
Featured |
Pivot Featured |
|
Max Buy |
EPAM
-
NYSE
Epam Systems Inc
COMPUTER SOFTWARE and SERVICES - Information Technology Service
|
$163.97
|
-7.17
-4.19% |
$167.61
|
422,203
122.38% of 50 DAV
50 DAV is 345,000
|
$180.55
-9.18%
|
5/9/2019
|
$169.25
|
PP = $180.55
|
|
MB = $189.58
|
Most Recent Note - 5/9/2019 5:27:48 PM
Y - Showed resilience after gapping down today violating its 50 DMA line ($170). Highlighted in yellow in the earlier mid-day report, although it is extended from any recent base, after finding support at the 10 WMA it is considered a valid "secondary buy point" up to +5% above the latest high. Reported earnings +34% on +23% sales revenues for the Mar '19 quarter, continuing its strong earnings track record. Showed resilience and strength after slumping below its 200 DMA line when dropped from the Featured Stocks list on 10/10/18. See the latest FSU analysis for more details and a new annotated graph.
>>> FEATURED STOCK ARTICLE : Found Support and Closed in Upper Third of Day's Range - 5/9/2019 |
View all notes |
Set NEW NOTE alert |
Company Profile |
SEC
News |
Chart |
Request a new note
C
A
S
I |
AUDC
-
NASDAQ
Audiocodes Ltd
ELECTRONICS - Scientific and Technical Instrum
|
$13.73
|
-0.62
-4.32% |
$14.03
|
225,512
102.51% of 50 DAV
50 DAV is 220,000
|
$17.44
-21.27%
|
3/20/2019
|
$13.66
|
PP = $15.06
|
|
MB = $15.81
|
Most Recent Note - 5/13/2019 5:21:45 PM
Slumped further below its 50 DMA line ($14.57) with today's big loss. It will be dropped from the Featured Stocks list tonight. A rebound above the 50 DMA line is needed for its outlook to improve. Weak action came after reporting earnings +38% on +10% sales revenues for the Mar '19 quarter, still above the +25% minimum earnings guideline (C criteria).
>>> FEATURED STOCK ARTICLE : Earnings News Due for Israel-Based VOIP Firm - 4/29/2019 |
View all notes |
Set NEW NOTE alert |
Company Profile |
SEC
News |
Chart |
Request a new note
C
A
S
I |
ENV
-
NYSE
Envestnet Inc
FINANCIAL SERVICES - Diversified Investments
|
$66.62
|
-1.65
-2.42% |
$67.38
|
258,673
79.84% of 50 DAV
50 DAV is 324,000
|
$72.67
-8.33%
|
3/15/2019
|
$66.05
|
PP = $64.90
|
|
MB = $68.15
|
Most Recent Note - 5/9/2019 12:32:52 PM
G - Gapped down today and undercut its 50 DMA line ($66.77) after reporting earnings +5% on +1% sales revenues for the Mar '19 quarter, below the +25% minimum earnings guideline (C criteria). The prior high ($64.80 on 9/14/18) define near-term support to watch on pullbacks.
>>> FEATURED STOCK ARTICLE : Negative Reversal After Another New High - 4/24/2019 |
View all notes |
Set NEW NOTE alert |
Company Profile |
SEC
News |
Chart |
Request a new note
C
A
S
I |
LHCG
-
NASDAQ
L H C Group Inc
HEALTH SERVICES - Home Health Care
|
$114.13
|
-2.00
-1.72% |
$115.27
|
146,327
55.64% of 50 DAV
50 DAV is 263,000
|
$116.74
-2.24%
|
4/29/2019
|
$110.94
|
PP = $115.64
|
|
MB = $121.42
|
Most Recent Note - 5/9/2019 3:58:09 PM
Y - Reported earnings +56% on +73% sales revenues for the Mar '19 quarter, continuing its strong earnings track record. Found support near its 50 DMA line today, now challenging its all-time high and near the new pivot point cited based on its 3/22/19 high plus 10 cents. Subsequent gains above the pivot point backed by at least +40% above average volume may trigger a new (or add-on) technical buy signal. Found prompt support at its 200 DMA line.
>>> FEATURED STOCK ARTICLE : Sputtering Near 50-Day Moving Average Line - 4/1/2019 |
View all notes |
Set NEW NOTE alert |
Company Profile |
SEC
News |
Chart |
Request a new note
C
A
S
I |
ENSG
-
NASDAQ
Ensign Group Inc
HEALTH SERVICES - Long-Term Care Facilities
|
$56.04
|
+2.07
3.84% |
$56.35
|
657,096
236.37% of 50 DAV
50 DAV is 278,000
|
$54.56
2.71%
|
4/30/2019
|
$51.46
|
PP = $53.30
|
|
MB = $55.97
|
Most Recent Note - 5/13/2019 12:32:48 PM
Y - Inching within close striking distance of its all-time high with today's 4th consecutive gain. Wedged above the new pivot point cited based on its 4/05/19 high, however, gains above the pivot must have at least +40% above average volume to trigger a proper technical buy signal. Reported earnings +22% on +12% sales revenues for the Mar '19 quarter, below the +25% minimum earnings guideline (C criteria), raising fundamental concerns. Volume and volatility often increase near earnings news.
>>> FEATURED STOCK ARTICLE : Two Damaging Losses Hurt Outlook - 4/17/2019 |
View all notes |
Set NEW NOTE alert |
Company Profile |
SEC
News |
Chart |
Request a new note
C
A
S
I |
Symbol/Exchange
Company Name
Industry Group |
PRICE |
CHANGE
(%Change) |
Day High |
Volume
(% DAV)
(% 50 day avg vol) |
52 Wk Hi
% From Hi |
Featured
Date |
Price
Featured |
Pivot Featured |
|
Max Buy |
LULU
-
NASDAQ
Lululemon Athletica
MANUFACTURING - Textile Manufacturing
|
$167.57
|
-6.11
-3.52% |
$171.13
|
2,019,051
89.42% of 50 DAV
50 DAV is 2,258,000
|
$179.50
-6.65%
|
3/28/2019
|
$169.20
|
PP = $164.89
|
|
MB = $173.13
|
Most Recent Note - 5/10/2019 6:02:57 PM
G - Volume totals have been cooling while hovering near its high. Prior highs in the $164 area define initial support to watch above its 50 DMA line ($162.24). See the latest FSU analysis for more details and a new annotated graph.
>>> FEATURED STOCK ARTICLE : Volume Light While Hovering Near High - 5/10/2019 |
View all notes |
Set NEW NOTE alert |
Company Profile |
SEC
News |
Chart |
Request a new note
C
A
S
I |
NXST
-
NASDAQ
Nexstar Media Group Cl A
MEDIA - Broadcasting - TV
|
$106.30
|
-5.35
-4.79% |
$110.22
|
509,263
92.59% of 50 DAV
50 DAV is 550,000
|
$119.93
-11.36%
|
5/1/2019
|
$115.33
|
PP = $120.03
|
|
MB = $126.03
|
Most Recent Note - 5/13/2019 5:40:20 PM
G - Color code is changed to green after slumping below its 50 DMA line ($110) raising greater concerns. Reported earnings +14% on +2% sales revenues for the Mar '19 quarter. A rebound above the 50 DMA line is needed for its outlook to improve. Subsequent gains above the pivot point backed by at least +40% above average volume may trigger a new (or add-on) technical buy signal.
>>> FEATURED STOCK ARTICLE : Hitting New High and Very Extended From Prior Base - 4/4/2019 |
View all notes |
Set NEW NOTE alert |
Company Profile |
SEC
News |
Chart |
Request a new note
C
A
S
I |
ULTA
-
NASDAQ
Ulta Beauty Inc
SPECIALTY RETAIL - Specialty Retail, Other
|
$330.23
|
-13.01
-3.79% |
$338.98
|
812,798
105.97% of 50 DAV
50 DAV is 767,000
|
$359.69
-8.19%
|
3/15/2019
|
$341.27
|
PP = $322.59
|
|
MB = $338.72
|
Most Recent Note - 5/8/2019 1:43:04 PM
G - Found support at its 50 DMA line ($338) which defines important near term support above prior highs. A violation of the 50 DMA line and recent low ($334.94) would raise concerns and trigger a technical sell signal
>>> FEATURED STOCK ARTICLE : Volume Totals Cooling in Recent Weeks While Hovering Near High - 4/26/2019 |
View all notes |
Set NEW NOTE alert |
Company Profile |
SEC
News |
Chart |
Request a new note
C
A
S
I |
UBNT
-
NASDAQ
Ubiquiti Networks
TELECOMMUNICATIONS - Diversified Communication Serv
|
$130.95
|
-8.44
-6.05% |
$136.53
|
1,974,731
526.59% of 50 DAV
50 DAV is 375,000
|
$174.95
-25.15%
|
2/8/2019
|
$121.97
|
PP = $115.54
|
|
MB = $121.32
|
Most Recent Note - 5/13/2019 5:16:22 PM
Gapped down for a 3rd consecutive session today after prior losses triggered technical sell signals. A rebound above the 50 DMA line ($155) is needed for its outlook to improve. It will be dropped from the Featured Stocks list tonight. Recently reported earnings +29% on +14% sales revenues for the Mar '19 quarter.
>>> FEATURED STOCK ARTICLE : Extended From Any Sound Bass and Wedging to New Highs - 4/12/2019 |
View all notes |
Set NEW NOTE alert |
Company Profile |
SEC
News |
Chart |
Request a new note
C
A
S
I |
ESNT
-
NYSE
Essent Group Ltd
Finance-MrtgandRel Svc
|
$45.69
|
-1.62
-3.42% |
$46.50
|
598,515
93.37% of 50 DAV
50 DAV is 641,000
|
$48.88
-6.53%
|
3/18/2019
|
$45.84
|
PP = $45.06
|
|
MB = $47.31
|
Most Recent Note - 5/8/2019 12:33:03 PM
Y - Sputtering since it recently reported earnings +15% on +20% sales revenues for the Mar '19 quarter, below the +25% minimum earnings guideline (C criteria), raising fundamental concerns. Found support above its 50 DMA line ($45) reassuringly during the recent consolidation. Faces very little resistance due to overhead supply up to the $50 level.
>>> FEATURED STOCK ARTICLE : Perched Above Pivot Point With Earnings News Due May 3rd - 4/25/2019 |
View all notes |
Set NEW NOTE alert |
Company Profile |
SEC
News |
Chart |
Request a new note
C
A
S
I |
Symbol/Exchange
Company Name
Industry Group |
PRICE |
CHANGE
(%Change) |
Day High |
Volume
(% DAV)
(% 50 day avg vol) |
52 Wk Hi
% From Hi |
Featured
Date |
Price
Featured |
Pivot Featured |
|
Max Buy |
FIVE
-
NASDAQ
Five Below Inc
Retail-DiscountandVariety
|
$127.79
|
-7.59
-5.61% |
$131.81
|
1,047,062
93.32% of 50 DAV
50 DAV is 1,122,000
|
$148.22
-13.78%
|
4/11/2019
|
$132.05
|
PP = $133.75
|
|
MB = $140.44
|
Most Recent Note - 5/13/2019 5:37:52 PM
G - Pulled back today for a 6th consecutive loss and closed below its 50 DMA line ($128.83) raising greater concerns while also undercutting prior highs in the $133-136 area.
>>> FEATURED STOCK ARTICLE : Finished Strong After Featured Again in Mid-Day Report - 4/11/2019 |
View all notes |
Set NEW NOTE alert |
Company Profile |
SEC
News |
Chart |
Request a new note
C
A
S
I |
NOW
-
NYSE
Servicenow Inc
Computer Sftwr-Enterprse
|
$260.12
|
-14.78
-5.38% |
$271.16
|
2,770,624
151.32% of 50 DAV
50 DAV is 1,831,000
|
$275.20
-5.48%
|
4/22/2019
|
$242.64
|
PP = $251.75
|
|
MB = $264.34
|
Most Recent Note - 5/9/2019 3:50:58 PM
G - Quietly rising near its all-time high with today's gain. Bullish action was noted after it reported earnings +20% on +34% sales revenues for the Mar '19 quarter, below the +25% minimum earnings guideline (C criteria), raising concerns, fundamentally. Prior high ($251.65 on 3/21/19) and its 50 DMA line ($247) define near-term support to watch.
>>> FEATURED STOCK ARTICLE : Found Recent Support at 50-Day Moving Average - 4/15/2019 |
View all notes |
Set NEW NOTE alert |
Company Profile |
SEC
News |
Chart |
Request a new note
C
A
S
I |
PANW
-
NYSE
Palo Alto Networks
Computer Sftwr-Security
|
$224.50
|
-10.45
-4.45% |
$230.60
|
1,138,079
102.71% of 50 DAV
50 DAV is 1,108,000
|
$260.63
-13.86%
|
2/25/2019
|
$233.54
|
PP = $239.60
|
|
MB = $251.58
|
Most Recent Note - 5/13/2019 5:32:58 PM
Weakness today violated prior lows in the $230-231 area raising greater concerns. It will be dropped from the Featured Stocks list tonight. A prompt rebound above the 50 DMA line ($241) is needed for its outlook to improve. Fundamentals remain strong.
>>> FEATURED STOCK ARTICLE : Consolidating Above Prior High and 50-Day Average - 4/3/2019 |
View all notes |
Set NEW NOTE alert |
Company Profile |
SEC
News |
Chart |
Request a new note
C
A
S
I |
QLYS
-
NASDAQ
Qualys Inc
Computer Sftwr-Security
|
$84.20
|
-3.29
-3.76% |
$88.27
|
278,589
60.56% of 50 DAV
50 DAV is 460,000
|
$98.70
-14.69%
|
5/2/2019
|
$91.25
|
PP = $98.40
|
|
MB = $103.32
|
Most Recent Note - 5/13/2019 5:35:46 PM
Sank below its 50 DMA line ($84.51) today and closed near the intra-day low. Encountered distributional pressure in the past week after challenging previously stubborn resistance in the $97-98 area. Its Relative Strength Rating has slumped to 61, below the 80+ minimum guideline for buy candidates. It will be dropped from the Featured Stocks list tonight. Improvement and subsequent volume-driven gains above the pivot point are needed to trigger a technical buy signal. Reported earnings +36% on +16% sales revenues for the Mar '19 quarter, continuing its strong earnings history.
>>> FEATURED STOCK ARTICLE : Rallying to Challenge Previously Stubborn Resistance - 5/2/2019 |
View all notes |
Set NEW NOTE alert |
Company Profile |
SEC
News |
Chart |
Request a new note
C
A
S
I |
PAYC
-
NYSE
Paycom Software Inc
COMPUTER SOFTWARE and SERVICES - Application Software
|
$197.25
|
-11.14
-5.35% |
$204.50
|
943,121
150.90% of 50 DAV
50 DAV is 625,000
|
$210.55
-6.32%
|
2/6/2019
|
$171.66
|
PP = $164.18
|
|
MB = $172.39
|
Most Recent Note - 5/9/2019 3:54:05 PM
G - Hitting another new all-time high with today's gain backed by above average volume. It is extended from any sound base. Reported earnings +25% on +30% sales revenues for the Mar '19 quarter. Its 50 DMA line ($188.76) defines important near-term support to watch.
>>> FEATURED STOCK ARTICLE : Paycom Software Quietly Hovering Near All-Time High - 4/16/2019 |
View all notes |
Set NEW NOTE alert |
Company Profile |
SEC
News |
Chart |
Request a new note
C
A
S
I |
Symbol/Exchange
Company Name
Industry Group |
PRICE |
CHANGE
(%Change) |
Day High |
Volume
(% DAV)
(% 50 day avg vol) |
52 Wk Hi
% From Hi |
Featured
Date |
Price
Featured |
Pivot Featured |
|
Max Buy |
PYPL
-
NASDAQ
Paypal Holdings Inc
Finance-CrdtCard/PmtPr
|
$106.83
|
-3.58
-3.24% |
$108.63
|
5,638,266
88.36% of 50 DAV
50 DAV is 6,381,000
|
$113.69
-6.03%
|
1/24/2019
|
$92.56
|
PP = $93.80
|
|
MB = $98.49
|
Most Recent Note - 5/8/2019 1:34:46 PM
G - Hovering near its all-time high, extended from any sound base. Still well above its 50 DMA line ($104.36) which defines support to watch. Recently reported earnings +37% on +12% sales revenues for the Mar '19 quarter, continuing its strong earnings track record.
>>> FEATURED STOCK ARTICLE : Extended From Base After Gains in Recent Weeks Lacking Volume - 4/2/2019 |
View all notes |
Set NEW NOTE alert |
Company Profile |
SEC
News |
Chart |
Request a new note
C
A
S
I |
ALRM
-
NASDAQ
Alarm.com Holdings Inc
Security/Sfty
|
$58.92
|
-5.03
-7.86% |
$62.00
|
835,460
184.84% of 50 DAV
50 DAV is 452,000
|
$71.50
-17.59%
|
1/22/2019
|
$60.52
|
PP = $60.30
|
|
MB = $63.32
|
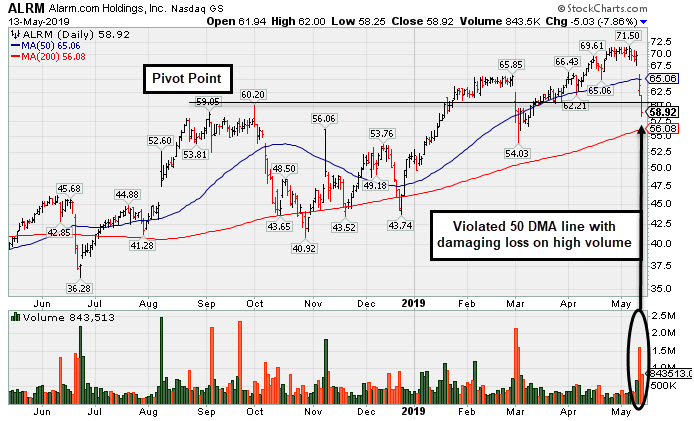
Most Recent Note - 5/13/2019 5:23:30 PM
Gapped down today slumping further below its 50 DMA line ($65) with a 2nd consecutive damaging volume-driven loss. Weak action came after it reported earnings +0% on +21% sales revenues for the Mar '19 quarter, marking its 2nd consecutive quarterly comparison below the +25% minimum earnings guideline (C criteria). It will be dropped from the Featured Stocks list tonight.
>>> FEATURED STOCK ARTICLE : Technical and Fundamental Concerns Both Sound Alarms - 5/13/2019 |
View all notes |
Set NEW NOTE alert |
Company Profile |
SEC
News |
Chart |
Request a new note
C
A
S
I |
PLNT
-
NYSE
Planet Fitness Inc Cl A
Leisure-Services
|
$75.58
|
-3.02
-3.84% |
$77.50
|
1,363,619
92.14% of 50 DAV
50 DAV is 1,480,000
|
$78.99
-4.32%
|
11/7/2018
|
$57.10
|
PP = $55.45
|
|
MB = $58.22
|
Most Recent Note - 5/8/2019 6:28:34 PM
G - Posted a third consecutive gain with near average volume for a new best-ever close. It remains very extended from any sound base. Found prompt support at its 50 DMA line ($69.59) when a big volume-driven loss came after reporting earnings +30% on +23% sales revenues for its first quarter ended March 31, 2019.
>>> FEATURED STOCK ARTICLE : Perched Near High Very Extended From Prior Base - 4/5/2019 |
View all notes |
Set NEW NOTE alert |
Company Profile |
SEC
News |
Chart |
Request a new note
C
A
S
I |
TEAM
-
NASDAQ
Atlassian Corp Plc Cl A
Comp Sftwr-Spec Enterprs
|
$120.78
|
-8.09
-6.28% |
$126.78
|
2,719,225
145.65% of 50 DAV
50 DAV is 1,867,000
|
$129.97
-7.07%
|
4/16/2019
|
$114.77
|
PP = $116.80
|
|
MB = $122.64
|
Most Recent Note - 5/13/2019 5:46:08 PM
Y - Today's big loss broke a streak of 7 consecutive gains into new all-time high territory and its color code is changed to yellow after closing below its "max buy" level. Reported earnings +133% on +38% sales revenues for the Mar '19 quarter, continuing its strong earnings track record.
>>> FEATURED STOCK ARTICLE : Perched Near High Enduring Distributional Pressure - 4/9/2019 |
View all notes |
Set NEW NOTE alert |
Company Profile |
SEC
News |
Chart |
Request a new note
C
A
S
I |
GLOB
-
NYSE
Globant SA
Computer-Tech Services
|
$79.61
|
-5.88
-6.88% |
$84.94
|
294,333
140.83% of 50 DAV
50 DAV is 209,000
|
$85.70
-7.11%
|
2/15/2019
|
$69.35
|
PP = $70.00
|
|
MB = $73.50
|
Most Recent Note - 5/13/2019 5:43:44 PM
G - Reported earnings +32% on +22% sales revenues for the quarter ended March 31st, 2019 versus the year ago period, continuing its strong earning track record. Extended from any sound base, it pulled back abruptly today and erased the prior session's gain. Its 50 DMA line ($76.10) defines important support above the prior high ($74). Violations would raise concerns and trigger technical sell signals.
>>> FEATURED STOCK ARTICLE : Earnings News Due While Perched Near All-Time High - 5/7/2019 |
View all notes |
Set NEW NOTE alert |
Company Profile |
SEC
News |
Chart |
Request a new note
C
A
S
I |
Symbol/Exchange
Company Name
Industry Group |
PRICE |
CHANGE
(%Change) |
Day High |
Volume
(% DAV)
(% 50 day avg vol) |
52 Wk Hi
% From Hi |
Featured
Date |
Price
Featured |
Pivot Featured |
|
Max Buy |
TTD
-
NASDAQ
The Trade Desk Inc Cl A
Comml Svcs-Advertising
|
$176.76
|
-6.75
-3.68% |
$181.52
|
2,069,447
131.64% of 50 DAV
50 DAV is 1,572,000
|
$232.70
-24.04%
|
4/22/2019
|
$211.03
|
PP = $214.80
|
|
MB = $225.54
|
Most Recent Note - 5/13/2019 5:19:19 PM
Suffered another loss today, failing to rebound after triggering a technical sell signal with damaging volume-driven losses last week. It will be dropped from the Featured Stocks list tonight. A rebound above the 50 DMA line ($203.50) is needed for its outlook to improve. Reported earnings +44% on +41% sales revenues for the Mar '19 quarter, continuing its strong earnings track record.
>>> FEATURED STOCK ARTICLE : Pulled Back Below "Max Buy" Level After Wedging Higher - 4/30/2019 |
View all notes |
Set NEW NOTE alert |
Company Profile |
SEC
News |
Chart |
Request a new note
C
A
S
I |