You are not logged in.
This means you
CAN ONLY VIEW reports that were published prior to Tuesday, May 28, 2024.
You
MUST UPGRADE YOUR MEMBERSHIP if you want to see any current reports.
AFTER MARKET UPDATE - THURSDAY, MAY 5TH, 2022
Previous After Market Report Next After Market Report >>>
|
|
|
|
DOW |
-1,063.09 |
32,997.97 |
-3.12% |
|
Volume |
1,079,722,805 |
-1% |
|
Volume |
5,264,824,400 |
-3% |
|
NASDAQ |
-647.16 |
12,317.69 |
-4.99% |
|
Advancers |
348 |
11% |
|
Advancers |
832 |
21% |
|
S&P 500 |
-153.30 |
4,146.87 |
-3.56% |
|
Decliners |
2,743 |
89% |
|
Decliners |
3,085 |
79% |
|
Russell 2000 |
-78.78 |
1,871.15 |
-4.04% |
|
52 Wk Highs |
53 |
|
|
52 Wk Highs |
22 |
|
|
S&P 600 |
-45.45 |
1,221.76 |
-3.59% |
|
52 Wk Lows |
379 |
|
|
52 Wk Lows |
653 |
|
|
The market remains in a correction (M criteria). Reducing market exposure and raising cash is prudent until a new confirmed rally is noted.
|
 |
Breadth Clearly Negative as Major Averages Abruptly Slump
Kenneth J. Gruneisen - Passed the CAN SLIM® Master's Exam
The Nasdaq Composite plunged 5.0% to cap its biggest one-day drawdown in nearly two years as growth-related shares led the downturn. The Dow tumbled 1063 points, suffering its worst day since October 2020. The S&P 500 retreated 3.6%, with all 11 sectors falling more than 1%. Volume totals reported were lighter than the prior session on the NYSE and on the Nasdaq exchange. Decliners led advancers by almost an 8-1 margin on the NYSE and by more than a 3-1 margin on the Nasdaq exchange. There were 18 high-ranked companies from the Leaders List that hit new 52-week highs and were listed on the BreakOuts Page, versus 20 on the prior session. New 52-week lows totals still solidly outnumbered new 52-week highs on both the NYSE and the Nasdaq exchange. The major indices are still in a market correction (M criteria).
Chart courtesy of www.stockcharts.com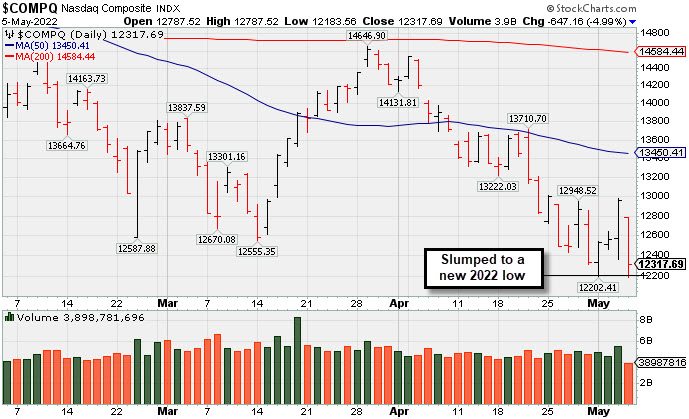 PICTURED: The Nasdaq Composite Index slumped to a new 2022 low. Followers of the fact-based investment system know to watch for a follow-through day on Day 4-7 of a new rally attempt which could signal a new confirmed uptrend.
U.S. stocks staged a sharp reversal on Thursday, negating yesterday’s post-Federal Reserve (Fed) relief rally. Risk sentiment waned as investors deliberated a confluence of economic risks in the midst of the most aggressive Fed tightening cycle in 22 years. On Wednesday, the U.S. central bank announced the first 50-basis point (0.50%) rate hike since 2000 and signaled further increases of similar magnitude in the coming months as officials prioritize lowering inflation.
The Consumer Discretionary sector lagged with a 5.8% drawdown as soft forward guidance from both Etsy Inc. and eBay Inc. pressured other ecommerce companies. Treasuries resumed their rout, with the 10-year note yield climbing six basis points (0.06%) to 3.03%, a peak not seen since November 2018.
Economic updates also dented the mood. A gauge of U.S. productivity dropped by the biggest margin since 1947 (-7.5%) during the first quarter as economic activity contracted. Meanwhile, 30-year fixed mortgage rates spiked to the highest level since August 2009 (+5.27%). Overseas, an update showed China’s services activity shrank in April at the fastest pace in more than two years. Elsewhere, the Bank of England announced its fourth consecutive rate hike. The British pound tumbled 2.1% versus the U.S. dollar, sending the greenback up 0.9% against a basket of its peers.
|
 Kenneth J. Gruneisen started out as a licensed stockbroker in August 1987, a couple of months prior to the historic stock market crash that took the Dow Jones Industrial Average down -22.6% in a single day. He has published daily fact-based fundamental and technical analysis on high-ranked stocks online for two decades. Through FACTBASEDINVESTING.COM, Kenneth provides educational articles, news, market commentary, and other information regarding proven investment systems that work in good times and bad.
Comments contained in the body of this report are technical opinions only and are not necessarily those of Gruneisen Growth Corp. The material herein has been obtained from sources believed to be reliable and accurate, however, its accuracy and completeness cannot be guaranteed. Our firm, employees, and customers may effect transactions, including transactions contrary to any recommendation herein, or have positions in the securities mentioned herein or options with respect thereto. Any recommendation contained in this report may not be suitable for all investors and it is not to be deemed an offer or solicitation on our part with respect to the purchase or sale of any securities. |
|
 |
Retail, Tech, Financial, and Commodity-Linked Groups Fell
Kenneth J. Gruneisen - Passed the CAN SLIM® Master's Exam
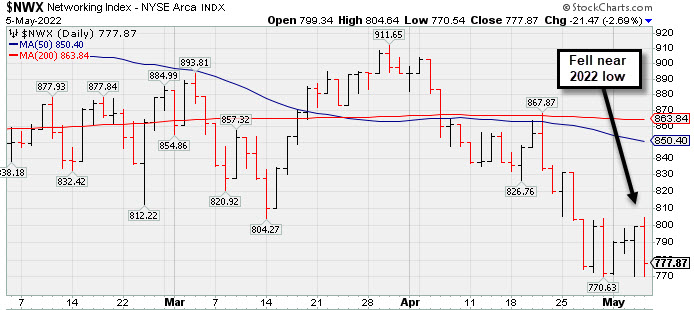
The Retail Index ($RLX -6.14%) was a standout decliner. The Broker/Dealer Index ($XBD -2.82%) and Bank Index ($BKX -2.74%) both lost ground. The Semiconductor Index ($SOX -5.00%) led the tech sector lower, followed by the Biotech Index ($BTK -3.69%) and the Networking Index ($NWX -2.69%). The Gold & Silver Index ($XAU -3.77%), Oil Services Index ($OSX -3.17%), and Integrated Oil Index ($XOI -1.50%) rounded out the widely negative session with unanimous losses.
PICTURED: The Networking Index ($NWX -2.69%) fell near its 2022 low.
| Oil Services |
$OSX |
77.62 |
-2.54 |
-3.17% |
+47.23% |
| Integrated Oil |
$XOI |
1,660.68 |
-25.37 |
-1.50% |
+40.95% |
| Semiconductor |
$SOX |
3,005.53 |
-158.26 |
-5.00% |
-23.84% |
| Networking |
$NWX |
777.87 |
-21.47 |
-2.69% |
-19.90% |
| Broker/Dealer |
$XBD |
416.05 |
-12.06 |
-2.82% |
-14.54% |
| Retail |
$RLX |
3,163.14 |
-207.09 |
-6.14% |
-25.16% |
| Gold & Silver |
$XAU |
140.48 |
-5.51 |
-3.77% |
+6.06% |
| Bank |
$BKX |
113.70 |
-3.20 |
-2.74% |
-14.00% |
| Biotech |
$BTK |
4,665.55 |
-178.66 |
-3.69% |
-15.46% |
|
|
|
 |
Slump Below 50-Day Moving Average
Kenneth J. Gruneisen - Passed the CAN SLIM® Master's Exam
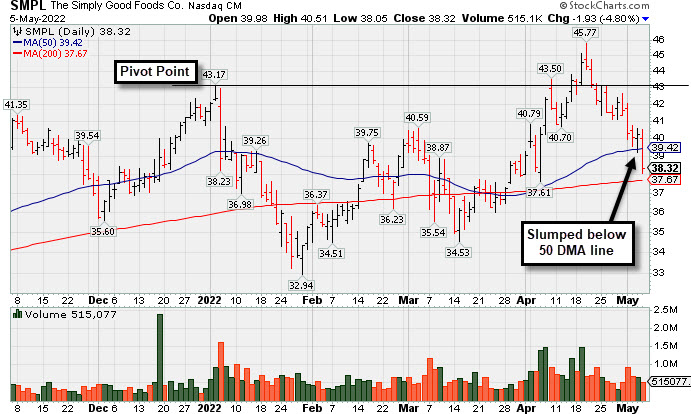
Simply Good Foods Co (SMPL -$1.93 or -4.80% to $38.32) suffered a big loss today with lighter volume while violating its 50-day moving average (DMA) line ($39.42) raising concerns and triggering a technical sell signal. Only a prompt rebound above the 50 DMA line would help its outlook improve.
SMPL was highlighted in yellow with new pivot point cited based on its 1/04/22 high plus 10 cents in the 4/13/22 mid-day report (read here). It was last shown in this FSU section on 4/14/22 with an annotated graph included under the headline, "Simply Good Foods Had a Great Breakout". Following the breakout it soon stalled and slumped back into the prior base raising concerns.
SMPL reported Feb '22 quarterly earnings +44% on +29% sales revenues versus the year ago period, its 4th strong quarterly comparison well above the +25% minimum earnings guideline (C criteria). In 7 of the past 8 quarterly comparisons earnings were above the +25% minimum guideline (C criteria). Its annual earnings history (A criteria) has been strong. It currently has a 97 Earnings Per Share Rating.
Its current Relative Strength Rating is 87, above the 80+ minimum guideline for buy candidates. SMPL completed a new Pubic Offering on 10/09/19. The company has a Timeliness Rating of A and Sponsorship Rating of D. The number of top-rated funds owning its shares rose from 357 in Dec '20 to 447 in Mar '22. Its current Up/Down Volume Ratio of 0.8 is an unbiased indication its shares have been under distributional pressure over the past 50 days.
Leadership has been provided by other companies in the Food/Beverage Sector, as the Food-Confectionery industry group has a Group Relative Strength Rating of 89 (A) is reassuring regarding the L criteria. There are only 5 companies listed in the group.
|
|
|
Color Codes Explained :
Y - Better candidates highlighted by our
staff of experts.
G - Previously featured
in past reports as yellow but may no longer be buyable under the
guidelines.
***Last / Change / Volume data in this table is the closing quote data***
Symbol/Exchange
Company Name
Industry Group |
PRICE |
CHANGE
(%Change) |
Day High |
Volume
(% DAV)
(% 50 day avg vol) |
52 Wk Hi
% From Hi |
Featured
Date |
Price
Featured |
Pivot Featured |
|
Max Buy |
 REGN
-
NASDAQ
REGN
-
NASDAQ
Regeneron Pharmaceutical
DRUGS - Biotechnology
|
$639.37
|
-21.49
-3.25% |
$660.87
|
754,104
116.92% of 50 DAV
50 DAV is 645,000
|
$747.42
-14.46%
|
3/14/2022
|
$647.95
|
PP = $673.96
|
|
MB = $707.66
|
 Most Recent Note - 5/5/2022 5:44:33 PM
Tested its 200 DMA line with today's loss. It will be dropped from the Featured Stocks list tonight. Reported Mar '22 quarterly earnings +16% on +17% sales revenues versus the year ago period, below the +25% minimum earnings guideline (C criteria) raising fundamental concerns. Noted losses below the 50 DMA line recently triggered a technical sell signal. Only a prompt rebound above the 50 DMA line ($674) would help its outlook improve.
>>> FEATURED STOCK ARTICLE : Testing Support at 50-Day Moving Average Line - 4/28/2022 |
View all notes |
Set NEW NOTE alert |
Company Profile |
SEC
News |
Chart |
Request a new note
C
A
S
I |
IMKTA
-
NASDAQ
Ingles Markets Inc Cl A
RETAIL - Grocery Stores
|
$92.98
|
-4.20
-4.32% |
$97.74
|
173,722
148.48% of 50 DAV
50 DAV is 117,000
|
$101.98
-8.83%
|
4/11/2022
|
$96.25
|
PP = $95.75
|
|
MB = $100.54
|
Most Recent Note - 5/5/2022 5:39:31 PM
Y - Suffered a loss today with higher volume testing its 50 DMA line ($91.70). Reported Mar '22 quarterly earnings +40% on +16% sales revenues versus the year ago period. Volume and volatility often increase near earnings news. See the latest FSU analysis for more detailed analysis and an annotated graph.
>>> FEATURED STOCK ARTICLE : Ingles Markets Perched Near High With Earnings News Due - 5/4/2022 |
View all notes |
Set NEW NOTE alert |
Company Profile |
SEC
News |
Chart |
Request a new note
C
A
S
I |
WCC
-
NYSE
Wesco International Inc
WHOLESALE - Electronics Wholesale
|
$140.14
|
+7.58
5.72% |
$144.43
|
1,437,888
330.55% of 50 DAV
50 DAV is 435,000
|
$140.92
-0.55%
|
4/21/2022
|
$135.54
|
PP = $139.10
|
|
MB = $146.06
|
Most Recent Note - 5/5/2022 5:45:26 PM
Y - Gapped up today and hit a new all-time high, rising above prior highs in the $136 area that had acted as stubborn resistance in recent weeks. The gain and strong close above the pivot point helped clinch a convincing technical buy signal. New buying efforts may only be considered after a solid follow-through day confirms a new market uptrend (M criteria). Rebounded well above its 50 and 200 DMA lines with this week's gains. Bullish action came after it reported Mar '22 quarterly earnings +154% on +22% sales revenues versus the year ago period. Volume and volatility often increase near earnings news.
>>> FEATURED STOCK ARTICLE : Approaching Prior Highs Where it Met Resistance - 4/21/2022 |
View all notes |
Set NEW NOTE alert |
Company Profile |
SEC
News |
Chart |
Request a new note
C
A
S
I |
SMPL
-
NASDAQ
Simply Good Foods Co
Food-Confectionery
|
$38.32
|
-1.93
-4.80% |
$40.51
|
515,077
76.19% of 50 DAV
50 DAV is 676,000
|
$45.77
-16.28%
|
4/13/2022
|
$41.79
|
PP = $43.27
|
|
MB = $45.43
|
Most Recent Note - 5/5/2022 5:37:39 PM
Y - Today's big loss with lighter volume violated its 50 DMA line ($39.42) raising greater concerns and triggering a technical sell signal. Only a prompt rebound above the 50 DMA line would help its outlook improve. Fundamentals remain strong. See the latest FSU analysis for more details and a new annotated graph.
>>> FEATURED STOCK ARTICLE : Slump Below 50-Day Moving Average - 5/5/2022 |
View all notes |
Set NEW NOTE alert |
Company Profile |
SEC
News |
Chart |
Request a new note
C
A
S
I |
IMXI
-
NASDAQ
International Money Exp
Financial Svcs-Specialty
|
$20.87
|
-0.55
-2.57% |
$21.43
|
344,138
83.33% of 50 DAV
50 DAV is 413,000
|
$21.98
-5.05%
|
3/8/2022
|
$18.64
|
PP = $19.06
|
|
MB = $20.01
|
Most Recent Note - 5/5/2022 5:41:01 PM
G - Pulled back today with lighter volume. Spiked above its "max buy" level with a volume-driven gain on the prior session. Bullish action came after it reported Mar '22 quarterly earnings +26% on +21% sales revenues versus the year ago period. Volume and volatility often increase near earnings news. Recently consolidating near its 50 DMA line ($19.60) which defines important near term support to watch. More damaging losses would raise concerns and trigger a technical sell signal.
>>> FEATURED STOCK ARTICLE : Consolidating After Rally From Previously Noted Base - 4/18/2022 |
View all notes |
Set NEW NOTE alert |
Company Profile |
SEC
News |
Chart |
Request a new note
C
A
S
I |
Symbol/Exchange
Company Name
Industry Group |
PRICE |
CHANGE
(%Change) |
Day High |
Volume
(% DAV)
(% 50 day avg vol) |
52 Wk Hi
% From Hi |
Featured
Date |
Price
Featured |
Pivot Featured |
|
Max Buy |
|
|
|
THESE ARE NOT BUY RECOMMENDATIONS!
Comments contained in the body of this report are technical
opinions only. The material herein has been obtained
from sources believed to be reliable and accurate, however,
its accuracy and completeness cannot be guaranteed.
This site is not an investment advisor, hence it does
not endorse or recommend any securities or other investments.
Any recommendation contained in this report may not
be suitable for all investors and it is not to be deemed
an offer or solicitation on our part with respect to
the purchase or sale of any securities. All trademarks,
service marks and trade names appearing in this report
are the property of their respective owners, and are
likewise used for identification purposes only.
This report is a service available
only to active Paid Premium Members.
You may opt-out of receiving report notifications
at any time. Questions or comments may be submitted
by writing to Premium Membership Services 665 S.E. 10 Street, Suite 201 Deerfield Beach, FL 33441-5634 or by calling 1-800-965-8307
or 954-785-1121.
|
|
|