You are not logged in.
This means you
CAN ONLY VIEW reports that were published prior to Tuesday, April 8, 2025.
You
MUST UPGRADE YOUR MEMBERSHIP if you want to see any current reports.
AFTER MARKET UPDATE - FRIDAY, MAY 6TH, 2022
Previous After Market Report Next After Market Report >>>
|
|
|
|
DOW |
-98.60 |
32,899.37 |
-0.30% |
|
Volume |
1,075,579,303 |
-0% |
|
Volume |
5,325,527,800 |
+1% |
|
NASDAQ |
-173.03 |
12,144.66 |
-1.40% |
|
Advancers |
922 |
30% |
|
Advancers |
1,152 |
27% |
|
S&P 500 |
-23.53 |
4,123.34 |
-0.57% |
|
Decliners |
2,116 |
70% |
|
Decliners |
3,073 |
73% |
|
Russell 2000 |
-31.58 |
1,839.56 |
-1.69% |
|
52 Wk Highs |
28 |
|
|
52 Wk Highs |
24 |
|
|
S&P 600 |
-13.01 |
1,208.75 |
-1.06% |
|
52 Wk Lows |
616 |
|
|
52 Wk Lows |
1,113 |
|
|
The market remains in a correction (M criteria). Reducing market exposure and raising cash is prudent until a new confirmed rally is noted.
|
 |
Major Indices Suffer More Damaging Losses
Kenneth J. Gruneisen - Passed the CAN SLIM® Master's Exam
The Dow lost 98 points after weathering its worst day since October 2020 on Thursday. The blue-chip stock index slipped 0.2% for the week, notching its first six week losing streak since May 2019. The S&P 500 slid 0.6% to cap a 0.2% decline for the week, with the index falling to a fresh 2022 low. The Nasdaq Composite shed 1.4%, extending its five-day loss to 1.5%. Both benchmarks retreated for a fifth straight week, which was the S&P 500’s longest such losing streak since June 2011. Volume totals reported were near the prior session on the NYSE and slightly higher on the Nasdaq exchange. Decliners led advancers by more than a 2-1 margin on the NYSE and by nearly 3-1 on the Nasdaq exchange. There were 12 high-ranked companies from the Leaders List that hit new 52-week highs and were listed on the BreakOuts Page, versus 18 on the prior session. New 52-week lows totals expanded and solidly outnumbered new 52-week highs on both the NYSE and the Nasdaq exchange. The major indices are still in a market correction (M criteria).
Chart courtesy of www.stockcharts.com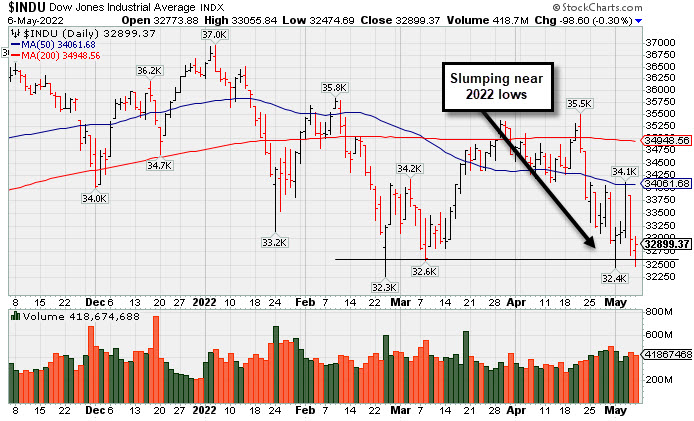 PICTURED: The Dow Jones Industrial Average slumped near its 2022 low. Followers of the fact-based investment system know to watch for a follow-through day on Day 4-7 of a new rally attempt which could signal a new confirmed uptrend.
U.S. stocks pushed lower on Friday during another volatile session as investors assessed the implications of the monthly jobs report. Treasuries weakened following hawkish commentary from Federal Reserve (Fed) officials. Richmond Fed President Thomas Barkin failed to rule out a larger 0.75% rate hike, explaining that all options should remain on the table. The yield on the 10-year note jumped 0.10% to 3.13%, its highest level since November 2018.
On the data front, the U.S. economy added a better-than-expected 428,000 nonfarm payrolls in April, reflecting a strong labor market as it was the 12th consecutive monthly gain of more than 400,000. The unemployment rate held steady at 3.6%, while wage inflation climbed 0.3% in April, easing from the prior 0.5% uptick. However, labor participation unexpectedly slipped to 62.2%, still 1.2% below its pre-pandemic level.
Nine of 11 S&P 500 sectors finished in negative territory. Energy bucked the downtrend as West Texas Intermediate crude settled above $110/barrel for the first time since March. In earnings, Under Armour Inc. (UA -25.88%) fell after posting an unexpected loss for the quarter.
|
 Kenneth J. Gruneisen started out as a licensed stockbroker in August 1987, a couple of months prior to the historic stock market crash that took the Dow Jones Industrial Average down -22.6% in a single day. He has published daily fact-based fundamental and technical analysis on high-ranked stocks online for two decades. Through FACTBASEDINVESTING.COM, Kenneth provides educational articles, news, market commentary, and other information regarding proven investment systems that work in good times and bad.
Comments contained in the body of this report are technical opinions only and are not necessarily those of Gruneisen Growth Corp. The material herein has been obtained from sources believed to be reliable and accurate, however, its accuracy and completeness cannot be guaranteed. Our firm, employees, and customers may effect transactions, including transactions contrary to any recommendation herein, or have positions in the securities mentioned herein or options with respect thereto. Any recommendation contained in this report may not be suitable for all investors and it is not to be deemed an offer or solicitation on our part with respect to the purchase or sale of any securities. |
|
 |
Retail, Financial, Gold & Silver, ,and Tech Indexes Fell
Kenneth J. Gruneisen - Passed the CAN SLIM® Master's Exam
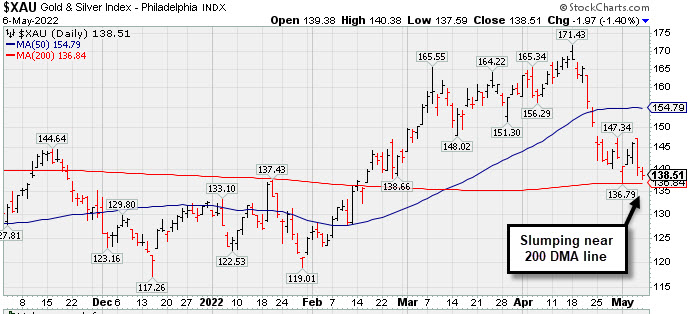
The Broker/Dealer Index ($XBD -2.60%), Bank Index ($BKX -1.06%), and Retail Index ($RLX -1.30%) each lost ground. The Gold & Silver Index ($XAU -1.40%) lost ground while the Oil Services Index ($OSX +0.38%) inched higher and the Integrated Oil Index ($XOI +3.07%) posted a solid gain The tech sector had a negative bias as the Semiconductor Index ($SOX -0.78%), Biotech Index ($BTK -2.84%), and Networking Index ($NWX -1.91%) each lost ground. .
PICTURED: The Gold & Silver Index ($XAU -1.40%) fell near its 200-day moving average line.
| Oil Services |
$OSX |
77.91 |
+0.29 |
+0.38% |
+47.78% |
| Integrated Oil |
$XOI |
1,711.63 |
+50.95 |
+3.07% |
+45.27% |
| Semiconductor |
$SOX |
2,982.06 |
-23.46 |
-0.78% |
-24.43% |
| Networking |
$NWX |
762.99 |
-14.88 |
-1.91% |
-21.43% |
| Broker/Dealer |
$XBD |
405.23 |
-10.82 |
-2.60% |
-16.77% |
| Retail |
$RLX |
3,122.12 |
-41.02 |
-1.30% |
-26.13% |
| Gold & Silver |
$XAU |
138.51 |
-1.97 |
-1.40% |
+4.58% |
| Bank |
$BKX |
112.50 |
-1.20 |
-1.06% |
-14.91% |
| Biotech |
$BTK |
4,533.15 |
-132.41 |
-2.84% |
-17.85% |
|
|
|
 |
Cigna Rises Near All-Time High
Kenneth J. Gruneisen - Passed the CAN SLIM® Master's Exam
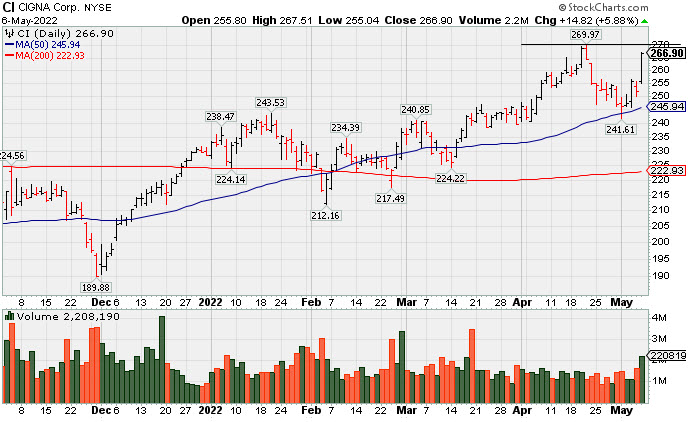
Cigna Corp (CI +$14.82 or +5.88% to $266.90) finished strong after highlighted in yellow in the mid-day report with a pivot point cited based on its 4/21/22 high. It ended perched within close striking distance of its 52-week and all-time highs with today's big gain. Subsequent gains above the pivot point backed by at least +40% above average volume may trigger a technical buy signal.
CI has a 95 Earnings Per Share Rating. It reported a strong +27% earnings increase on +7% sales revenues for the Mar '22 quarter versus the year ago period, its 3rd strong quarterly comparison above the +25% minimum guideline (C criteria). Annual earnings growth (A criteria) has been strong.
The number of top-rated funds owning its shares rose from 2,628 in Dec '21 to 2,650 in Mar '22, a reassuring sign concerning the I criteria. The Medical - Managed Care group is currently ranked 36th on the 197 Industry Groups list and has a Group Relative Strength Rating of A (L criteria). |
|
|
Color Codes Explained :
Y - Better candidates highlighted by our
staff of experts.
G - Previously featured
in past reports as yellow but may no longer be buyable under the
guidelines.
***Last / Change / Volume data in this table is the closing quote data***
Symbol/Exchange
Company Name
Industry Group |
PRICE |
CHANGE
(%Change) |
Day High |
Volume
(% DAV)
(% 50 day avg vol) |
52 Wk Hi
% From Hi |
Featured
Date |
Price
Featured |
Pivot Featured |
|
Max Buy |
 CI
-
NYSE
CI
-
NYSE
Cigna Corp
Medical-Managed Care
|
$266.90
|
+14.82
5.88% |
$267.51
|
2,208,190
142.01% of 50 DAV
50 DAV is 1,555,000
|
$272.81
-2.17%
|
5/6/2022
|
$263.52
|
PP = $269.97
|
|
MB = $283.47
|
 Most Recent Note - 5/6/2022 9:52:44 PM
Y - Finished strong today after highlighted in yellow with pivot point cited based on its 4/21/22 high. Perched within close striking distance of its 52-week and all-time highs. Subsequent gains above the pivot point backed by at least +40% above average volume may trigger a technical buy signal. Reported a strong +27% earnings increase on +7% sales revenues for the Mar '22 quarter versus the year ago period, its 3rd strong quarterly comparison above the +25% minimum guideline (C criteria). Annual earnings growth (A criteria) has been strong. See the latest FSU analysis for more details and a new annotated graph.
>>> FEATURED STOCK ARTICLE : Cigna Rises Near All-Time High - 5/6/2022 |
View all notes |
Set NEW NOTE alert |
Company Profile |
SEC
News |
Chart |
Request a new note
C
A
S
I |
IMKTA
-
NASDAQ
Ingles Markets Inc Cl A
RETAIL - Grocery Stores
|
$94.13
|
+1.15
1.24% |
$96.00
|
87,325
73.38% of 50 DAV
50 DAV is 119,000
|
$101.98
-7.70%
|
4/11/2022
|
$96.25
|
PP = $95.75
|
|
MB = $100.54
|
Most Recent Note - 5/5/2022 5:39:31 PM
Y - Suffered a loss today with higher volume testing its 50 DMA line ($91.70). Reported Mar '22 quarterly earnings +40% on +16% sales revenues versus the year ago period. Volume and volatility often increase near earnings news. See the latest FSU analysis for more detailed analysis and an annotated graph.
>>> FEATURED STOCK ARTICLE : Ingles Markets Perched Near High With Earnings News Due - 5/4/2022 |
View all notes |
Set NEW NOTE alert |
Company Profile |
SEC
News |
Chart |
Request a new note
C
A
S
I |
WCC
-
NYSE
Wesco International Inc
WHOLESALE - Electronics Wholesale
|
$140.25
|
+0.11
0.08% |
$143.07
|
728,801
161.24% of 50 DAV
50 DAV is 452,000
|
$140.92
-0.48%
|
4/21/2022
|
$135.54
|
PP = $139.10
|
|
MB = $146.06
|
Most Recent Note - 5/5/2022 5:45:26 PM
Y - Gapped up today and hit a new all-time high, rising above prior highs in the $136 area that had acted as stubborn resistance in recent weeks. The gain and strong close above the pivot point helped clinch a convincing technical buy signal. New buying efforts may only be considered after a solid follow-through day confirms a new market uptrend (M criteria). Rebounded well above its 50 and 200 DMA lines with this week's gains. Bullish action came after it reported Mar '22 quarterly earnings +154% on +22% sales revenues versus the year ago period. Volume and volatility often increase near earnings news.
>>> FEATURED STOCK ARTICLE : Approaching Prior Highs Where it Met Resistance - 4/21/2022 |
View all notes |
Set NEW NOTE alert |
Company Profile |
SEC
News |
Chart |
Request a new note
C
A
S
I |
SMPL
-
NASDAQ
Simply Good Foods Co
Food-Confectionery
|
$38.32
|
+0.00
0.00% |
$39.34
|
954,329
140.34% of 50 DAV
50 DAV is 680,000
|
$45.77
-16.28%
|
4/13/2022
|
$41.79
|
PP = $43.27
|
|
MB = $45.43
|
Most Recent Note - 5/5/2022 5:37:39 PM
Y - Today's big loss with lighter volume violated its 50 DMA line ($39.42) raising greater concerns and triggering a technical sell signal. Only a prompt rebound above the 50 DMA line would help its outlook improve. Fundamentals remain strong. See the latest FSU analysis for more details and a new annotated graph.
>>> FEATURED STOCK ARTICLE : Slump Below 50-Day Moving Average - 5/5/2022 |
View all notes |
Set NEW NOTE alert |
Company Profile |
SEC
News |
Chart |
Request a new note
C
A
S
I |
IMXI
-
NASDAQ
International Money Exp
Financial Svcs-Specialty
|
$20.30
|
-0.57
-2.73% |
$20.80
|
279,864
67.11% of 50 DAV
50 DAV is 417,000
|
$22.86
-11.20%
|
3/8/2022
|
$18.64
|
PP = $19.06
|
|
MB = $20.01
|
Most Recent Note - 5/6/2022 9:54:09 PM
G - Pulled back today for a 2nd consecutive loss with lighter volume. Spiked above its "max buy" level with a volume-driven gain after it reported Mar '22 quarterly earnings +26% on +21% sales revenues versus the year ago period. Volume and volatility often increase near earnings news. Recently consolidating near its 50 DMA line ($19.68) which defines important near term support to watch. More damaging losses would raise concerns and trigger a technical sell signal.
>>> FEATURED STOCK ARTICLE : Consolidating After Rally From Previously Noted Base - 4/18/2022 |
View all notes |
Set NEW NOTE alert |
Company Profile |
SEC
News |
Chart |
Request a new note
C
A
S
I |
Symbol/Exchange
Company Name
Industry Group |
PRICE |
CHANGE
(%Change) |
Day High |
Volume
(% DAV)
(% 50 day avg vol) |
52 Wk Hi
% From Hi |
Featured
Date |
Price
Featured |
Pivot Featured |
|
Max Buy |
|
|
|
THESE ARE NOT BUY RECOMMENDATIONS!
Comments contained in the body of this report are technical
opinions only. The material herein has been obtained
from sources believed to be reliable and accurate, however,
its accuracy and completeness cannot be guaranteed.
This site is not an investment advisor, hence it does
not endorse or recommend any securities or other investments.
Any recommendation contained in this report may not
be suitable for all investors and it is not to be deemed
an offer or solicitation on our part with respect to
the purchase or sale of any securities. All trademarks,
service marks and trade names appearing in this report
are the property of their respective owners, and are
likewise used for identification purposes only.
This report is a service available
only to active Paid Premium Members.
You may opt-out of receiving report notifications
at any time. Questions or comments may be submitted
by writing to Premium Membership Services 665 S.E. 10 Street, Suite 201 Deerfield Beach, FL 33441-5634 or by calling 1-800-965-8307
or 954-785-1121.
|
|
|