You are not logged in.
This means you
CAN ONLY VIEW reports that were published prior to Sunday, April 6, 2025.
You
MUST UPGRADE YOUR MEMBERSHIP if you want to see any current reports.
AFTER MARKET UPDATE - THURSDAY, APRIL 28TH, 2022
Previous After Market Report Next After Market Report >>>
|
|
|
|
DOW |
+614.46 |
33,916.39 |
+1.85% |
|
Volume |
1,008,452,633 |
+2% |
|
Volume |
4,980,217,100 |
+6% |
|
NASDAQ |
+382.59 |
12,871.53 |
+3.06% |
|
Advancers |
2,430 |
77% |
|
Advancers |
2,686 |
60% |
|
S&P 500 |
+103.55 |
4,287.51 |
+2.47% |
|
Decliners |
734 |
23% |
|
Decliners |
1,761 |
40% |
|
Russell 2000 |
+33.91 |
1,917.94 |
+1.80% |
|
52 Wk Highs |
22 |
|
|
52 Wk Highs |
43 |
|
|
S&P 600 |
+24.95 |
1,246.89 |
+2.04% |
|
52 Wk Lows |
523 |
|
|
52 Wk Lows |
831 |
|
|
Damaging losses last week signaled a market correction (M criteria). Limiting losses and reducing market exposure is prudent until a new confirmed rally is noted.
|
 |
Major Indices Posted Solids Gains Backed With Higher Volume
Kenneth J. Gruneisen - Passed the CAN SLIM® Master's Exam
The S&P 500 rallied 2.5% for its best day since March 9, though still on course for its sharpest monthly drop since March 2020 (-5.3%). The Nasdaq Composite spiked 3.1%, but remains positioned for its worst month in over two years (-9.5%). The Dow jumped 614 points, paring its April decline to 2.2%. Volume totals reported were higher than the prior session on the NYSE and on the Nasdaq exchange, indicative of greater institutional buying demand. Breadth was positive as advancers led decliners by a 3-1 margin on the NYSE and by a 3-2 margin on the Nasdaq exchange. There were 2 high-ranked companies from the Leaders List that hit new 52-week highs and were listed on the BreakOuts Page, versus 2 on the prior session. New 52-week lows totals still solidly outnumbered new 52-week highs on both the NYSE and the Nasdaq exchange. The major indices are in a noted market correction (M criteria) after technical damage cited in prior market commentaries published here. Strict followers of the fact-based investment system know to use great caution and always be prepared to reduce exposure by selling any weakening stocks on a case-by-case basis.
Chart courtesy of www.stockcharts.com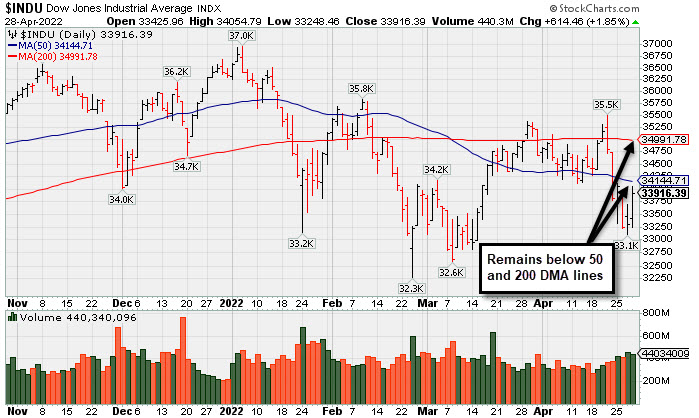 PICTURED: The Dow Jones Industrial Average has been sputtering near the 2022 low.
U.S. stocks finished near their best levels on Thursday as positive earnings from Facebook parent Meta Platforms Inc. (FB +17.59%) provided a catalyst for a month-end rally. Additionally, oversold conditions and depressed positioning continued to serve as contrarian signals supportive of stocks.
All 11 S&P 500 sectors climbed more than 1%, with Technology stocks pacing the gains amid strength in chipmakers. Qualcomm Inc. (QCOM +9.69%) rose following a top and bottom line beat and improved outlook. The Communication Services group outperformed after Meta Platforms Inc.'s better-than-expected user metrics. Still, the social media company reported slowing revenue growth and offered soft guidance. Meanwhile, Comcast Corp. (CMCSA -6.19%) fell amid concerns of slowing growth in internet subscribers.
Economic data was also in focus. An advance reading of first-quarter U.S. GDP showed the economy unexpectedly contracted at an annualized 1.4% pace following a growth rate of 6.9% during the fourth quarter of 2021. Weakness overseas offset a jump in imports related to strong domestic consumer demand. Separately, weekly initial jobless claims came in at 180,000. Treasuries fluctuated, with the yield on the benchmark 10-year note up one basis point (0.01%) to 2.83%, having risen 50 basis points (0.50%) in April.
|
 Kenneth J. Gruneisen started out as a licensed stockbroker in August 1987, a couple of months prior to the historic stock market crash that took the Dow Jones Industrial Average down -22.6% in a single day. He has published daily fact-based fundamental and technical analysis on high-ranked stocks online for two decades. Through FACTBASEDINVESTING.COM, Kenneth provides educational articles, news, market commentary, and other information regarding proven investment systems that work in good times and bad.
Comments contained in the body of this report are technical opinions only and are not necessarily those of Gruneisen Growth Corp. The material herein has been obtained from sources believed to be reliable and accurate, however, its accuracy and completeness cannot be guaranteed. Our firm, employees, and customers may effect transactions, including transactions contrary to any recommendation herein, or have positions in the securities mentioned herein or options with respect thereto. Any recommendation contained in this report may not be suitable for all investors and it is not to be deemed an offer or solicitation on our part with respect to the purchase or sale of any securities. |
|
 |
Retail, Financial, Tech, and Commodity-Linked Groups Rose
Kenneth J. Gruneisen - Passed the CAN SLIM® Master's Exam
The Retail Index ($RLX +3.14%) posted an influential gain as the Bank Index ($BKX +1.25%) and Broker/Dealer Index ($XBD +1.57%) also rose. The Semiconductor Index ($SOX +5.58%) led the tech sector's bounce while the Networking Index ($NWX +2.89%) also posted a solid gain. Commodity-linked groups had a positive bias as the Oil Services Index ($OSX +2.48%), Integrated Oil Index ($XOI +3.42%), and Gold & Silver Index ($XAU +2.04%) posted unanimous gains.
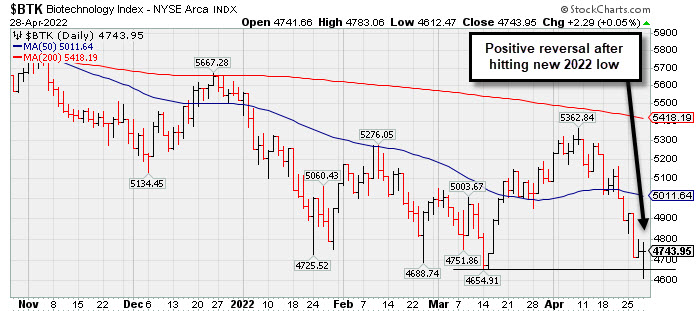
PICTURED: The Biotech Index ($BTK +0.05%) managed a "positive reversal" after slumping to a new 2022 low.
| Oil Services |
$OSX |
77.05 |
+1.87 |
+2.48% |
+46.15% |
| Integrated Oil |
$XOI |
1,581.72 |
+52.31 |
+3.42% |
+34.25% |
| Semiconductor |
$SOX |
3,056.36 |
+161.45 |
+5.58% |
-22.55% |
| Networking |
$NWX |
799.10 |
+22.43 |
+2.89% |
-17.71% |
| Broker/Dealer |
$XBD |
419.73 |
+6.50 |
+1.57% |
-13.79% |
| Retail |
$RLX |
3,605.69 |
+109.75 |
+3.14% |
-14.69% |
| Gold & Silver |
$XAU |
144.08 |
+2.88 |
+2.04% |
+8.78% |
| Bank |
$BKX |
113.80 |
+1.41 |
+1.25% |
-13.93% |
| Biotech |
$BTK |
4,743.95 |
+2.29 |
+0.05% |
-14.03% |
|
|
|
 |
Testing Support at 50-Day Moving Average Line
Kenneth J. Gruneisen - Passed the CAN SLIM® Master's Exam
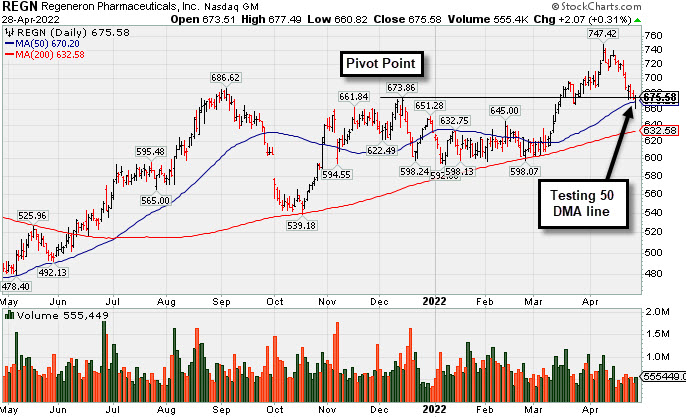
Regeneron Pharmaceuticals Inc (REGN +$2.07 or +0.31% to $675.58) showed some resilience today and managed a "positive reversal" after undercutting its 50-day moving average (DMA) line ($670). The recent deterioration below prior highs ($686 and $673) raised concerns. Keep in mind it is due to report earnings results for the quarter ended March 31, 2022 on Wednesday, May 4th. Volume and volatility often increase near earnings news.
REGN found support near its 200 DMA line ($632) during its consolidation in recent months. A new pivot point was cited based on its 12/14/21 high plus 10 cents. It hit a new high but then stalled since last covered in greater detail on 4/04/22 with an annotated graph under the headline, "Volume Totals Have Been Light While Hovering at All-Time High".
The high-ranked DRUGS - Biotechnology firm reported earnings +149% on +104% sales revenues for the Dec '21 quarter versus the year ago period. That marked its 6th quarterly comparison above the +25% minimum earnings guideline (C criteria) and with a strong sales revenues growth rate. Its annual earnings (A criteria) growth has been strong. It has a highest possible 99 Earnings Per Share Rating.
There are 2,775 top-rated funds that own its shares as of Mar '22, up from 2,376 in Dec '20, a reassuring sign concerning the I criteria. Its current Up/Down Volume Ratio of 1.6 is an unbiased indication its shares have been under accumulation over the past 50 days. REGN completed a Secondary Offering on 5/28/20. There are 97.1 million shares in the public float (S criteria) which can contribute to greater volatility in the event of institutional buying or selling.
|
|
|
Color Codes Explained :
Y - Better candidates highlighted by our
staff of experts.
G - Previously featured
in past reports as yellow but may no longer be buyable under the
guidelines.
***Last / Change / Volume data in this table is the closing quote data***
Symbol/Exchange
Company Name
Industry Group |
PRICE |
CHANGE
(%Change) |
Day High |
Volume
(% DAV)
(% 50 day avg vol) |
52 Wk Hi
% From Hi |
Featured
Date |
Price
Featured |
Pivot Featured |
|
Max Buy |
 REGN
-
NASDAQ
REGN
-
NASDAQ
Regeneron Pharmaceutical
DRUGS - Biotechnology
|
$675.58
|
+2.07
0.31% |
$677.50
|
555,003
87.26% of 50 DAV
50 DAV is 636,000
|
$747.42
-9.61%
|
3/14/2022
|
$647.95
|
PP = $673.96
|
|
MB = $707.66
|
 Most Recent Note - 4/28/2022 5:24:33 PM
Y - Showed resilience today and found prompt support after undercutting its 50 DMA line ($670). Recent losses undercut prior highs ($686 and $673) raising concerns. Due to report Mar '22 quarterly results on Wednesday, May 4th. See the latest FSU analysis for more details and a new annotated graph.
>>> FEATURED STOCK ARTICLE : Testing Support at 50-Day Moving Average Line - 4/28/2022 |
View all notes |
Set NEW NOTE alert |
Company Profile |
SEC
News |
Chart |
Request a new note
C
A
S
I |
IMKTA
-
NASDAQ
Ingles Markets Inc Cl A
RETAIL - Grocery Stores
|
$94.05
|
+0.53
0.57% |
$94.85
|
115,776
102.46% of 50 DAV
50 DAV is 113,000
|
$101.98
-7.78%
|
4/11/2022
|
$96.25
|
PP = $95.75
|
|
MB = $100.54
|
Most Recent Note - 4/27/2022 5:26:17 PM
Y - Pulled back today for a 6th consecutive loss since a "negative reversal" at its all-time high. Highlighted in yellow with pivot point cited based on its 3/21/22 high after a cup-with-high-handle base pattern. Subsequent gains backed by at least +40% above average volume may clinch a convincing technical buy signal. Reported Dec '21 earnings +31% on +17% sales revenues versus the year ago period. Three of the past 4 quarterly comparisons were above the +25% minimum earnings guideline (C criteria). Annual earnings growth (A criteria) has been very strong in recent years.
>>> FEATURED STOCK ARTICLE : Closed Near Session Low and Below Pivot Point Cited - 4/11/2022 |
View all notes |
Set NEW NOTE alert |
Company Profile |
SEC
News |
Chart |
Request a new note
C
A
S
I |
WCC
-
NYSE
Wesco International Inc
WHOLESALE - Electronics Wholesale
|
$127.25
|
+4.06
3.30% |
$128.55
|
640,700
141.43% of 50 DAV
50 DAV is 453,000
|
$140.92
-9.70%
|
4/21/2022
|
$135.54
|
PP = $139.10
|
|
MB = $146.06
|
Most Recent Note - 4/28/2022 5:29:03 PM
Y - Posted a solid gain today with above average volume. The prompt rebound above the 50 DMA line ($124) helped its outlook improve and its color code is changed to yellow.
>>> FEATURED STOCK ARTICLE : Approaching Prior Highs Where it Met Resistance - 4/21/2022 |
View all notes |
Set NEW NOTE alert |
Company Profile |
SEC
News |
Chart |
Request a new note
C
A
S
I |
SMPL
-
NASDAQ
Simply Good Foods Co
Food-Confectionery
|
$42.14
|
+0.78
1.89% |
$42.44
|
322,142
48.74% of 50 DAV
50 DAV is 661,000
|
$45.77
-7.93%
|
4/13/2022
|
$41.79
|
PP = $43.27
|
|
MB = $45.43
|
Most Recent Note - 4/27/2022 5:32:10 PM
Y - Retreated further from its 52-week high and has been slumping back into the prior base raising concerns. Reported Feb '22 quarterly earnings +44% on +29% sales revenues versus the year ago period, its 4th strong quarterly comparison.
>>> FEATURED STOCK ARTICLE : Simply Good Foods Had a Great Breakout - 4/14/2022 |
View all notes |
Set NEW NOTE alert |
Company Profile |
SEC
News |
Chart |
Request a new note
C
A
S
I |
IMXI
-
NASDAQ
International Money Exp
Financial Svcs-Specialty
|
$20.02
|
+0.54
2.77% |
$20.04
|
321,607
85.08% of 50 DAV
50 DAV is 378,000
|
$21.98
-8.92%
|
3/8/2022
|
$18.64
|
PP = $19.06
|
|
MB = $20.01
|
Most Recent Note - 4/28/2022 5:25:41 PM
Y - Still consolidating in an orderly fashion above its 50 DMA line ($19.17) which defines important near term support to watch. More damaging losses would raise concerns and trigger a technical sell signal.
>>> FEATURED STOCK ARTICLE : Consolidating After Rally From Previously Noted Base - 4/18/2022 |
View all notes |
Set NEW NOTE alert |
Company Profile |
SEC
News |
Chart |
Request a new note
C
A
S
I |
Symbol/Exchange
Company Name
Industry Group |
PRICE |
CHANGE
(%Change) |
Day High |
Volume
(% DAV)
(% 50 day avg vol) |
52 Wk Hi
% From Hi |
Featured
Date |
Price
Featured |
Pivot Featured |
|
Max Buy |
|
|
|
THESE ARE NOT BUY RECOMMENDATIONS!
Comments contained in the body of this report are technical
opinions only. The material herein has been obtained
from sources believed to be reliable and accurate, however,
its accuracy and completeness cannot be guaranteed.
This site is not an investment advisor, hence it does
not endorse or recommend any securities or other investments.
Any recommendation contained in this report may not
be suitable for all investors and it is not to be deemed
an offer or solicitation on our part with respect to
the purchase or sale of any securities. All trademarks,
service marks and trade names appearing in this report
are the property of their respective owners, and are
likewise used for identification purposes only.
This report is a service available
only to active Paid Premium Members.
You may opt-out of receiving report notifications
at any time. Questions or comments may be submitted
by writing to Premium Membership Services 665 S.E. 10 Street, Suite 201 Deerfield Beach, FL 33441-5634 or by calling 1-800-965-8307
or 954-785-1121.
|
|
|