***Last / Change / Volume quote data in this table corresponds with the timestamp on the note***
Symbol/Exchange
Company Name
Industry Group |
Last |
Chg. |
Vol
% DAV |
Date Featured |
Price Featured |
Latest Pivot Point
Featured |
Status |
| Latest Max Buy Price |
AMZN
- NASDAQ
Amazon.com Inc
INTERNET - Internet Software & Services
|
$137.49
|
+0.39
|
5,653,902
75% DAV
7,495,700
|
4/23/2010
(Date
Featured) |
$144.41
(Price
Featured) |
PP = $146.01 |
G |
| MB = $153.31 |
Most Recent Note - 5/3/2010 5:51:10 PM
G - Quietly consolidating above its 50 DMA line. It was featured in the 4/23/10 mid-day report (read here) while encountering distributional pressure following strong results for the March 31, 2010 quarter. Stocks that are "healthy" do not drift more than -7% below their pivot point after a fresh buy signal. Pyramiding into positions and limiting losses are critical parts to success.
>>> The latest Featured Stock Update with an annotated graph appeared on 4/23/2010. click here.
|
|
C
A
S
I |
News |
Chart |
SEC
View all notes Alert
me of new notes
Company
Profile
|
ARUN
- NASDAQ
Aruba Networks Inc
COMPUTER HARDWARE - Networking & Communication Dev
|
$12.77
|
+0.21
|
1,227,921
76% DAV
1,615,900
|
4/29/2010
(Date
Featured) |
$13.23
(Price
Featured) |
PP = $14.12 |
G |
| MB = $14.83 |
Most Recent Note - 5/3/2010 5:53:26 PM
G - Small gain today on light volume after slumping below its 50 DMA line on the prior session raised concerns. While approaching recent chart lows, its color code was changed to green.
>>> The latest Featured Stock Update with an annotated graph appeared on 4/29/2010. click here.
|
|
C
A
S
I |
News |
Chart |
SEC
View all notes Alert
me of new notes
Company
Profile
|
BIDU
- NASDAQ
Baidu Inc Ads
INTERNET - Internet Information Providers
|
$708.99
|
+20.03
|
1,042,668
68% DAV
1,525,500
|
1/13/2010
(Date
Featured) |
$431.25
(Price
Featured) |
PP = $426.75 |
G |
| MB = $448.09 |
Most Recent Note - 5/3/2010 5:55:20 PM
G - Holding its ground since a considerable gap up gain on 4/29/10 with more than twice its average volume after reporting great results for the quarter ended March 31, 2010. There was an impressive acceleration in sales revenues (+60%) and earnings (+144%). Its streak of 13 consecutive weekly gains leaves it extended from any sound base. Repeatedly noted - "could produce more climactic gains, especially due to the small supply (S criteria) of shares outstanding."
>>> The latest Featured Stock Update with an annotated graph appeared on 4/20/2010. click here.
|
|
C
A
S
I |
News |
Chart |
SEC
View all notes Alert
me of new notes
Company
Profile
|
BPI
- NYSE
Bridgepoint Education
DIVERSIFIED SERVICES - Education &; Training Services
|
$23.57
|
-2.14
|
552,002
117% DAV
471,000
|
4/13/2010
(Date
Featured) |
$25.59
(Price
Featured) |
PP = $25.76 |
G |
| MB = $27.05 |
Most Recent Note - 5/3/2010 11:54:24 AM
G - After reporting its latest earnings news it gapped up today and then abruptly reversed into the red. Enduring distributional pressure while still consolidating well above its 50 DMA line. The Commercial Services - Schools firm was featured in yellow in the 4/13/10 mid-day report (read here) as rose from a cup-with-high-handle.
>>> The latest Featured Stock Update with an annotated graph appeared on 4/13/2010. click here.
|
|
C
A
S
I |
News |
Chart |
SEC
View all notes Alert
me of new notes
Company
Profile
|
BRLI
- NASDAQ
Bio Reference Labs Inc
HEALTH SERVICES - Medical Laboratories & Researc
|
$23.40
|
-0.79
|
106,066
54% DAV
196,300
|
2/12/2010
(Date
Featured) |
$39.02
(Price
Featured) |
PP = $20.49 |
G |
| MB = $21.51 |
Most Recent Note - 4/30/2010 6:02:21 PM
G - Consolidating quietly after a big winning streak and a 2:1 stock split. Prior chart highs and its 50 DMA line are support levels to watch.
>>> The latest Featured Stock Update with an annotated graph appeared on 4/16/2010. click here.
|
|
C
A
S
I |
News |
Chart |
SEC
View all notes Alert
me of new notes
Company
Profile
|
CISG
- NASDAQ
Cninsure Inc Ads
INSURANCE - Insurance Brokers
|
$28.40
|
+0.66
|
200,189
78% DAV
255,100
|
3/3/2010
(Date
Featured) |
$24.38
(Price
Featured) |
PP = $23.10 |
Y |
| MB = $24.26 |
Most Recent Note - 5/3/2010 5:59:10 PM
Y - Rallying near its 52-week high. In the Certification they teach that a valid "second chance" entry point after a breakout occurs may be anywhere after a successful test of support at the stock's 10-week average, up to as much as +5% above its post-breakout high (in this case $28.62 +5% or $29.95). Its color code was changed to yellow, however the prior high is not considered a "pivot point" by definition since it did not form a proper new base.
>>> The latest Featured Stock Update with an annotated graph appeared on 4/19/2010. click here.
|
|
C
A
S
I |
News |
Chart |
SEC
View all notes Alert
me of new notes
Company
Profile
|
CRM
- NYSE
Salesforce.com Inc
INTERNET - Internet Software & Services
|
$85.60
|
-2.54
|
1,114,141
65% DAV
1,723,300
|
3/5/2010
(Date
Featured) |
$72.28
(Price
Featured) |
PP = $75.53 |
G |
| MB = $79.31 |
Most Recent Note - 4/30/2010 6:05:46 PM
G - Quietly consolidating from all-time highs with volume totals cooling for the past week. It is extended from prior chart highs and well above its "max buy" level. Patience may allow disciplined investors to accumulate shares without chasing it too far from a sound base.
>>> The latest Featured Stock Update with an annotated graph appeared on 4/21/2010. click here.
|
|
C
A
S
I |
News |
Chart |
SEC
View all notes Alert
me of new notes
Company
Profile
|
CTRP
- NASDAQ
Ctrip.com Intl Ltd Adr
LEISURE - Resorts & Casinos
|
$37.03
|
+0.53
|
786,029
42% DAV
1,875,700
|
3/25/2010
(Date
Featured) |
$40.74
(Price
Featured) |
PP = $39.40 |
G |
| MB = $41.37 |
Most Recent Note - 5/3/2010 6:01:23 PM
G - Small gain on light volume, remaining below its 50 DMA line. Color code was changed to green. Violation of its 4/21/10 low ($35.60) would complete a bearish head-and-shoulders type pattern formed over the past 8 weeks and could raise more serious concerns.
>>> The latest Featured Stock Update with an annotated graph appeared on 4/12/2010. click here.
|
|
C
A
S
I |
News |
Chart |
SEC
View all notes Alert
me of new notes
Company
Profile
|
EZPW
- NASDAQ
Ezcorp Inc Cl A
SPECIALTY RETAIL - Specialty Retail, Other
|
$21.35
|
+0.61
|
661,867
120% DAV
553,600
|
4/14/2010
(Date
Featured) |
$21.80
(Price
Featured) |
PP = $22.29 |
G |
| MB = $23.40 |
Most Recent Note - 5/3/2010
G - Promptly found support and rebounded today for a close back above its 50 DMA line. A considerable loss on 4/30/10 pressured it under its March highs and completely negated its latest breakout triggering technical sell signals. The impact of a proposed law, and possibly more to come, fueled speculation and concern in the industry.
>>> The latest Featured Stock Update with an annotated graph appeared on 4/27/2010. click here.
|
|
C
A
S
I |
News |
Chart |
SEC
View all notes Alert
me of new notes
Company
Profile
|
ISRG
- NASDAQ
Intuitive Surgical Inc
HEALTH SERVICES - Medical Appliances & Equipment
|
$372.22
|
+11.66
|
531,823
93% DAV
572,300
|
4/13/2010
(Date
Featured) |
$363.46
(Price
Featured) |
PP = $367.10 |
Y |
| MB = $385.46 |
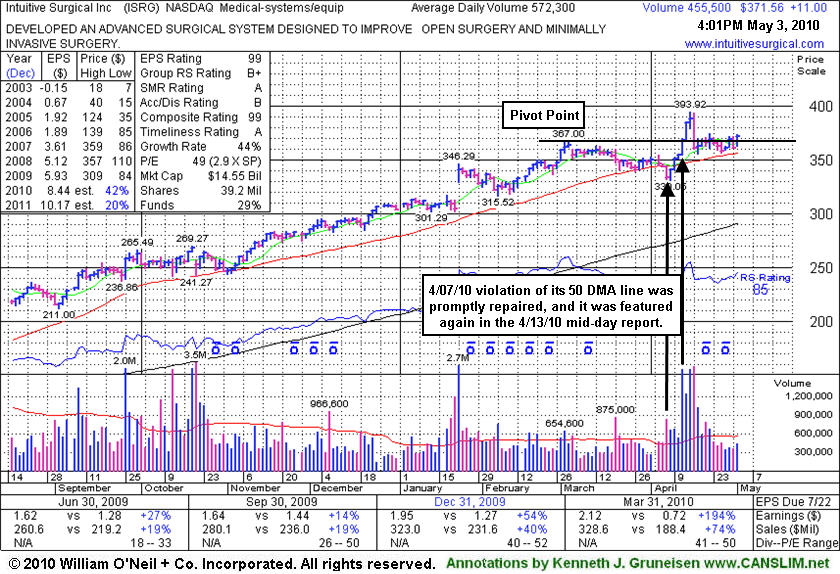
Most Recent Note - 5/3/2010 6:06:09 PM
Y - Consolidating quietly in a tight range near its pivot point.and above its 50 DMA line. A subsequent violation of its recent chart low or 50 DMA line could raise more serious concerns and trigger sell signals. ISRG was featured again in the 4/13/10 mid-day report (read here) with new pivot point cited based on its 3/03/10 high.
>>> The latest Featured Stock Update with an annotated graph appeared on 5/3/2010. click here.
|
|
C
A
S
I |
News |
Chart |
SEC
View all notes Alert
me of new notes
Company
Profile
|
LL
- NYSE
Lumber Liquidators Hldgs
RETAIL - Home Improvement Stores
|
$31.52
|
+1.06
|
459,628
110% DAV
418,800
|
4/22/2010
(Date
Featured) |
$29.87
(Price
Featured) |
PP = $29.03 |
G |
| MB = $30.48 |
Most Recent Note - 5/3/2010 6:07:22 PM
G - Started this week with a solid gain. A "positive reversal" on 4/28/10 was a sign of prompt support near prior chart highs in the $28 area. First featured in yellow at $29.87 in the 4/22/10 the mid-day report (read here).
>>> The latest Featured Stock Update with an annotated graph appeared on 4/26/2010. click here.
|
|
C
A
S
I |
News |
Chart |
SEC
View all notes Alert
me of new notes
Company
Profile
|
LOPE
- NASDAQ
Grand Canyon Education
DIVERSIFIED SERVICES - Education &; Training Services
|
$25.08
|
+0.90
|
394,717
104% DAV
378,500
|
4/13/2010
(Date
Featured) |
$27.71
(Price
Featured) |
PP = $27.33 |
G |
| MB = $28.70 |
Most Recent Note - 5/3/2010 6:08:54 PM
G - Gain on average volume today helped it close back above its 50 DMA line while ending a streak of 8 consecutive losses. Like many for-profit schools, it encountered distributional pressure in the wake of recently proposed regulatory changes.
>>> The latest Featured Stock Update with an annotated graph appeared on 4/14/2010. click here.
|
|
C
A
S
I |
News |
Chart |
SEC
View all notes Alert
me of new notes
Company
Profile
|
PCLN
- NASDAQ
Priceline.com Inc
INTERNET - Internet Software & Services
|
$399.55
|
-4.72
|
584,812
N/A
|
11/1/2002
(Date
Featured) |
$399.55
(Price
Featured) |
PP = $428.20 |
Y |
| MB = $449.61 |
Most Recent Note - 1/2/2011
Y - Returns to Featured Stocks list with its appearance in the January 2011 CANSLIM.net News including detailed analysis and annotated daily and weekly graphs.
>>> The latest Featured Stock Update with an annotated graph appeared on 4/28/2010. click here.
|
|
C
A
S
I |
News |
Chart |
SEC
View all notes Alert
me of new notes
Company
Profile
|
ROVI
- NASDAQ
Rovi Corp
COMPUTER SOFTWARE & SERVICES - Security Software & Services
|
$39.14
|
+0.16
|
1,416,581
112% DAV
1,265,900
|
4/20/2010
(Date
Featured) |
$37.62
(Price
Featured) |
PP = $38.60 |
Y |
| MB = $40.53 |
Most Recent Note - 5/3/2010 6:12:41 PM
Y - Stubbornly holding its ground near its 52-week high. Its 50 DMA line and recent chart low ($35.91 on 4/08/10) define important support to watch. Earnings news is due on May 6th.
>>> The latest Featured Stock Update with an annotated graph appeared on 4/8/2010. click here.
|
|
C
A
S
I |
News |
Chart |
SEC
View all notes Alert
me of new notes
Company
Profile
|
SIRO
- NASDAQ
Sirona Dental Systems
HEALTH SERVICES - Medical Instruments & Supplies
|
$42.27
|
+0.58
|
551,293
109% DAV
504,800
|
2/16/2010
(Date
Featured) |
$36.43
(Price
Featured) |
PP = $36.15 |
G |
| MB = $37.96 |
Most Recent Note - 5/3/2010 6:13:46 PM
G - Stubbornly holding its ground since its 4/23/10 gap up, extended from any sound base. Its 50 DMA line is an initial support level to watch above its 4/08/10 low ($37.00). Earnings release is scheduled for May 5th.
>>> The latest Featured Stock Update with an annotated graph appeared on 4/22/2010. click here.
|
|
C
A
S
I |
News |
Chart |
SEC
View all notes Alert
me of new notes
Company
Profile
|
ULTA
- NASDAQ
Ulta Salon Cosm & Frag
SPECIALTY RETAIL - Specialty Retail, Other
|
$23.93
|
+0.81
|
309,524
72% DAV
431,100
|
3/12/2010
(Date
Featured) |
$22.81
(Price
Featured) |
PP = $21.72 |
G |
| MB = $22.81 |
Most Recent Note - 5/3/2010 6:16:13 PM
G - It rallied again on lighter volume following heavy distributional pressure and the negative reversal that occurred on 4/26/10 at its 52-week high. A subsequent violation of its 50 DMA line or recent chart low $21.66 could trigger damaging technical sell signals.
>>> The latest Featured Stock Update with an annotated graph appeared on 4/30/2010. click here.
|
|
C
A
S
I |
News |
Chart |
SEC
View all notes Alert
me of new notes
Company
Profile
|
VIT
-
|
$24.93
|
+1.08
|
153,077
22% DAV
708,400
|
4/9/2010
(Date
Featured) |
$23.79
(Price
Featured) |
PP = $23.95 |
Y |
| MB = $25.15 |
Most Recent Note - 5/3/2010 12:05:34 PM
Y - Rebounding back above its pivot point with a gain today on quiet volume. Its considerable loss on 4/28/10 with volume more than 2 times average raised concerns while testing support near prior chart highs. Support to watch is its 50 DMA line, and any more damaging losses would raise serious concerns. A subsequent close below its 3/09/10 close ($23.41) would technically negate its latest breakout. Featured in the 4/09/10 mid-day report (read here).
>>> The latest Featured Stock Update with an annotated graph appeared on 4/9/2010. click here.
|
|
C
A
S
I |
News |
Chart |
SEC
View all notes Alert
me of new notes
Company
Profile
|