You are not logged in.
This means you
CAN ONLY VIEW reports that were published prior to Tuesday, July 9, 2024.
You
MUST UPGRADE YOUR MEMBERSHIP if you want to see any current reports.
AFTER MARKET UPDATE - THURSDAY, MAY 2ND, 2024
Previous After Market Report Next After Market Report >>>
|
|
|
|
DOW |
+322.37 |
38,225.66 |
+0.85% |
|
Volume |
1,077,895,776 |
-0% |
|
Volume |
5,083,249,100 |
-4% |
|
NASDAQ |
+235.48 |
15,840.96 |
+1.51% |
|
Advancers |
2,154 |
78% |
|
Advancers |
2,914 |
69% |
|
S&P 500 |
+45.81 |
5,064.20 |
+0.91% |
|
Decliners |
598 |
22% |
|
Decliners |
1,279 |
30% |
|
Russell 2000 |
+35.88 |
2,016.11 |
+1.81% |
|
52 Wk Highs |
72 |
|
|
52 Wk Highs |
77 |
|
|
S&P 600 |
+19.03 |
1,291.39 |
+1.50% |
|
52 Wk Lows |
24 |
|
|
52 Wk Lows |
104 |
|
|
Since Wednesday April 10th members of FACTBASEDINVESTING.COM were cautioned as a shift in conditions (M criteria) signaled a market "correction". Use greater caution, raise cash and reduce exposure by selling any weakening stocks on a case-by-case basis. New buying efforts will be avoided by disciplined investors until a solid follow-through day is noted confirming a new uptrend.
|
 |
Major Indicies Rose With Lighter Volume Totals
Kenneth J. Gruneisen - Passed the CAN SLIM® Master's Exam
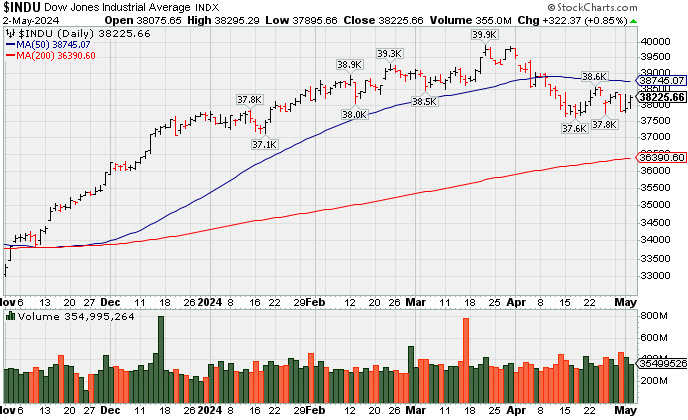
The Dow Jones Industrial Average rose +0.9% along with the S&P 500, and the Nasdaq Composite rose +1.5%. The Russell 2000 rose +1.8%. Volume reported was near the prior session total on the NYSE and lighter on the Nasdaq exchange. Breadth was positive as advancers led decliners by more than a 3-1 margin on the NYSE and by more than a 2-1 margin on the Nasdaq exchange. There were 38 high-ranked companies from the Leaders List that hit new 52-week highs and were listed on the BreakOuts Page versus 28 on the prior session. New 52-week highs outnumbered new 52-week lows on the NYSE but new lows still outnumbered new highs on the Nasdaq exchange. The major indices recently signaled a market correction (M criteria). Greater caution is important for all investors until a follow-through day signals a new confirmed uptrend.
PICTURED: The Dow Jones Industrial Average is consolidating below its 50-day moving average (DMA) line. The window remains open for a follow-through day as long as the Day 1 low is not violated. Friday's session marks Day 12 for the Dow Jones Industrial Average's rally attempt.
Mega cap and semiconductor stocks led an upbeat day for stocks, underpinned by an earnings-related gain in Qualcomm (QCOM +9.74%). Nine of the 11 S&P 500 sectors logged gains with the information technology sector (+1.6%) logging the biggest gain and the consumer discretionary sector (+1.6%) was another top performer. The materials (-0.5%) and health care (-0.1%) sectors were alone in negative territory.
The 10-yr note yield declined two basis points to 4.57% and the 2-yr note yield fell six basis points to 4.88%. Fed Chair Powell said it is unlikely in his view that the Fed will increase rates again, but he did not make it any more clear to the market when rates will be reduced. The April Employment report, due Friday morning, may influence the Fed's policy decisions.
|
 Kenneth J. Gruneisen started out as a licensed stockbroker in August 1987, a couple of months prior to the historic stock market crash that took the Dow Jones Industrial Average down -22.6% in a single day. He has published daily fact-based fundamental and technical analysis on high-ranked stocks online for two decades. Through FACTBASEDINVESTING.COM, Kenneth provides educational articles, news, market commentary, and other information regarding proven investment systems that work in good times and bad.
Comments contained in the body of this report are technical opinions only and are not necessarily those of Gruneisen Growth Corp. The material herein has been obtained from sources believed to be reliable and accurate, however, its accuracy and completeness cannot be guaranteed. Our firm, employees, and customers may effect transactions, including transactions contrary to any recommendation herein, or have positions in the securities mentioned herein or options with respect thereto. Any recommendation contained in this report may not be suitable for all investors and it is not to be deemed an offer or solicitation on our part with respect to the purchase or sale of any securities. |
|
 |
Retail, Financial, Tech, and Energy-Linked Groups Rose
Kenneth J. Gruneisen - Passed the CAN SLIM® Master's Exam
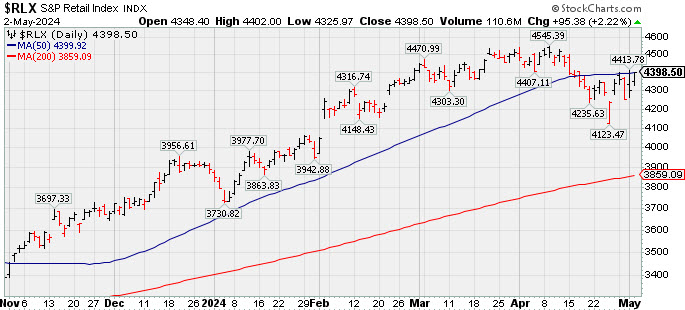
The Retail Index ($RLX +2.22%) outpaced the Broker/Dealer Index ($XBD +1.68%) and the Bank Index ($BKX +0.52%). The tech sector was led by the Semiconductor Index ($SOX +2.17%) while the Networking Index ($NWX +1.07%) followed and the Biotech Index ($BTK +0.70%) posted a smaller gain. The Oil Services Index ($OSX +1.39%) and the Integrated Oil Index ($XOI +0.95%) both posted gains while the Gold & Silver Index ($XAU +0.04%) finished flat.
![]() PICTURED: The Retail Index ($RLX +2.22%) posted a solid gain but it has still been meeting resistance at its 50-day moving average (DMA) line when rebounding.
| Oil Services |
$OSX |
84.87 |
+1.16 |
+1.39% |
+1.18% |
| Integrated Oil |
$XOI |
2,103.43 |
+19.81 |
+0.95% |
+12.94% |
| Semiconductor |
$SOX |
4,605.35 |
+97.67 |
+2.17% |
+10.30% |
| Networking |
$NWX |
743.55 |
+7.91 |
+1.07% |
-10.72% |
| Broker/Dealer |
$XBD |
604.49 |
+9.96 |
+1.68% |
+8.47% |
| Retail |
$RLX |
4,399.75 |
+96.63 |
+2.25% |
+13.14% |
| Gold & Silver |
$XAU |
134.30 |
+0.06 |
+0.04% |
+6.85% |
| Bank |
$BKX |
102.37 |
+0.53 |
+0.52% |
+6.62% |
| Biotech |
$BTK |
5,056.97 |
+35.18 |
+0.70% |
-6.68% |
|
|
|
 |
Featured Stocks
Kenneth J. Gruneisen - Passed the CAN SLIM® Master's Exam
|
|
|
Color Codes Explained :
Y - Better candidates highlighted by our
staff of experts.
G - Previously featured
in past reports as yellow but may no longer be buyable under the
guidelines.
***Last / Change / Volume data in this table is the closing quote data***
Symbol/Exchange
Company Name
Industry Group |
PRICE |
CHANGE
(%Change) |
Day High |
Volume
(% DAV)
(% 50 day avg vol) |
52 Wk Hi
% From Hi |
Featured
Date |
Price
Featured |
Pivot Featured |
|
Max Buy |
 NVO
-
NYSE
NVO
-
NYSE
Novo Nordisk ADR
Medical-Ethical Drugs
|
$124.02
|
-5.19
-4.02% |
$127.94
|
8,487,072
181.43% of 50 DAV
50 DAV is 4,678,000
|
$138.28
-10.31%
|
3/1/2024
|
$124.23
|
PP = $124.97
|
|
MB = $131.22
|
 Most Recent Note - 5/2/2024 8:58:21 PM
Sank further below the 50 DMA line ($127) with today's volume-driven loss raising greater concerns. A rebound above the 50 DMA line is needed for its outlook to improve. Prior low ($121.79 on 4/16/24) defines the next important support to watch. Faces near-term resistance up to the $138 level. Fundamentals remain strong. It will be dropped from the Featured Stocks list tonight.
>>> FEATURED STOCK ARTICLE : Fell Below 50-Day Moving Average Which May Act as Resistance - 4/24/2024 |
View all notes |
Set NEW NOTE alert |
Company Profile |
SEC
News |
Chart |
Request a new note
C
A
S
I |
AXON
-
NASDAQ
Axon Enterprise
Security/Sfty
|
$316.75
|
+5.18
1.66% |
$318.19
|
456,870
83.98% of 50 DAV
50 DAV is 544,000
|
$329.87
-3.98%
|
4/5/2024
|
$309.90
|
PP = $325.73
|
|
MB = $342.02
|
Most Recent Note - 5/2/2024 8:53:26 PM
Y - Posted a small gain today with below-average volume. Recently found prompt support near its 50 DMA line ($307). A gain and strong close above the pivot point backed by at least +40% above average volume is needed to trigger a proper technical buy signal. Fundamentals remain strong.
>>> FEATURED STOCK ARTICLE : Found Support Near 50-Day Moving Average After Recent Stall - 4/29/2024 |
View all notes |
Set NEW NOTE alert |
Company Profile |
SEC
News |
Chart |
Request a new note
C
A
S
I |
TDG
-
NYSE
TransDigm Group
Aerospace/Defense
|
$1,271.78
|
+22.46
1.80% |
$1,274.22
|
196,565
102.91% of 50 DAV
50 DAV is 191,000
|
$1,269.51
0.18%
|
4/12/2024
|
$1,224.21
|
PP = $1,246.32
|
|
MB = $1,308.64
|
Most Recent Note - 5/2/2024 9:00:58 PM
Y - Posted a gain today with average volume for a new all-time high. New pivot point was cited based on its 4/04/24 high plus 10 cents. Subsequent gains above the pivot point backed by at least +40% above average volume are needed to trigger a technical buy signal. Its 50 DMA line ($1,209) defines near-term support to watch.
>>> FEATURED STOCK ARTICLE : Found Support at 50-Day Moving Average Line and Hit New High - 4/30/2024 |
View all notes |
Set NEW NOTE alert |
Company Profile |
SEC
News |
Chart |
Request a new note
C
A
S
I |
USLM
-
NASDAQ
U.S. Lime & Minerals
Bldg-Cement/Concrt/Ag
|
$326.68
|
+6.07
1.89% |
$326.68
|
27,485
119.50% of 50 DAV
50 DAV is 23,000
|
$322.52
1.29%
|
2/9/2024
|
$254.68
|
PP = $265.09
|
|
MB = $278.34
|
Most Recent Note - 5/2/2024 9:02:42 PM
G - Posted a 5th consecutive gain today with above-average volume and finished at the session high for a new all-time high. Its 50 DMA line ($290.59) and recent lows define near-term support to watch. After the close it reported Mar '24 quarterly earnings +31% on +7% sales revenues versus the year-ago period.
>>> FEATURED STOCK ARTICLE : Trading in Tight Range Near High - 4/26/2024 |
View all notes |
Set NEW NOTE alert |
Company Profile |
SEC
News |
Chart |
Request a new note
C
A
S
I |
PAY
-
NYSE
Paymentus Holdings
Finance-CrdtCard/PmtPr
|
$21.02
|
+0.55
2.69% |
$21.23
|
319,765
77.61% of 50 DAV
50 DAV is 412,000
|
$25.21
-16.62%
|
3/5/2024
|
$19.97
|
PP = $18.89
|
|
MB = $19.83
|
Most Recent Note - 5/2/2024 8:59:34 PM
G - Posted a gan today with below average volume, finding support above its 50 DMA line ($20.32). Prior highs in the $18 range define the next support. More damaging losses would raise greater concerns. See the latest FSU analysis for more details and an annotated graph.
>>> FEATURED STOCK ARTICLE : Finding Support Near Prior Highs and 50-Day Moving Average - 5/1/2024 |
View all notes |
Set NEW NOTE alert |
Company Profile |
SEC
News |
Chart |
Request a new note
C
A
S
I |
Symbol/Exchange
Company Name
Industry Group |
PRICE |
CHANGE
(%Change) |
Day High |
Volume
(% DAV)
(% 50 day avg vol) |
52 Wk Hi
% From Hi |
Featured
Date |
Price
Featured |
Pivot Featured |
|
Max Buy |
HUBS
-
NYSE
HubSpot
Comp Sftwr-Spec Enterprs
|
$590.89
|
-15.20
-2.51% |
$606.21
|
873,581
170.96% of 50 DAV
50 DAV is 511,000
|
$693.85
-14.84%
|
4/4/2024
|
$686.66
|
PP = $660.10
|
|
MB = $693.11
|
Most Recent Note - 5/2/2024 8:56:11 PM
Slumped further below its 50 DMA line ($628) with higher volume behind today's big loss raising greater concerns. A rebound above the 50 DMA line is needed to help its outlook improve. Fundamentals remain strong. It will be dropped from the Featured Stocks list tonight.
>>> FEATURED STOCK ARTICLE : HUBS Testing 50-day Moving Average Line Again - 4/25/2024 |
View all notes |
Set NEW NOTE alert |
Company Profile |
SEC
News |
Chart |
Request a new note
C
A
S
I |
|
|
|
THESE ARE NOT BUY RECOMMENDATIONS!
Comments contained in the body of this report are technical
opinions only. The material herein has been obtained
from sources believed to be reliable and accurate, however,
its accuracy and completeness cannot be guaranteed.
This site is not an investment advisor, hence it does
not endorse or recommend any securities or other investments.
Any recommendation contained in this report may not
be suitable for all investors and it is not to be deemed
an offer or solicitation on our part with respect to
the purchase or sale of any securities. All trademarks,
service marks and trade names appearing in this report
are the property of their respective owners, and are
likewise used for identification purposes only.
This report is a service available
only to active Paid Premium Members.
You may opt-out of receiving report notifications
at any time. Questions or comments may be submitted
by writing to Premium Membership Services 665 S.E. 10 Street, Suite 201 Deerfield Beach, FL 33441-5634 or by calling 1-800-965-8307
or 954-785-1121.
|
|
|