You are not logged in.
This means you
CAN ONLY VIEW reports that were published prior to Monday, March 24, 2025.
You
MUST UPGRADE YOUR MEMBERSHIP if you want to see any current reports.
AFTER MARKET UPDATE - WEDNESDAY, MAY 1ST, 2024
Previous After Market Report Next After Market Report >>>
|
|
|
|
DOW |
+87.37 |
37,903.29 |
+0.23% |
|
Volume |
1,078,936,276 |
-8% |
|
Volume |
5,308,445,300 |
-2% |
|
NASDAQ |
-52.34 |
15,605.48 |
-0.33% |
|
Advancers |
1,666 |
61% |
|
Advancers |
2,415 |
58% |
|
S&P 500 |
-17.30 |
5,018.39 |
-0.34% |
|
Decliners |
1,086 |
39% |
|
Decliners |
1,741 |
42% |
|
Russell 2000 |
+6.32 |
1,980.23 |
+0.32% |
|
52 Wk Highs |
53 |
|
|
52 Wk Highs |
61 |
|
|
S&P 600 |
+4.42 |
1,272.36 |
+0.35% |
|
52 Wk Lows |
35 |
|
|
52 Wk Lows |
111 |
|
|
Since Wednesday April 10th members of FACTBASEDINVESTING.COM were cautioned as a shift in conditions (M criteria) signaled a market "correction". Use greater caution, raise cash and reduce exposure by selling any weakening stocks on a case-by-case basis. New buying efforts will be avoided by disciplined investors until a solid follow-through day is noted confirming a new uptrend.
|
 |
Fed Makes No Change as Indices End Mixed and Little Changed
Kenneth J. Gruneisen - Passed the CAN SLIM® Master's Exam
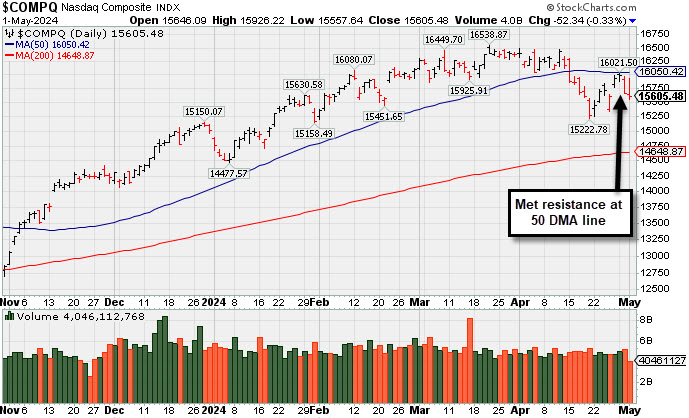
The Dow Jones Industrial Average (+0.2%) logged a gain while the S&P 500 (-0.3%) and Nasdaq Composite (-0.3%) closed with losses on Wednesday. Volume reported was lighter than the prior session total on the NYSE and on the Nasdaq exchange. Breadth was positive as advancers led decliners by a 3-2 margin on the NYSE and by a 4-3 margin on the Nasdaq exchange. There were 28 high-ranked companies from the Leaders List that hit new 52-week highs and were listed on the BreakOuts Page versus 33 on the prior session. New 52-week highs outnumbered new 52-week lows on the NYSE but new lows outnumbered new highs on the Nasdaq exchange. The major indices recently signaled a market correction (M criteria). Greater caution is important for all investors until a follow-through day signals a new confirmed uptrend.
PICTURED: The Nasdaq Composite Index met resistance at its 50-day moving average (DMA) line. The window remains open for a follow-through day as long as the Day 1 low is not violated. Thursday's session marks Day 9 of the rally attempt.
The stock market was little changed after the FOMC voted unanimously to leave the fed funds rate range at 5.25-5.50%, as expected, noting that there has been a lack of further progress toward reaching the inflation target in recent months. Fed Chair Powell remarked at the press conference that it was "unlikely that the next policy rate move will be a hike." The 2-yr note yield declined 11 basis points to 4.94% and the 10-yr note yield fell nine basis points to 4.60%.
Amazon.com (AMZN +2.29%) rose following earnings. Meanwhile, CVS Health (CVS -16.84%), Starbucks (SBUX -15.88%), and Skyworks Solutions (SWKS -15.28%) were standout decliners after earnings.
|
 Kenneth J. Gruneisen started out as a licensed stockbroker in August 1987, a couple of months prior to the historic stock market crash that took the Dow Jones Industrial Average down -22.6% in a single day. He has published daily fact-based fundamental and technical analysis on high-ranked stocks online for two decades. Through FACTBASEDINVESTING.COM, Kenneth provides educational articles, news, market commentary, and other information regarding proven investment systems that work in good times and bad.
Comments contained in the body of this report are technical opinions only and are not necessarily those of Gruneisen Growth Corp. The material herein has been obtained from sources believed to be reliable and accurate, however, its accuracy and completeness cannot be guaranteed. Our firm, employees, and customers may effect transactions, including transactions contrary to any recommendation herein, or have positions in the securities mentioned herein or options with respect thereto. Any recommendation contained in this report may not be suitable for all investors and it is not to be deemed an offer or solicitation on our part with respect to the purchase or sale of any securities. |
|
 |
Retail, Financial, Biotech, and Gold & Silver Indexes Rose
Kenneth J. Gruneisen - Passed the CAN SLIM® Master's Exam
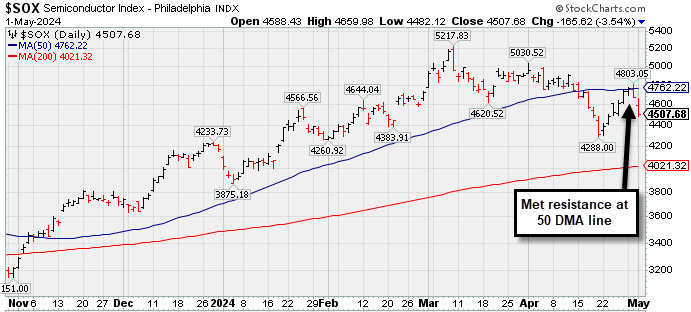
The Retail Index ($RLX +1.25%) outpaced the Broker/Dealer Index ($XBD +0.48%) and the Bank Index ($BKX +0.67%) which posted smaller gains. The tech sector was mixed as the Semiconductor Index ($SOX -3.54%) slumped while the Networking Index ($NWX +0.10%) finished flat and the Biotech Index ($BTK +1.55%) rose. The Gold & Silver Index ($XAU +0.60%) posted a small gain while the Oil Services Index ($OSX -1.429%) and the Integrated Oil Index ($XOI -1.62%) both suffered losses.
![]() PICTURED: The Semiconductor Index ($SOX -3.54%) pulled back for a larger loss after meeting resistance at its 50-day moving average (DMA) line when rebounding.
| Oil Services |
$OSX |
83.71 |
-1.21 |
-1.42% |
-0.20% |
| Integrated Oil |
$XOI |
2,083.62 |
-34.27 |
-1.62% |
+11.87% |
| Semiconductor |
$SOX |
4,507.68 |
-165.62 |
-3.54% |
+7.96% |
| Networking |
$NWX |
735.65 |
+0.73 |
+0.10% |
-11.67% |
| Broker/Dealer |
$XBD |
594.53 |
+2.85 |
+0.48% |
+6.68% |
| Retail |
$RLX |
4,303.12 |
+53.02 |
+1.25% |
+10.66% |
| Gold & Silver |
$XAU |
134.24 |
+0.80 |
+0.60% |
+6.81% |
| Bank |
$BKX |
101.84 |
+0.67 |
+0.67% |
+6.06% |
| Biotech |
$BTK |
5,021.79 |
+76.62 |
+1.55% |
-7.33% |
|
|
|
 |
Finding Support Near Prior Highs and 50-Day Moving Average
Kenneth J. Gruneisen - Passed the CAN SLIM® Master's Exam
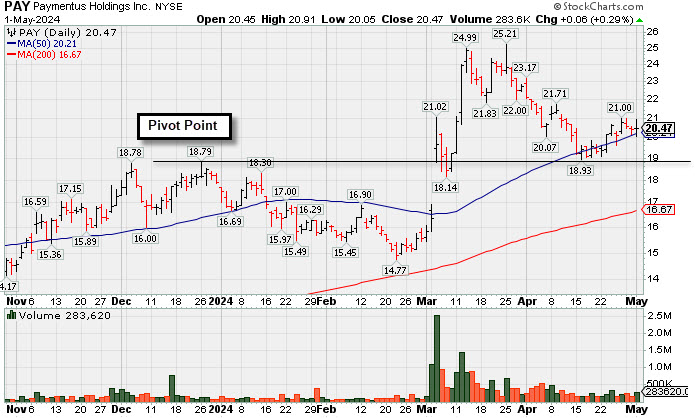
Paymentus Holdings (PAY +$0.06 or +0.29% to $20.47) posted a small gain today with below-average volume, finding support above its 50-day moving average (DMA) line ($20.21). Prior highs in the $18 range define the next support. More damaging losses would raise greater concerns.
PAY was highlighted in yellow with pivot point cited based on its 12/26/23 high plus 10 cents in the 3/05/23 mid-day report (read here). It was last shown in detail in this FSU section on 4/22/24 with an annotated graph under the headline "Prior Highs Define Important Near-Term Support".
Keep in mind it is due to report Mar '24 quarterly results on 5/06/24. Volume and volatility often increase near earninghs news. PAY has a 96 Earnings Per Share Rating. It reported Dec '23 quarterly earnings +175% on +25% sales revenues versus the year-ago period, its 3rd strong quarterly comparison well above the +25% minimum earnings guideline (C criteria). Its annual earnings history (A criteria) has been strong since its $21 IPO in May '21.
The number of top-rated funds owning its shares rose from 79 in Mar '23 to 118 in Mar '24, a reassuring sign concerning the I criteria. Its small supply of only 17.2 million shares in the public float (S criteria) can contribute to greater price volatility in the event of institutional buying or selling.
|
|
|
Color Codes Explained :
Y - Better candidates highlighted by our
staff of experts.
G - Previously featured
in past reports as yellow but may no longer be buyable under the
guidelines.
***Last / Change / Volume data in this table is the closing quote data***
Symbol/Exchange
Company Name
Industry Group |
PRICE |
CHANGE
(%Change) |
Day High |
Volume
(% DAV)
(% 50 day avg vol) |
52 Wk Hi
% From Hi |
Featured
Date |
Price
Featured |
Pivot Featured |
|
Max Buy |
 NVO
-
NYSE
NVO
-
NYSE
Novo Nordisk ADR
Medical-Ethical Drugs
|
$129.21
|
+0.90
0.70% |
$130.13
|
4,870,941
104.19% of 50 DAV
50 DAV is 4,675,000
|
$138.28
-6.56%
|
3/1/2024
|
$124.23
|
PP = $124.97
|
|
MB = $131.22
|
Most Recent Note - 4/30/2024 1:18:23 PM
G - Consolidating above the 50 DMA line ($127) with recent gains helping its outlook to improve. Faces some near-term resistance up to the $138 level. Fundamentals remain strong.
>>> FEATURED STOCK ARTICLE : Fell Below 50-Day Moving Average Which May Act as Resistance - 4/24/2024 |
View all notes |
Set NEW NOTE alert |
Company Profile |
SEC
News |
Chart |
Request a new note
C
A
S
I |
AXON
-
NASDAQ
Axon Enterprise
Security/Sfty
|
$311.57
|
-2.09
-0.67% |
$316.00
|
674,361
125.81% of 50 DAV
50 DAV is 536,000
|
$329.87
-5.55%
|
4/5/2024
|
$309.90
|
PP = $325.73
|
|
MB = $342.02
|
Most Recent Note - 4/29/2024 5:08:35 PM
Y - Posted a 6th consecutive small gain with below-average volume. It recently found prompt support near its 50 DMA line ($304). A gain and strong close above the pivot point backed by at least +40% above average volume is needed to trigger a proper technical buy signal. Fundamentals remain strong. See the latest FSU analysis for more details and a new annotated graph.
>>> FEATURED STOCK ARTICLE : Found Support Near 50-Day Moving Average After Recent Stall - 4/29/2024 |
View all notes |
Set NEW NOTE alert |
Company Profile |
SEC
News |
Chart |
Request a new note
C
A
S
I |
TDG
-
NYSE
TransDigm Group
Aerospace/Defense
|
$1,249.32
|
+1.29
0.10% |
$1,269.49
|
150,477
77.97% of 50 DAV
50 DAV is 193,000
|
$1,269.51
-1.59%
|
4/12/2024
|
$1,224.21
|
PP = $1,246.32
|
|
MB = $1,308.64
|
Most Recent Note - 4/30/2024 7:52:18 PM
Y - Churned above average volume today and ended slightly lower. Holding its ground at its all-time high. New pivot point was cited based on its 4/04/24 high plus 10 cents. Subsequent gains above the pivot point backed by at least +40% above average volume are needed to trigger a proper new technical buy signal. Its 50 DMA line ($1,205.61) defines near-term support to watch. See the latest FSU analysis for more details and a new annotated graph.
>>> FEATURED STOCK ARTICLE : Found Support at 50-Day Moving Average Line and Hit New High - 4/30/2024 |
View all notes |
Set NEW NOTE alert |
Company Profile |
SEC
News |
Chart |
Request a new note
C
A
S
I |
USLM
-
NASDAQ
U.S. Lime & Minerals
Bldg-Cement/Concrt/Ag
|
$320.61
|
+10.61
3.42% |
$322.52
|
38,238
173.81% of 50 DAV
50 DAV is 22,000
|
$311.50
2.92%
|
2/9/2024
|
$254.68
|
PP = $265.09
|
|
MB = $278.34
|
 Most Recent Note - 5/1/2024 5:48:30 PM
G - Posted a big gain with above-average volume today for a new all-time high. Its 50 DMA line ($289) and recent lows define near-term support to watch. After the close it reported Mar '24 quarterly earnings +31% on +7% sales revenues versus the year-ago period.
>>> FEATURED STOCK ARTICLE : Trading in Tight Range Near High - 4/26/2024 |
View all notes |
Set NEW NOTE alert |
Company Profile |
SEC
News |
Chart |
Request a new note
C
A
S
I |
PAY
-
NYSE
Paymentus Holdings
Finance-CrdtCard/PmtPr
|
$20.47
|
+0.06
0.29% |
$20.91
|
283,872
69.58% of 50 DAV
50 DAV is 408,000
|
$25.21
-18.80%
|
3/5/2024
|
$19.97
|
PP = $18.89
|
|
MB = $19.83
|
Most Recent Note - 5/1/2024 5:46:44 PM
G - Quietly finding support above its 50 DMA line ($20.21). Prior highs in the $18 range define the next support. More damaging losses would raise greater concerns. See the latest FSU analysis for more details and a new annotated graph.
>>> FEATURED STOCK ARTICLE : Finding Support Near Prior Highs and 50-Day Moving Average - 5/1/2024 |
View all notes |
Set NEW NOTE alert |
Company Profile |
SEC
News |
Chart |
Request a new note
C
A
S
I |
Symbol/Exchange
Company Name
Industry Group |
PRICE |
CHANGE
(%Change) |
Day High |
Volume
(% DAV)
(% 50 day avg vol) |
52 Wk Hi
% From Hi |
Featured
Date |
Price
Featured |
Pivot Featured |
|
Max Buy |
HUBS
-
NYSE
HubSpot
Comp Sftwr-Spec Enterprs
|
$606.09
|
+1.22
0.20% |
$622.25
|
625,730
122.93% of 50 DAV
50 DAV is 509,000
|
$693.85
-12.65%
|
4/4/2024
|
$686.66
|
PP = $660.10
|
|
MB = $693.11
|
Most Recent Note - 4/30/2024 7:57:56 PM
G - Color code is changed to green after violating its 50 DMA line ($627) with today's big loss on +18% above-average volume triggering a technical sell signal. Fundamentals remain strong. Only a prompt rebound above the 50 DMA line would help its outlook improve.
>>> FEATURED STOCK ARTICLE : HUBS Testing 50-day Moving Average Line Again - 4/25/2024 |
View all notes |
Set NEW NOTE alert |
Company Profile |
SEC
News |
Chart |
Request a new note
C
A
S
I |
|
|
|
THESE ARE NOT BUY RECOMMENDATIONS!
Comments contained in the body of this report are technical
opinions only. The material herein has been obtained
from sources believed to be reliable and accurate, however,
its accuracy and completeness cannot be guaranteed.
This site is not an investment advisor, hence it does
not endorse or recommend any securities or other investments.
Any recommendation contained in this report may not
be suitable for all investors and it is not to be deemed
an offer or solicitation on our part with respect to
the purchase or sale of any securities. All trademarks,
service marks and trade names appearing in this report
are the property of their respective owners, and are
likewise used for identification purposes only.
This report is a service available
only to active Paid Premium Members.
You may opt-out of receiving report notifications
at any time. Questions or comments may be submitted
by writing to Premium Membership Services 665 S.E. 10 Street, Suite 201 Deerfield Beach, FL 33441-5634 or by calling 1-800-965-8307
or 954-785-1121.
|
|
|