You are not logged in.
This means you
CAN ONLY VIEW reports that were published prior to Monday, April 14, 2025.
You
MUST UPGRADE YOUR MEMBERSHIP if you want to see any current reports.
AFTER MARKET UPDATE - THURSDAY, MAY 2ND, 2013
Previous After Market Report Next After Market Report >>>
|
|
|
|
DOW |
+130.63 |
14,831.58 |
+0.89% |
|
Volume |
676,652,240 |
-6% |
|
Volume |
1,708,695,600 |
-5% |
|
NASDAQ |
+41.49 |
3,340.62 |
+1.26% |
|
Advancers |
2,300 |
74% |
|
Advancers |
1,875 |
73% |
|
S&P 500 |
+14.89 |
1,597.59 |
+0.94% |
|
Decliners |
722 |
23% |
|
Decliners |
608 |
24% |
|
Russell 2000 |
+15.61 |
939.85 |
+1.69% |
|
52 Wk Highs |
280 |
|
|
52 Wk Highs |
115 |
|
|
S&P 600 |
+8.55 |
526.23 |
+1.65% |
|
52 Wk Lows |
13 |
|
|
52 Wk Lows |
33 |
|
|
 |
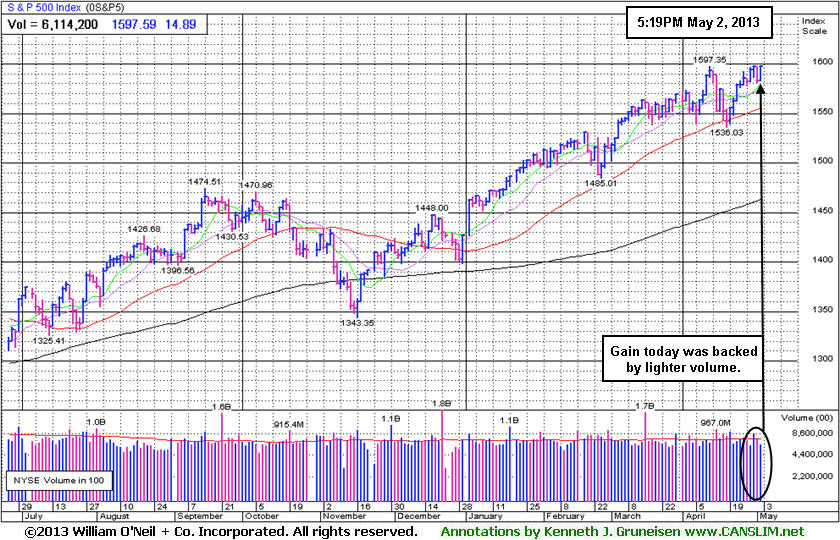
Major Averages Posted Gains With Less Volume Conviction
Kenneth J. Gruneisen - Passed the CAN SLIM® Master's Exam
Stocks were back in rally mode on Thursday. The Dow was up 130 points to 14,831. The S&P 500 Index hit a new intra-day high as it gained over 14 points to 1,597. The Nasdaq Composite Index was higher by 41 points to 3,340. However, the volume totals were reported lighter than the prior session totals on the NYSE and on the Nasdaq exchange, indicating that there was not an increase in institutional buying. There were 49 high-ranked companies from the CANSLIM.net Leaders List making new 52-week highs and appearing on the CANSLIM.net BreakOuts Page, up slightly from the prior session total of 45 stocks. Breadth was positive as advancers led decliners by more than 3-1 on the NYSE and on the Nasdaq exchange. New 52-week highs totals solidly outnumbered new 52-week lows on both the NYSE and the Nasdaq exchange. There were gains for 9 of the 10 high-ranked companies currently included on the Featured Stocks Page.
Easy monetary policy and economic data prompted a return to the risk-trade. Europe’s central bank lowered its main interest rate for the first time since July 2012 and ECB President Mario Draghi said the bank stands ready to take additional steps if needed. Encouraging news about the job market added to the positive tone as applications for unemployment benefits fell to a five-year low. Now the spotlight shifts to Friday's non-farm payrolls report which is anticipated to show 140,000 new jobs were added in April.
Overall, nearly all sectors finished higher. Technology was the best performing group as it continued its recent rally. Facebook Inc (FB -+5.5%) gained ground following a better-than-expected jump in first-quarter revenue. Visa Inc (V +5.65%) rallied after reporting earnings +20% on +15% sales revenues for the Mar '13 quarter, its 5th consecutive quarterly comparison with earnings below the +25% minimum guideline (C criteria). Energy stocks were also among the biggest advancers thanks to a bounce higher in crude oil prices, which pushed Exxon Mobil (XOM +1.2%) shares higher.
In fixed-income, Treasuries were virtually unchanged. The 10-year note was flat to yield 1.63% and the 30-year bond gained 3/32 to yield 2.82%.
The market (M criteria) is considered to be back in a "confirmed uptrend" because of the new closing highs from both the Nasdaq Composite and the S&P 500 Index on Monday. Although none of the major averages produced a solid follow-through-day within the most favorable period between Days 4-7 of the new rally attempt, the new highs from the indices argue sufficiently that the prior uptrend has resumed. Another encouraging characteristic of the current market is the latest expansion in leadership (stocks hitting new 52-week highs).
Watch for an announcement via email concerning the next WEBCAST. The webcast will also be available via an updated link highlighted at the top of the Premium Member Homepage.
PICTURED: The S&P 500 Index touched a new all-time high intra-day but its gain on the session was backed by a lighter volume total. The benchmark index's prior low and 50-day moving average (DMA) line define important near-term chart support to watch on pullbacks.
|
 Kenneth J. Gruneisen started out as a licensed stockbroker in August 1987, a couple of months prior to the historic stock market crash that took the Dow Jones Industrial Average down -22.6% in a single day. He has published daily fact-based fundamental and technical analysis on high-ranked stocks online for two decades. Through FACTBASEDINVESTING.COM, Kenneth provides educational articles, news, market commentary, and other information regarding proven investment systems that work in good times and bad.
Comments contained in the body of this report are technical opinions only and are not necessarily those of Gruneisen Growth Corp. The material herein has been obtained from sources believed to be reliable and accurate, however, its accuracy and completeness cannot be guaranteed. Our firm, employees, and customers may effect transactions, including transactions contrary to any recommendation herein, or have positions in the securities mentioned herein or options with respect thereto. Any recommendation contained in this report may not be suitable for all investors and it is not to be deemed an offer or solicitation on our part with respect to the purchase or sale of any securities. |
|
 |
Financial, Retail, Medical, Energy, and Tech Groups Rose
Kenneth J. Gruneisen - Passed the CAN SLIM® Master's Exam
The major averages' rally was underpinned by gains from the influential Retail Index ($RLX +0.93%) and financial indexes including the Broker/Dealer Index ($XBD +2.81%) and the Bank Index ($BKX +0.62%). The Biotechnology Index ($BTK +1.63%) and the Healthcare Index ($HMO +1.10%) both tallied gains. Other tech sector indices including the Semiconductor Index ($SOX +1.38%), Internet Index ($IIX +1.19%), and the Networking Index ($NWX +0.55%) rose. Strength in energy-related shares also boosted the Integrated Oil Index ($XOI +1.39%) and the Oil Services Index ($OSX +1.56%). The Gold & Silver Index ($XAU -0.10%) was a standout laggard group ending with a small loss.
Charts courtesy www.stockcharts.com

PICTURED: The Broker/Dealer Index ($XBD +2.81%) rallied to its best close of 2013. The reassuring action from the financial group
| Oil Services |
$OSX |
250.74 |
+3.84 |
+1.56% |
+13.89% |
| Healthcare |
$HMO |
2,984.19 |
+32.46 |
+1.10% |
+18.69% |
| Integrated Oil |
$XOI |
1,363.22 |
+18.68 |
+1.39% |
+9.77% |
| Semiconductor |
$SOX |
446.89 |
+6.09 |
+1.38% |
+16.36% |
| Networking |
$NWX |
222.09 |
+1.22 |
+0.55% |
-1.97% |
| Internet |
$IIX |
363.38 |
+4.26 |
+1.19% |
+11.13% |
| Broker/Dealer |
$XBD |
113.43 |
+3.10 |
+2.81% |
+20.25% |
| Retail |
$RLX |
748.48 |
+6.93 |
+0.93% |
+14.61% |
| Gold & Silver |
$XAU |
107.15 |
-0.11 |
-0.10% |
-35.30% |
| Bank |
$BKX |
56.44 |
+0.35 |
+0.62% |
+10.06% |
| Biotech |
$BTK |
1,923.70 |
+30.88 |
+1.63% |
+24.35% |
|
|
|
 |
Daily and Weekly Graphs Illustrate Wedging Action
Kenneth J. Gruneisen - Passed the CAN SLIM® Master's Exam
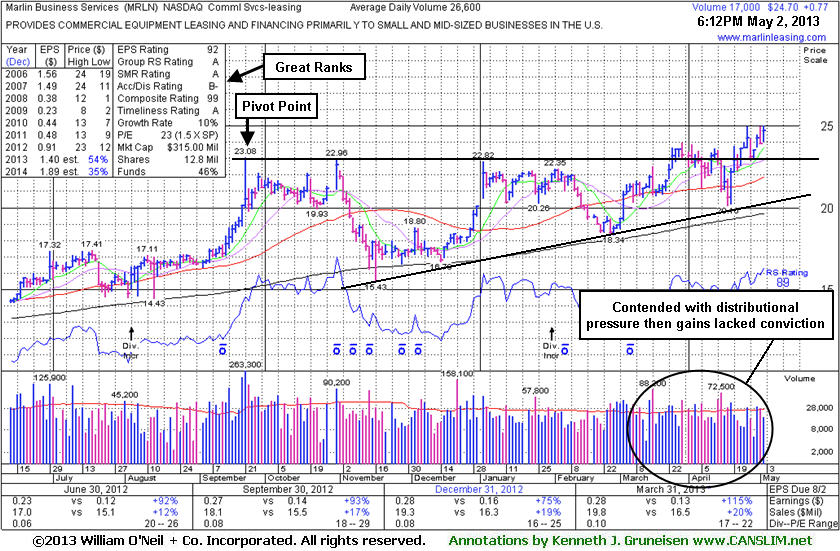
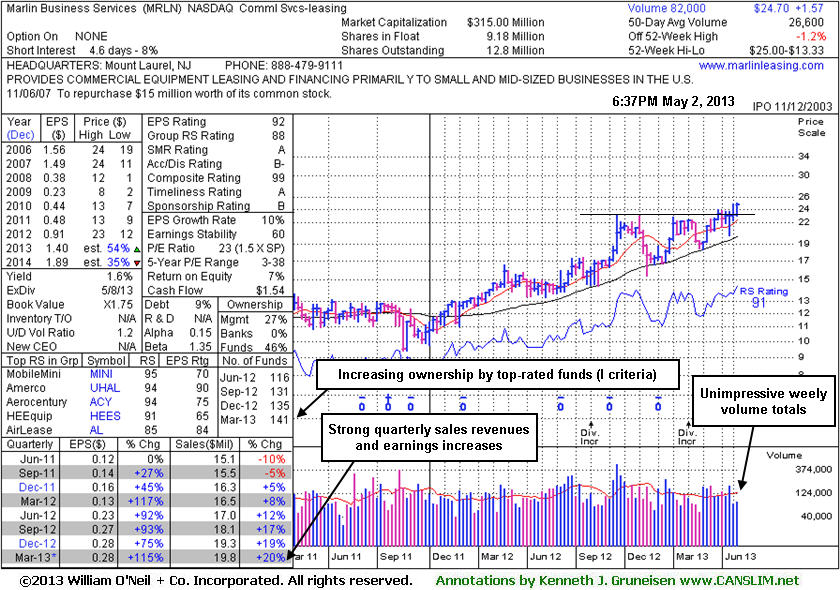
Marlin Business Services (MRLN +$0.77 or +3.22% to $24.70) rallied for its best close of 2013 with a gain today backed by very light volume of only 17,000 shares, only 64% of its average (26,600) daily volume total. Comparing the session's lighter-than-average total to the higher-than-average volume totals seen while it was enduring distributional pressure and briefly undercut its 50-day moving average (DMA) line in recent weeks, it remains clear that the price/volume action has not been indicative of especially great new institutional buying demand. One still questions its ability to fight for meaningful and sustained gains into new high territory when it is free to rally with no resistance remaining due to overhead supply and market conditions (the M criteria) are good. Meanwhile, its color code was changed to green after rallying beyond the "may buy" level.
MRLN was last seen in this FSU section on 4/09/13 with an annotated graph under the headline, "Consolidating Following 'Negative Reversal' at 52-Week High". An upward trendline and its 200 DMA line define support below its 50 DMA line. Members were previously reminded - "Disciplined investors know that there is no advantage to getting in "early" before a technical breakout proves that fresh institutional buying demand is lurking. Watch for for it to make a stand and produce subsequent volume-driven gains for new high (N criteria) above the pivot point to trigger a technical buy signal before action may be justified under the fact-based investment system."
Recent quarterly comparisons through Mar '13 show strong earnings increases above the +25% minimum guideline satisfying the C criteria. Annual earnings (A criteria) growth has improved following the downturn in FY '08 and '09. The Commercial Services - Leasing group has a high 88 Group Relative Strength Rating, a good sign concerning the L criteria. With only 9.18 million shares (S criteria) in the publicly traded float it may be particularly volatile in the event of any institutional buying or selling. The number of top-rated funds owning its shares rose from 111 in Mar '12 to 141 in Mar '13, a reassuring sign concerning the I criteria. Its current Up/Down Volume Ratio of 1.2 is also an unbiased bullish indication that its shares have been under only slight accumulation over the past 50 days. The annotated daily and weekly graphs below illustrate the wedging action as it advanced into new high territory.
|
|
|
Color Codes Explained :
Y - Better candidates highlighted by our
staff of experts.
G - Previously featured
in past reports as yellow but may no longer be buyable under the
guidelines.
***Last / Change / Volume data in this table is the closing quote data***
Symbol/Exchange
Company Name
Industry Group |
PRICE |
CHANGE
(%Change) |
Day High |
Volume
(% DAV)
(% 50 day avg vol) |
52 Wk Hi
% From Hi |
Featured
Date |
Price
Featured |
Pivot Featured |
|
Max Buy |
CELG
-
NASDAQ
Celgene Corp
DRUGS - Drug Manufacturers - Major
|
$119.26
|
+2.60
2.23% |
$119.57
|
3,345,038
101.39% of 50 DAV
50 DAV is 3,299,100
|
$128.52
-7.21%
|
3/27/2013
|
$113.24
|
PP = $115.54
|
|
MB = $121.32
|
Most Recent Note - 4/30/2013 6:07:42 PM
G - Enduring more distributional pressure yet still stubbornly holding its ground only -8.1% off its high. It is extended from any sound base. Its 50 DMA line ($113 now) defines important near-term support to watch.
>>> The latest Featured Stock Update with an annotated graph appeared on 4/19/2013. Click here.
View all notes |
Alert me of new notes |
CANSLIM.net Company Profile |
SEC |
Zacks Reports |
StockTalk |
News |
Chart |
Request a new note
C
A N
S L
I M


|
CMCSA
-
NASDAQ
Comcast Corp Cl A
MEDIA - CATV Systems
|
$42.11
|
+0.25
0.60% |
$42.20
|
7,773,253
60.89% of 50 DAV
50 DAV is 12,767,100
|
$42.61
-1.17%
|
12/3/2012
|
$37.08
|
PP = $38.06
|
|
MB = $39.96
|
Most Recent Note - 4/26/2013 4:28:11 PM
G - Rebounded above its 50 DMA line with higher volume behind its gain, helping its technical stance improve. Fundamental concerns were repeatedly noted after sub par earnings results for the Dec '12 quarter.
>>> The latest Featured Stock Update with an annotated graph appeared on 4/16/2013. Click here.
View all notes |
Alert me of new notes |
CANSLIM.net Company Profile |
SEC |
Zacks Reports |
StockTalk |
News |
Chart |
Request a new note
C
A N
S L
I M
|
EQM
-
NYSE
E Q T Midstream Partners
ENERGY - Oil and Gas Pipelines
|
$45.69
|
+0.14
0.31% |
$46.61
|
160,275
208.69% of 50 DAV
50 DAV is 76,800
|
$47.22
-3.24%
|
4/25/2013
|
$40.16
|
PP = $40.84
|
|
MB = $42.88
|
 Most Recent Note - 5/2/2013 12:32:07 PM
G - Holding its ground near its 52-week high following an impressive streak of 7 consecutive gains. Prior highs in the $40 area define initial support to watch above its 50 DMA line on pullbacks.
>>> The latest Featured Stock Update with an annotated graph appeared on 4/25/2013. Click here.
View all notes |
Alert me of new notes |
CANSLIM.net Company Profile |
SEC |
Zacks Reports |
StockTalk |
News |
Chart |
Request a new note
C
A N
S L
I M
|
FLT
-
NYSE
Fleetcor Technologies
DIVERSIFIED SERVICES - Business/Management Services
|
$77.20
|
+2.30
3.07% |
$77.25
|
1,206,112
149.33% of 50 DAV
50 DAV is 807,700
|
$78.87
-2.12%
|
3/21/2013
|
$71.14
|
PP = $73.00
|
|
MB = $76.65
|
Most Recent Note - 5/2/2013 7:10:22 PM
G - Finished near the session high with a solid gain backed by above average volume. Perched within close striking distance of its 52-week high. Its 50 DMA line and recent low ($70.09) define near-term support where violations would raise more serious concerns and trigger worrisome technical sell signals.
>>> The latest Featured Stock Update with an annotated graph appeared on 4/15/2013. Click here.
View all notes |
Alert me of new notes |
CANSLIM.net Company Profile |
SEC |
Zacks Reports |
StockTalk |
News |
Chart |
Request a new note
C
A N
S L
I M
|
LNKD
-
NYSE
Linkedin Corp Class A
INTERNET - Internet Information Providers
|
$201.67
|
+6.85
3.52% |
$202.91
|
6,302,254
307.32% of 50 DAV
50 DAV is 2,050,700
|
$195.50
3.16%
|
4/12/2013
|
$182.69
|
PP = $184.25
|
|
MB = $193.46
|
Most Recent Note - 5/2/2013 7:12:09 PM
G - Gapped up and spiked to another new 52-week high with heavy volume behind its considerable gain today, getting more extended beyond its "max buy" level. Its 50 DMA line and recent low define important near-term chart support to watch.
>>> The latest Featured Stock Update with an annotated graph appeared on 4/29/2013. Click here.
View all notes |
Alert me of new notes |
CANSLIM.net Company Profile |
SEC |
Zacks Reports |
StockTalk |
News |
Chart |
Request a new note
C
A N
S L
I M
|
Symbol/Exchange
Company Name
Industry Group |
PRICE |
CHANGE
(%Change) |
Day High |
Volume
(% DAV)
(% 50 day avg vol) |
52 Wk Hi
% From Hi |
Featured
Date |
Price
Featured |
Pivot Featured |
|
Max Buy |
MRLN
-
NASDAQ
Marlin Business Services
DIVERSIFIED SERVICES - Rental and Leasing Services
|
$24.70
|
+0.77
3.22% |
$25.00
|
17,034
64.04% of 50 DAV
50 DAV is 26,600
|
$24.95
-1.00%
|
3/15/2013
|
$22.29
|
PP = $23.18
|
|
MB = $24.34
|
Most Recent Note - 5/2/2013 6:56:01 PM
G - Color code is changed to green after wedging above its "max buy" level with gains lacking great volume conviction. See latest FSU analysis for more details and new annotated daily and weekly graphs
>>> The latest Featured Stock Update with an annotated graph appeared on 5/2/2013. Click here.
View all notes |
Alert me of new notes |
CANSLIM.net Company Profile |
SEC |
Zacks Reports |
StockTalk |
News |
Chart |
Request a new note
C
A N
S L
I M
|
N
-
NYSE
Netsuite Inc
DIVERSIFIED SERVICES - Business/Management Services
|
$88.76
|
+0.98
1.12% |
$89.00
|
369,587
99.46% of 50 DAV
50 DAV is 371,600
|
$89.19
-0.48%
|
12/12/2012
|
$64.75
|
PP = $67.12
|
|
MB = $70.48
|
Most Recent Note - 4/29/2013 12:22:08 PM
G - Reported earnings -33% on +32% sales revenues for the Mar '13 quarter, marking a 2nd consecutive quarterly comparison with earnings below the +25% minimum guideline (C criteria). Despite fundamental concerns raised it is rallying for another new all-time high with today's 5th consecutive gain. Its 50 DMA line defines important near-term support to watch.
>>> The latest Featured Stock Update with an annotated graph appeared on 4/22/2013. Click here.
View all notes |
Alert me of new notes |
CANSLIM.net Company Profile |
SEC |
Zacks Reports |
StockTalk |
News |
Chart |
Request a new note
C
A N
S L
I M
|
PRAA
-
NASDAQ
Portfolio Recovery Assoc
DIVERSIFIED SERVICES - Business/Management Services
|
$136.74
|
+5.86
4.48% |
$138.20
|
126,468
177.87% of 50 DAV
50 DAV is 71,100
|
$133.50
2.43%
|
11/15/2004
|
$130.77
|
PP = $127.88
|
|
MB = $134.27
|
Most Recent Note - 5/2/2013 7:00:38 PM
G - Color code is changed to green after it spiked further into new high territory and finished above its "max buy" level with another considerable volume-driven gain adding to its previously noted "breakaway gap". Reported earnings +54% on +21% sales revenues for the Mar '13 quarter. See the latest FSU analysis for more details and a new annotated graph.
>>> The latest Featured Stock Update with an annotated graph appeared on 5/1/2013. Click here.
View all notes |
Alert me of new notes |
CANSLIM.net Company Profile |
SEC |
Zacks Reports |
StockTalk |
News |
Chart |
Request a new note
C
A N
S L
I M
|
RRTS
-
NYSE
Roadrunner Trans Systems
TRANSPORTATION - Air Delivery and Freight Service
|
$22.64
|
+0.35
1.57% |
$23.15
|
1,373,323
791.54% of 50 DAV
50 DAV is 173,500
|
$23.88
-5.19%
|
4/3/2013
|
$22.77
|
PP = $23.75
|
|
MB = $24.94
|
Most Recent Note - 5/2/2013 7:02:33 PM
G - Traded above but finished below its 50 DMA line today after encountering resistance near that important short-term average. Failed to trigger a new buy signal since featured on 4/03/13. A rebound above the 50 DMA line is needed to help its outlook improve.
>>> The latest Featured Stock Update with an annotated graph appeared on 4/23/2013. Click here.
View all notes |
Alert me of new notes |
CANSLIM.net Company Profile |
SEC |
Zacks Reports |
StockTalk |
News |
Chart |
Request a new note
C
A N
S L
I M
|
VRX
-
NYSE
Valeant Pharmaceuticals
DRUGS - Drug Manufacturers - Other
|
$72.15
|
-1.54
-2.09% |
$74.88
|
1,828,710
126.02% of 50 DAV
50 DAV is 1,451,100
|
$76.57
-5.77%
|
4/30/2013
|
$60.24
|
PP = $76.66
|
|
MB = $80.49
|
Most Recent Note - 5/2/2013 7:07:15 PM
Y- Reported earnings +14% on +25% sales revenues for the quarter ended March 31, 2013 versus the year ago period, below the +25% minimum earnings guideline (C criteria) raising fundamental concerns. Finished near the session low and near its 50 DMA line defining important near-term support above the recent low ($69.87 on 4/04/13). Subsequent violations may trigger technical sell signals. See the latest FSU analysis for more details and an annotated graph.
>>> The latest Featured Stock Update with an annotated graph appeared on 4/30/2013. Click here.
View all notes |
Alert me of new notes |
CANSLIM.net Company Profile |
SEC |
Zacks Reports |
StockTalk |
News |
Chart |
Request a new note
C
A N
S L
I M
|
Symbol/Exchange
Company Name
Industry Group |
PRICE |
CHANGE
(%Change) |
Day High |
Volume
(% DAV)
(% 50 day avg vol) |
52 Wk Hi
% From Hi |
Featured
Date |
Price
Featured |
Pivot Featured |
|
Max Buy |
|
|
|
THESE ARE NOT BUY RECOMMENDATIONS!
Comments contained in the body of this report are technical
opinions only. The material herein has been obtained
from sources believed to be reliable and accurate, however,
its accuracy and completeness cannot be guaranteed.
This site is not an investment advisor, hence it does
not endorse or recommend any securities or other investments.
Any recommendation contained in this report may not
be suitable for all investors and it is not to be deemed
an offer or solicitation on our part with respect to
the purchase or sale of any securities. All trademarks,
service marks and trade names appearing in this report
are the property of their respective owners, and are
likewise used for identification purposes only.
This report is a service available
only to active Paid Premium Members.
You may opt-out of receiving report notifications
at any time. Questions or comments may be submitted
by writing to Premium Membership Services 665 S.E. 10 Street, Suite 201 Deerfield Beach, FL 33441-5634 or by calling 1-800-965-8307
or 954-785-1121.
|
|
|

