You are not logged in.
This means you
CAN ONLY VIEW reports that were published prior to Thursday, April 10, 2025.
You
MUST UPGRADE YOUR MEMBERSHIP if you want to see any current reports.
AFTER MARKET UPDATE - WEDNESDAY, MAY 1ST, 2013
Previous After Market Report Next After Market Report >>>
|
|
|
|
DOW |
-138.85 |
14,700.95 |
-0.94% |
|
Volume |
721,086,170 |
-19% |
|
Volume |
1,797,215,030 |
-4% |
|
NASDAQ |
-29.66 |
3,299.13 |
-0.89% |
|
Advancers |
841 |
27% |
|
Advancers |
541 |
21% |
|
S&P 500 |
-14.87 |
1,582.70 |
-0.93% |
|
Decliners |
2,182 |
70% |
|
Decliners |
1,950 |
76% |
|
Russell 2000 |
-23.25 |
924.21 |
-2.45% |
|
52 Wk Highs |
254 |
|
|
52 Wk Highs |
131 |
|
|
S&P 600 |
-11.92 |
517.68 |
-2.25% |
|
52 Wk Lows |
17 |
|
|
52 Wk Lows |
39 |
|
|
 |
Major Averages Pulled Back on Lighter Volume Totals
Kenneth J. Gruneisen - Passed the CAN SLIM® Master's Exam
The major averages finished lower in the first trading day of May. Wednesday's volume totals on the exchanges were reported lighter than the prior session totals on the NYSE and on the Nasdaq exchange, indicating that there was not a worrisome increase in institutional selling pressure. Breadth was negative as decliners outnumbered advancers by nearly 3-1 on the NYSE and by nearly 4-1 on the Nasdaq exchange. New 52-week highs totals contracted yet still solidly outnumbered new 52-week lows on both the NYSE and the Nasdaq exchange. There were 45 high-ranked companies from the CANSLIM.net Leaders List making new 52-week highs and appearing on the CANSLIM.net BreakOuts Page, down from the prior session total of 51 stocks. There were gains for only 3 of the 11 high-ranked companies currently included on the Featured Stocks Page.
The major averages retreated amid evidence of a possible slowing economy. Manufacturing expanded in April at the slowest pace since last December and an ADP report showed companies added the fewest workers in seven months. The FOMC statement came into focus later in the session. It revealed the Fed's continued commitment to the pace of its monthly bond-buying program and showed the central bank is prepared to vary its purchases as economic conditions evolve.
Overall, all sectors finished in negative territory. The biggest drop in copper prices in a year led the Materials group to post the biggest losses as Cliffs Natural Resources Inc (CLF -4.73) tumbled. Financials also suffered a setback with MasterCard Inc (MA -2.37%) falling after missing first-quarter revenue expectations. Earnings results will also garner attention after the closing bell with profit tallies due out from Visa Inc (V -1.45%) and Facebook Inc (FB -1.22%).
In fixed-income, Treasuries rallied. The 10-year note increased 12/32 to yield 1.63%, its lowest level since December.
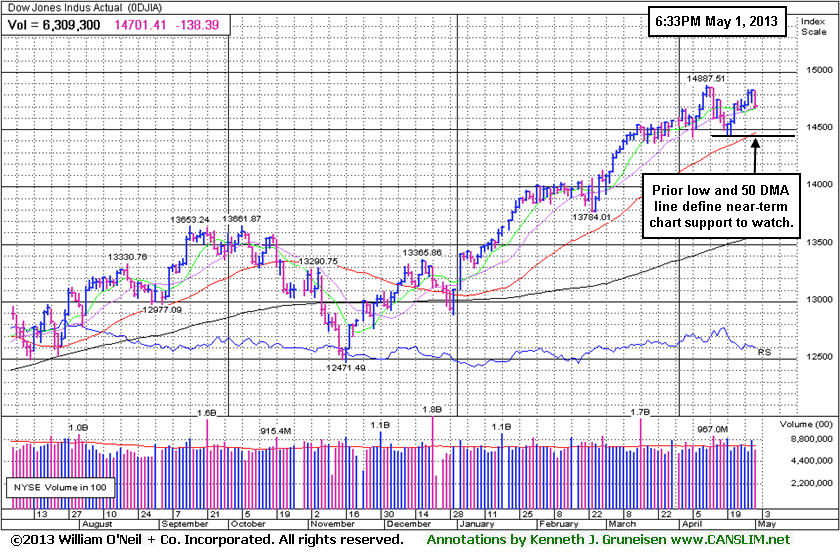
The market (M criteria) is considered to be back in a "confirmed uptrend" because of the new closing highs from both the Nasdaq Composite and the S&P 500 Index on Monday. Although none of the major averages produced a solid follow-through-day within the most favorable period between Days 4-7 of the new rally attempt, the new highs from the indices argue sufficiently that the prior uptrend has resumed. Another encouraging characteristic of the current market is the latest expansion in leadership (stocks hitting new 52-week highs).
Watch for an announcement via email concerning the next WEBCAST. The webcast will also be available via an updated link highlighted at the top of the Premium Member Homepage.
PICTURED: The Dow Jones Industrial Average is perched near its all-time high. Its prior low and 50-day moving average (DMA) line define near-term chart support to watch on pullbacks.
|
 Kenneth J. Gruneisen started out as a licensed stockbroker in August 1987, a couple of months prior to the historic stock market crash that took the Dow Jones Industrial Average down -22.6% in a single day. He has published daily fact-based fundamental and technical analysis on high-ranked stocks online for two decades. Through FACTBASEDINVESTING.COM, Kenneth provides educational articles, news, market commentary, and other information regarding proven investment systems that work in good times and bad.
Comments contained in the body of this report are technical opinions only and are not necessarily those of Gruneisen Growth Corp. The material herein has been obtained from sources believed to be reliable and accurate, however, its accuracy and completeness cannot be guaranteed. Our firm, employees, and customers may effect transactions, including transactions contrary to any recommendation herein, or have positions in the securities mentioned herein or options with respect thereto. Any recommendation contained in this report may not be suitable for all investors and it is not to be deemed an offer or solicitation on our part with respect to the purchase or sale of any securities. |
|
 |
Retail, Financial, Tech, and Commodity-Linked Groups Fell
Kenneth J. Gruneisen - Passed the CAN SLIM® Master's Exam
The Retail Index ($RLX -0.87%) and financial indexes were negative influences on the major averages as the Broker/Dealer Index ($XBD -2.25%) and the Bank Index ($BKX -1.39%) pulled back. The tech sector saw unanimous losses from the Networking Index ($NWX -2.01%), Biotechnology Index ($BTK -2.01%), Internet Index ($IIX -1.14%) and the Semiconductor Index ($SOX -0.80%). Commodity-linked groups also lost ground as the Gold & Silver Index ($XAU -1.92%), Oil Services Index ($OSX -1.01%), and the Integrated Oil Index ($XOI -1.62%) were lower. Meanwhile, the Healthcare Index ($HMO +0.13%) was a standout as it eked out a small gain on Wednesday's mostly negative session.
Charts courtesy www.stockcharts.com
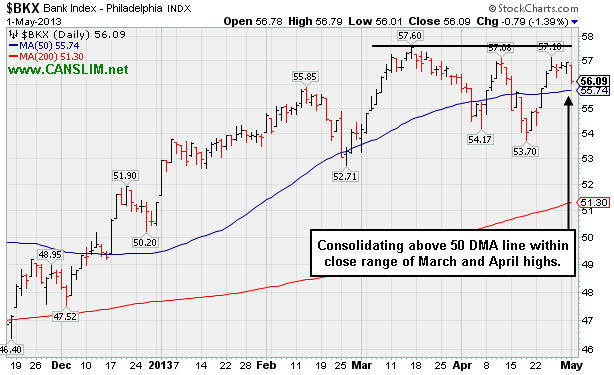
PICTURED: The Bank Index ($BKX -1.39%) is consolidating above its 50-day moving average (DMA) line within close range of its March and April highs.
| Oil Services |
$OSX |
246.90 |
-2.52 |
-1.01% |
+12.15% |
| Healthcare |
$HMO |
2,951.73 |
+3.97 |
+0.13% |
+17.40% |
| Integrated Oil |
$XOI |
1,344.53 |
-22.13 |
-1.62% |
+8.27% |
| Semiconductor |
$SOX |
440.80 |
-3.56 |
-0.80% |
+14.77% |
| Networking |
$NWX |
220.87 |
-4.54 |
-2.01% |
-2.51% |
| Internet |
$IIX |
359.12 |
-4.15 |
-1.14% |
+9.82% |
| Broker/Dealer |
$XBD |
110.33 |
-2.54 |
-2.25% |
+16.97% |
| Retail |
$RLX |
741.55 |
-6.48 |
-0.87% |
+13.55% |
| Gold & Silver |
$XAU |
107.26 |
-2.10 |
-1.92% |
-35.23% |
| Bank |
$BKX |
56.09 |
-0.79 |
-1.39% |
+9.38% |
| Biotech |
$BTK |
1,892.82 |
-38.75 |
-2.01% |
+22.35% |
|
|
|
 |
Volume-Driven Gap Up Gain Triggered Technical Buy Signal
Kenneth J. Gruneisen - Passed the CAN SLIM® Master's Exam
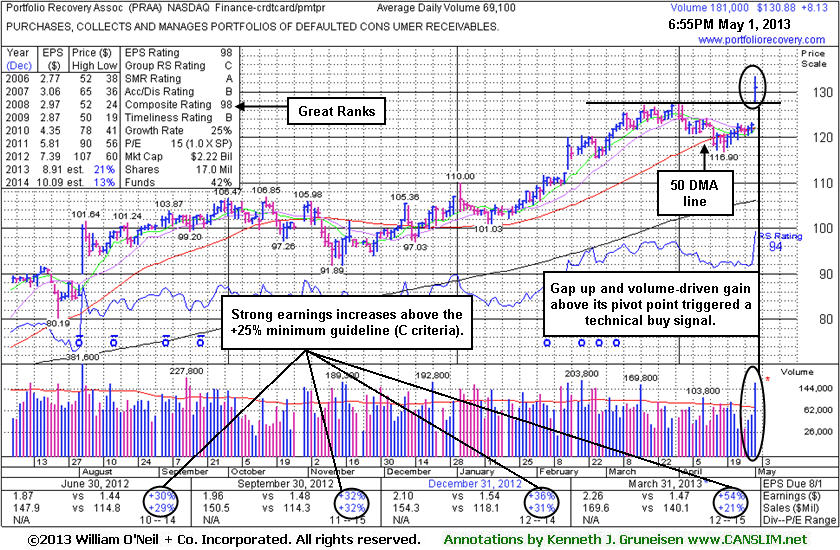
Often, when a leading stock is setting up to breakout of a solid base it is highlighted in CANSLIM.net's Mid-Day Breakouts Report. The most relevant factors are noted in the report which alerts prudent CANSLIM oriented investors to place the issue in their watch list. After doing any necessary backup research, the investor is prepared to act after the stock triggers a technical buy signal (breaks above its pivot point on more than +50% average turnover) but before it gets too extended from a sound base. In the event the stock fails to trigger a technical buy signal and its price declines then it will simply be removed from the watch list. Disciplined investors know to buy as near as possible to the pivot point and avoid chasing stocks after they have rallied more than +5% above their pivot point. It is crucial to always limit losses whenever any stock heads the wrong direction, and disciplined investors sell if a struggling stock ever falls more than -7% from their purchase price.
Portfolio Recovery Assoc (PRAA +$8.13 or +6.62% to $130.88) finished in the upper half of its intra-day range today after highlighted in yellow with new pivot point cited based on its 3/28/13 high plus 10 cents in today's earlier mid-day report (read here). It hit a new 52-week high after a "breakaway gap" and the considerable gain was backed by +127% above average volume clinching a technical buy signal. The high-ranked leader from the Finance - Credit Card/Payment Processing industry group reported earnings +54% on +21% sales revenues for the Mar '13 quarter. It held its ground near its 50-day moving average (DMA) line during the latest consolidation from new highs hit since last noted with caution in the 2/20/13 mid-day report - "No overhead supply remains to act as resistance. Reported earnings +36% on +31% sales revenues for the Dec '12 quarter. The number of top-rated funds owning its shares rose from 302 in Mar '12 to 361 in Dec '12, a reassuring sign concerning the I criteria. Its Mar '12 results marked its only comparison with an earnings increase below the +25% minimum guideline in more than 2 years. Previously noted downturn in FY '08 and FY '09 earnings (A criteria) is a flaw in its annual earnings history." As of Mar '13 the number of top-rated funds owning its shares rose to 370, more reassuring news concerning the I criteria.
It undercut its 200 DMA line during a deep consolidation during the 2007-09 Bear Market period yet survived and then rebounded and rallied into new high territory in recent years since dropped from then Featured Stocks list on 8/26/05. Its last appearance in this FSU section was on 7/27/05 with an annotated graph under the headline, "Leader Sells Off On Earnings News, Closes in Upper Half of Range". Remember, stocks that are dropped from the Featured Stocks list can return again later if strength returns and fundamentals remain strong with respect to the fact-based investment system's guideline.
|
|
|
Color Codes Explained :
Y - Better candidates highlighted by our
staff of experts.
G - Previously featured
in past reports as yellow but may no longer be buyable under the
guidelines.
***Last / Change / Volume data in this table is the closing quote data***
Symbol/Exchange
Company Name
Industry Group |
PRICE |
CHANGE
(%Change) |
Day High |
Volume
(% DAV)
(% 50 day avg vol) |
52 Wk Hi
% From Hi |
Featured
Date |
Price
Featured |
Pivot Featured |
|
Max Buy |
CELG
-
NASDAQ
Celgene Corp
DRUGS - Drug Manufacturers - Major
|
$116.66
|
-1.41
-1.19% |
$118.76
|
3,067,758
93.38% of 50 DAV
50 DAV is 3,285,200
|
$128.52
-9.23%
|
3/27/2013
|
$113.24
|
PP = $115.54
|
|
MB = $121.32
|
Most Recent Note - 4/30/2013 6:07:42 PM
G - Enduring more distributional pressure yet still stubbornly holding its ground only -8.1% off its high. It is extended from any sound base. Its 50 DMA line ($113 now) defines important near-term support to watch.
>>> The latest Featured Stock Update with an annotated graph appeared on 4/19/2013. Click here.
View all notes |
Alert me of new notes |
CANSLIM.net Company Profile |
SEC |
Zacks Reports |
StockTalk |
News |
Chart |
Request a new note
C
A N
S L
I M


|
CMCSA
-
NASDAQ
Comcast Corp Cl A
MEDIA - CATV Systems
|
$41.86
|
+0.56
1.36% |
$42.47
|
13,410,201
104.44% of 50 DAV
50 DAV is 12,840,700
|
$42.61
-1.76%
|
12/3/2012
|
$37.08
|
PP = $38.06
|
|
MB = $39.96
|
Most Recent Note - 4/26/2013 4:28:11 PM
G - Rebounded above its 50 DMA line with higher volume behind its gain, helping its technical stance improve. Fundamental concerns were repeatedly noted after sub par earnings results for the Dec '12 quarter.
>>> The latest Featured Stock Update with an annotated graph appeared on 4/16/2013. Click here.
View all notes |
Alert me of new notes |
CANSLIM.net Company Profile |
SEC |
Zacks Reports |
StockTalk |
News |
Chart |
Request a new note
C
A N
S L
I M
|
EMN
-
NYSE
Eastman Chemical Co
CHEMICALS - Chemicals - Major Diversified
|
$64.06
|
-2.59
-3.89% |
$66.26
|
4,598,527
271.91% of 50 DAV
50 DAV is 1,691,200
|
$75.18
-14.79%
|
4/26/2013
|
$69.57
|
PP = $73.83
|
|
MB = $77.52
|
 Most Recent Note - 5/1/2013 7:32:14 PM
Gapped down today and its 4th consecutive loss was backed by heavier above average volume indicating more worrisome distributional pressure. Did not trigger a technical buy signal from the "double bottom" base pattern previously noted. May find support at its 200 DMA line, but due to damaging action it is -14.8% off its 52-week high and it will be dropped from the Featured Stocks list tonight.
>>> The latest Featured Stock Update with an annotated graph appeared on 4/26/2013. Click here.
View all notes |
Alert me of new notes |
CANSLIM.net Company Profile |
SEC |
Zacks Reports |
StockTalk |
News |
Chart |
Request a new note
C
A N
S L
I M
|
EQM
-
NYSE
E Q T Midstream Partners
ENERGY - Oil and Gas Pipelines
|
$45.92
|
-0.38
-0.82% |
$46.97
|
247,870
338.16% of 50 DAV
50 DAV is 73,300
|
$47.22
-2.75%
|
4/25/2013
|
$40.16
|
PP = $40.84
|
|
MB = $42.88
|
Most Recent Note - 5/1/2013 7:27:38 PM
G - Loss today with above average volume broke a streak of 7 consecutive gains for new highs. Prior highs in the $40 area define initial support to watch above its 50 DMA line on pullbacks.
>>> The latest Featured Stock Update with an annotated graph appeared on 4/25/2013. Click here.
View all notes |
Alert me of new notes |
CANSLIM.net Company Profile |
SEC |
Zacks Reports |
StockTalk |
News |
Chart |
Request a new note
C
A N
S L
I M
|
FLT
-
NYSE
Fleetcor Technologies
DIVERSIFIED SERVICES - Business/Management Services
|
$74.90
|
-2.00
-2.60% |
$77.00
|
715,655
88.63% of 50 DAV
50 DAV is 807,500
|
$78.87
-5.03%
|
3/21/2013
|
$71.14
|
PP = $73.00
|
|
MB = $76.65
|
Most Recent Note - 4/30/2013 6:10:16 PM
G - Posted a gain with above average volume, trading within close striking distance of its 52-week high. Color code was changed to green after it finished above its "max buy" level. More damaging losses below the 50 DMA line or recent low ($70.09) would raise more serious concerns and trigger a worrisome technical sell signal.
>>> The latest Featured Stock Update with an annotated graph appeared on 4/15/2013. Click here.
View all notes |
Alert me of new notes |
CANSLIM.net Company Profile |
SEC |
Zacks Reports |
StockTalk |
News |
Chart |
Request a new note
C
A N
S L
I M
|
Symbol/Exchange
Company Name
Industry Group |
PRICE |
CHANGE
(%Change) |
Day High |
Volume
(% DAV)
(% 50 day avg vol) |
52 Wk Hi
% From Hi |
Featured
Date |
Price
Featured |
Pivot Featured |
|
Max Buy |
LNKD
-
NYSE
Linkedin Corp Class A
INTERNET - Internet Information Providers
|
$194.82
|
+2.73
1.42% |
$195.50
|
2,638,751
128.59% of 50 DAV
50 DAV is 2,052,000
|
$193.37
0.75%
|
4/12/2013
|
$182.69
|
PP = $184.25
|
|
MB = $193.46
|
Most Recent Note - 4/30/2013 5:58:23 PM
Y - Hit another new 52-week high today with near average volume behind its gain. Recent gains lacked the necessary volume conviction to trigger a proper new (or add-on) technical buy signal. Its 50 DMA line and recent low define important near-term chart support to watch. See the latest FSU analysis for more details and a new annotated graph.
>>> The latest Featured Stock Update with an annotated graph appeared on 4/29/2013. Click here.
View all notes |
Alert me of new notes |
CANSLIM.net Company Profile |
SEC |
Zacks Reports |
StockTalk |
News |
Chart |
Request a new note
C
A N
S L
I M
|
MRLN
-
NASDAQ
Marlin Business Services
DIVERSIFIED SERVICES - Rental and Leasing Services
|
$23.93
|
-0.30
-1.24% |
$24.95
|
28,806
109.11% of 50 DAV
50 DAV is 26,400
|
$24.93
-4.01%
|
3/15/2013
|
$22.29
|
PP = $23.18
|
|
MB = $24.34
|
Most Recent Note - 4/30/2013 5:59:58 PM
Y - Finished 2 cents below its best close of 2013 with today's gain backed by only +20% above average volume. Action has not been indicative of great new institutional buying demand, yet no resistance remains due to overhead supply.
>>> The latest Featured Stock Update with an annotated graph appeared on 4/9/2013. Click here.
View all notes |
Alert me of new notes |
CANSLIM.net Company Profile |
SEC |
Zacks Reports |
StockTalk |
News |
Chart |
Request a new note
C
A N
S L
I M
|
N
-
NYSE
Netsuite Inc
DIVERSIFIED SERVICES - Business/Management Services
|
$87.78
|
-0.18
-0.20% |
$88.65
|
500,010
133.98% of 50 DAV
50 DAV is 373,200
|
$89.19
-1.58%
|
12/12/2012
|
$64.75
|
PP = $67.12
|
|
MB = $70.48
|
Most Recent Note - 4/29/2013 12:22:08 PM
G - Reported earnings -33% on +32% sales revenues for the Mar '13 quarter, marking a 2nd consecutive quarterly comparison with earnings below the +25% minimum guideline (C criteria). Despite fundamental concerns raised it is rallying for another new all-time high with today's 5th consecutive gain. Its 50 DMA line defines important near-term support to watch.
>>> The latest Featured Stock Update with an annotated graph appeared on 4/22/2013. Click here.
View all notes |
Alert me of new notes |
CANSLIM.net Company Profile |
SEC |
Zacks Reports |
StockTalk |
News |
Chart |
Request a new note
C
A N
S L
I M
|
PRAA
-
NASDAQ
Portfolio Recovery Assoc
DIVERSIFIED SERVICES - Business/Management Services
|
$130.88
|
+8.13
6.62% |
$133.50
|
188,141
272.27% of 50 DAV
50 DAV is 69,100
|
$127.78
2.43%
|
11/15/2004
|
$130.77
|
PP = $127.88
|
|
MB = $134.27
|
Most Recent Note - 5/1/2013 7:26:02 PM
Y - Finished in the upper half of its intra-day range after highlighted in yellow in the earlier mid-day report (read here) with new pivot point cited based on its 3/28/13 high plus 10 cents. Hit a new 52-week high after a "breakaway gap" today triggered a technical buy signal with +172% above average volume. Reported earnings +54% on +21% sales revenues for the Mar '13 quarter. See the latest FSU analysis for more details and a new annotated graph.
>>> The latest Featured Stock Update with an annotated graph appeared on 5/1/2013. Click here.
View all notes |
Alert me of new notes |
CANSLIM.net Company Profile |
SEC |
Zacks Reports |
StockTalk |
News |
Chart |
Request a new note
C
A N
S L
I M
|
RRTS
-
NYSE
Roadrunner Trans Systems
TRANSPORTATION - Air Delivery and Freight Service
|
$22.29
|
-0.22
-0.98% |
$22.57
|
173,563
100.21% of 50 DAV
50 DAV is 173,200
|
$23.88
-6.66%
|
4/3/2013
|
$22.77
|
PP = $23.75
|
|
MB = $24.94
|
Most Recent Note - 4/30/2013 6:05:45 PM
G - Holding its ground stubbornly but still lingering below its 50 DMA line after failing to trigger a new buy signal since featured on 4/03/13. A rebound above that important short-term average would help its outlook improve.
>>> The latest Featured Stock Update with an annotated graph appeared on 4/23/2013. Click here.
View all notes |
Alert me of new notes |
CANSLIM.net Company Profile |
SEC |
Zacks Reports |
StockTalk |
News |
Chart |
Request a new note
C
A N
S L
I M
|
Symbol/Exchange
Company Name
Industry Group |
PRICE |
CHANGE
(%Change) |
Day High |
Volume
(% DAV)
(% 50 day avg vol) |
52 Wk Hi
% From Hi |
Featured
Date |
Price
Featured |
Pivot Featured |
|
Max Buy |
VRX
-
NYSE
Valeant Pharmaceuticals
DRUGS - Drug Manufacturers - Other
|
$73.69
|
-2.39
-3.14% |
$76.31
|
1,638,794
114.42% of 50 DAV
50 DAV is 1,432,200
|
$76.57
-3.76%
|
4/30/2013
|
$60.24
|
PP = $76.66
|
|
MB = $80.49
|
Most Recent Note - 4/30/2013 6:14:09 PM
Y- Gapped up on the prior session and tallied a volume-driven gain. It has formed a short square box base and the color code was changed to yellow with new pivot point cited based on its 4/02/13 high plus 10 cents. A volume-driven gain above its pivot point may trigger a new (or add-on) technical buy signal. Its 50 DMA line defines near-term support above recent the recent low ($69.87 on 4/04/13) where violations may trigger technical sell signals. Due to report earnings before the open on Thursday, May 2nd, and volume and volatility often increase near earnings news. See the latest FSU analysis for more details and a new annotated graph.
>>> The latest Featured Stock Update with an annotated graph appeared on 4/30/2013. Click here.
View all notes |
Alert me of new notes |
CANSLIM.net Company Profile |
SEC |
Zacks Reports |
StockTalk |
News |
Chart |
Request a new note
C
A N
S L
I M
|
|
|
|
THESE ARE NOT BUY RECOMMENDATIONS!
Comments contained in the body of this report are technical
opinions only. The material herein has been obtained
from sources believed to be reliable and accurate, however,
its accuracy and completeness cannot be guaranteed.
This site is not an investment advisor, hence it does
not endorse or recommend any securities or other investments.
Any recommendation contained in this report may not
be suitable for all investors and it is not to be deemed
an offer or solicitation on our part with respect to
the purchase or sale of any securities. All trademarks,
service marks and trade names appearing in this report
are the property of their respective owners, and are
likewise used for identification purposes only.
This report is a service available
only to active Paid Premium Members.
You may opt-out of receiving report notifications
at any time. Questions or comments may be submitted
by writing to Premium Membership Services 665 S.E. 10 Street, Suite 201 Deerfield Beach, FL 33441-5634 or by calling 1-800-965-8307
or 954-785-1121.
|
|
|

