You are not logged in.
This means you
CAN ONLY VIEW reports that were published prior to Wednesday, April 9, 2025.
You
MUST UPGRADE YOUR MEMBERSHIP if you want to see any current reports.
AFTER MARKET UPDATE - FRIDAY, MAY 3RD, 2013
Previous After Market Report Next After Market Report >>>
|
|
|
|
DOW |
+142.38 |
14,973.96 |
+0.96% |
|
Volume |
716,417,030 |
+6% |
|
Volume |
1,688,311,410 |
-1% |
|
NASDAQ |
+38.01 |
3,378.63 |
+1.14% |
|
Advancers |
2,204 |
71% |
|
Advancers |
1,830 |
71% |
|
S&P 500 |
+16.83 |
1,614.42 |
+1.05% |
|
Decliners |
807 |
26% |
|
Decliners |
649 |
25% |
|
Russell 2000 |
+14.57 |
954.42 |
+1.55% |
|
52 Wk Highs |
483 |
|
|
52 Wk Highs |
288 |
|
|
S&P 600 |
+9.01 |
535.24 |
+1.71% |
|
52 Wk Lows |
12 |
|
|
52 Wk Lows |
22 |
|
|
 |
Dow and S&P 500 Index Both Rally for New Record Highs
Kenneth J. Gruneisen - Passed the CAN SLIM® Master's Exam
For the week, the Dow gained +1.8%, the S&P 500 rose +2% and the Nasdaq Composite experienced its best week since January as it increased +3%. The major averages finished Friday's session in record territory. The volume totals were reported mixed, higher than the prior session totals on the NYSE and lower on the Nasdaq exchange. Breadth was positive as advancers led decliners by nearly 3-1 on the NYSE and on the Nasdaq exchange. There were 117 high-ranked companies from the CANSLIM.net Leaders List making new 52-week highs and appearing on the CANSLIM.net BreakOuts Page, more than doubling the prior session total of 49 stocks. New 52-week highs totals expanded and solidly outnumbered new 52-week lows on both the NYSE and the Nasdaq exchange. There were gains for 10 of the 11 high-ranked companies currently included on the Featured Stocks Page.
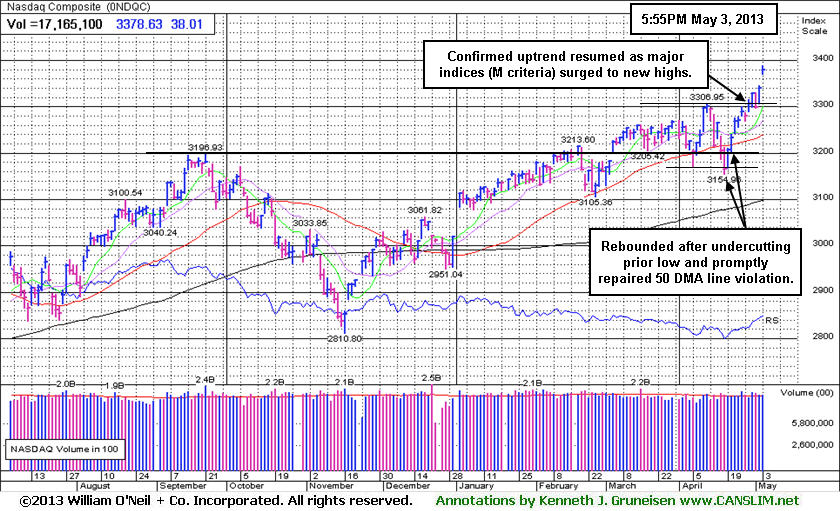
The Dow was up 142 points to 14,973 and the S&P 500 Index gained over 16 points to 1,614 with both indices closing at new all-time highs. The NASDAQ rose to nearly a twelve and a half year high as it advanced 38 points to 3,378.
More signs of an improving labor market prompted Friday's rally. The unemployment rate fell to the lowest level since December 2008 and hiring picked up more than expected as nonfarm payrolls jumped by 165,000 in April. This helped investors dismiss the biggest decline in factory orders in seven months and the weakest growth in the services sector since July 2012.
Eight of 10 S&P 500 sectors gained ground. Materials and Energy stocks helped lead the advance as commodities rallied, which pushed Freeport-McMoRan (FCX +2.8%) and Schlumberger (SLB +2.1%) higher. The more defensive groups of Utilities and Telecommunications gave up minor ground as Duke Energy (DUK -0.5%) and AT&T (T -0.7%) fell.
In fixed-income, Treasuries dropped. The 10-year note fell a full point to yield 1.74% and the 30-year bond nearly lost three full points to yield 2.96%.
The market (M criteria) saw an expansion in leadership (stocks hitting new 52-week highs) that helps reassure investors that a confirmed uptrend is at hand. Watch for new stocks featured in the CANSLIM.net Mid-Day BreakOuts Report. Action-worthy leaders are covered on an ongoing basis with the latest notes and additional resource links included on the Featured Stocks Page. Watch for an announcement via email concerning the next WEBCAST. The webcast will also be available via an updated link highlighted at the top of the Premium Member Homepage.
PICTURED: The Nasdaq Composite index has an +11.9% gain year-to-date. It rebounded after undercutting the prior low and then promptly repaired its 50-day moving average (DMA) line violation. The indices' rally to new highs confirmed the market's uptrend which means odds are favorable for new buying efforts in stocks meeting all of the fact-based investment system's key criteria.
|
 Kenneth J. Gruneisen started out as a licensed stockbroker in August 1987, a couple of months prior to the historic stock market crash that took the Dow Jones Industrial Average down -22.6% in a single day. He has published daily fact-based fundamental and technical analysis on high-ranked stocks online for two decades. Through FACTBASEDINVESTING.COM, Kenneth provides educational articles, news, market commentary, and other information regarding proven investment systems that work in good times and bad.
Comments contained in the body of this report are technical opinions only and are not necessarily those of Gruneisen Growth Corp. The material herein has been obtained from sources believed to be reliable and accurate, however, its accuracy and completeness cannot be guaranteed. Our firm, employees, and customers may effect transactions, including transactions contrary to any recommendation herein, or have positions in the securities mentioned herein or options with respect thereto. Any recommendation contained in this report may not be suitable for all investors and it is not to be deemed an offer or solicitation on our part with respect to the purchase or sale of any securities. |
|
 |
Financial, Retail, Tech, and Energy-Related Groups Led Rally
Kenneth J. Gruneisen - Passed the CAN SLIM® Master's Exam
Financial stocks provided influential backbone for the market's solid rally as the Broker/Dealer Index ($XBD +2.44%) outpaced the Bank Index ($BKX +0.89%). The Retail Index ($RLX +1.51%) was a positive influence on the major averages, and the tech sector saw unanimous gains from the Semiconductor Index ($SOX +0.90%), Biotechnology Index ($BTK +1.34%), Networking Index ($NWX +1.47%), and the Internet Index ($IIX +1.62%). Energy-related shares also had a positive bias as the Integrated Oil Index ($XOI +1.73%) and Oil Services Index ($OSX +2.05%) surged higher. The defensive groups were of little interest to traders as the Healthcare Index ($HMO -0.22%) lagged with a small loss and the Gold & Silver Index ($XAU +0.49%) eked out a small gain.
Charts courtesy www.stockcharts.com
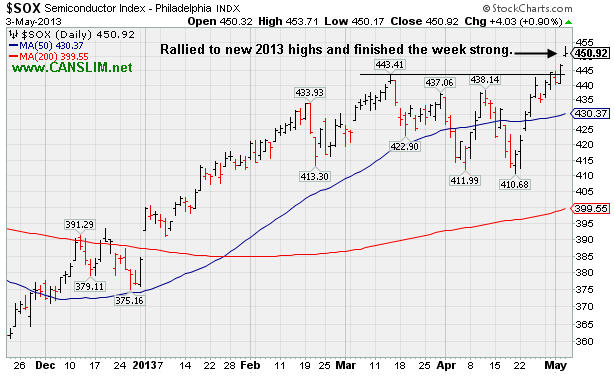
PICTURED: The Semiconductor Index ($SOX +0.90%) rallied to new 2013 highs and finished the week strong. The strength from the tech sector is a very encouraging sign for growth-oriented investors going forward. Its year-to-date gain of about +17% is more impressive than the tech-heavy Nasdaq Composite Index's +11.9% gain. Meanwhile, defensively positioned investors who own a "safe-haven" portfolio of gold and silver mining companies like the Gold & Silver Index have a -35% year-to-date loss.
| Oil Services |
$OSX |
255.87 |
+5.13 |
+2.05% |
+16.22% |
| Healthcare |
$HMO |
2,977.61 |
-6.58 |
-0.22% |
+18.43% |
| Integrated Oil |
$XOI |
1,386.84 |
+23.62 |
+1.73% |
+11.68% |
| Semiconductor |
$SOX |
450.92 |
+4.03 |
+0.90% |
+17.41% |
| Networking |
$NWX |
225.35 |
+3.26 |
+1.47% |
-0.53% |
| Internet |
$IIX |
369.26 |
+5.87 |
+1.62% |
+12.92% |
| Broker/Dealer |
$XBD |
116.20 |
+2.77 |
+2.44% |
+23.18% |
| Retail |
$RLX |
759.75 |
+11.27 |
+1.51% |
+16.34% |
| Gold & Silver |
$XAU |
107.67 |
+0.52 |
+0.49% |
-34.98% |
| Bank |
$BKX |
56.94 |
+0.50 |
+0.89% |
+11.04% |
| Biotech |
$BTK |
1,949.39 |
+25.70 |
+1.34% |
+26.01% |
|
|
|
 |
Volume +47% Above Average Behind Gain for New Highs
Kenneth J. Gruneisen - Passed the CAN SLIM® Master's Exam
Often, when a leading stock is setting up to breakout of a solid base it is highlighted in CANSLIM.net's Mid-Day Breakouts Report. The most relevant factors are noted in the report which alerts prudent CANSLIM oriented investors to place the issue in their watch list. After doing any necessary backup research, the investor is prepared to act after the stock triggers a technical buy signal (breaks above its pivot point on more than +50% average turnover) but before it gets too extended from a sound base. In the event the stock fails to trigger a technical buy signal and its price declines then it will simply be removed from the watch list. Disciplined investors know to buy as near as possible to the pivot point and avoid chasing stocks after they have rallied more than +5% above their pivot point. It is crucial to always limit losses whenever any stock heads the wrong direction, and disciplined investors sell if a struggling stock ever falls more than -7% from their purchase price.
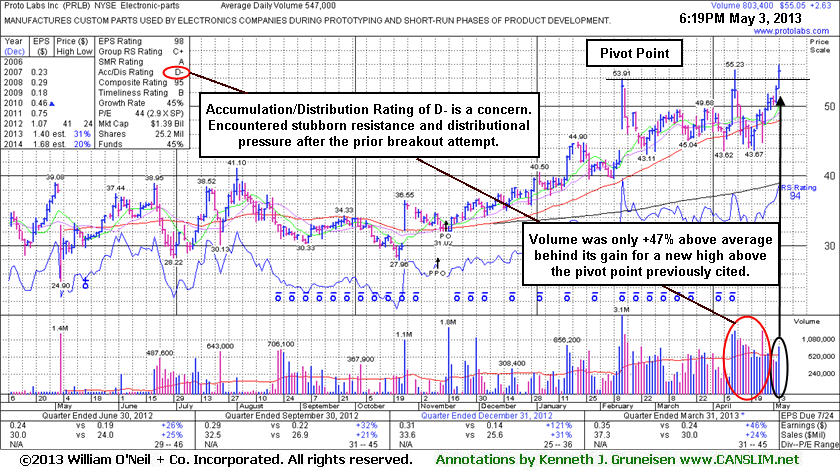
Proto Labs Inc (PRLB +$2.63 or +5.02% to $55.05 ) was highlighted in yellow in the earlier mid-day report (read here) and it returned to the Featured Stocks list with the previously cited pivot point still considered a very important threshold. It hit a new 52-week high today and posted a solid gain backed by +47% above average volume. That was sufficient to clinch a technical buy signal. It recently reported earnings +46% on +24% sales revenues for the Mar '13 quarter, continuing its strong growth trend satisfying the C criteria. The high-ranked Electronic - Parts firm found prompt support near its 50-day moving average (DMA) line after undercutting that important short-term average when dropped from the Featured Stocks list back on 4/18/13. Volume was light or average behind gains as it rebounded.
The number of top-rated funds owning its shares rose from 131 in Jun '12 to 204 in Mar '13, a reassuring trend concerning the I criteria. Its small supply of only 18.9 million shares (S criteria) in the publicly traded float is ideal, yet it can contribute to greater price volatility in the event of institutional buying or selling. Its Accumulation/ Distribution Rating of D- is a concern after losses with above average volume following its earlier breakout attempt which failed.
Longtime readers may recall a change in recent years where the bare minimum volume threshold for fans of the fact-based investment system was lowered to +40% above average from +50% above average. With that in mind, while Friday's session for PRLB may have been above the +40% threshold, however the market's biggest winners often vaulted above their pivot points with very heavy volume totals that were several times that of a typical trading session. In this case, additional volume-driven gains could provide an encouraging reassurance that serious institutional buying demand is lurking and can lead to a substantial and sustained advance in price.
|
|
|
Color Codes Explained :
Y - Better candidates highlighted by our
staff of experts.
G - Previously featured
in past reports as yellow but may no longer be buyable under the
guidelines.
***Last / Change / Volume data in this table is the closing quote data***
Symbol/Exchange
Company Name
Industry Group |
PRICE |
CHANGE
(%Change) |
Day High |
Volume
(% DAV)
(% 50 day avg vol) |
52 Wk Hi
% From Hi |
Featured
Date |
Price
Featured |
Pivot Featured |
|
Max Buy |
CELG
-
NASDAQ
Celgene Corp
DRUGS - Drug Manufacturers - Major
|
$121.64
|
+2.38
2.00% |
$121.90
|
2,883,267
88.90% of 50 DAV
50 DAV is 3,243,400
|
$128.52
-5.35%
|
3/27/2013
|
$113.24
|
PP = $115.54
|
|
MB = $121.32
|
Most Recent Note - 4/30/2013 6:07:42 PM
G - Enduring more distributional pressure yet still stubbornly holding its ground only -8.1% off its high. It is extended from any sound base. Its 50 DMA line ($113 now) defines important near-term support to watch.
>>> The latest Featured Stock Update with an annotated graph appeared on 4/19/2013. Click here.
View all notes |
Alert me of new notes |
CANSLIM.net Company Profile |
SEC |
Zacks Reports |
StockTalk |
News |
Chart |
Request a new note
C
A N
S L
I M


|
CMCSA
-
NASDAQ
Comcast Corp Cl A
MEDIA - CATV Systems
|
$42.54
|
+0.43
1.02% |
$42.75
|
7,773,245
61.64% of 50 DAV
50 DAV is 12,610,000
|
$42.61
-0.16%
|
12/3/2012
|
$37.08
|
PP = $38.06
|
|
MB = $39.96
|
Most Recent Note - 4/26/2013 4:28:11 PM
G - Rebounded above its 50 DMA line with higher volume behind its gain, helping its technical stance improve. Fundamental concerns were repeatedly noted after sub par earnings results for the Dec '12 quarter.
>>> The latest Featured Stock Update with an annotated graph appeared on 4/16/2013. Click here.
View all notes |
Alert me of new notes |
CANSLIM.net Company Profile |
SEC |
Zacks Reports |
StockTalk |
News |
Chart |
Request a new note
C
A N
S L
I M
|
EQM
-
NYSE
E Q T Midstream Partners
ENERGY - Oil and Gas Pipelines
|
$46.38
|
+0.69
1.51% |
$46.53
|
58,763
74.29% of 50 DAV
50 DAV is 79,100
|
$47.22
-1.78%
|
4/25/2013
|
$40.16
|
PP = $40.84
|
|
MB = $42.88
|
Most Recent Note - 5/2/2013 12:32:07 PM
G - Holding its ground near its 52-week high following an impressive streak of 7 consecutive gains. Prior highs in the $40 area define initial support to watch above its 50 DMA line on pullbacks.
>>> The latest Featured Stock Update with an annotated graph appeared on 4/25/2013. Click here.
View all notes |
Alert me of new notes |
CANSLIM.net Company Profile |
SEC |
Zacks Reports |
StockTalk |
News |
Chart |
Request a new note
C
A N
S L
I M
|
FLT
-
NYSE
Fleetcor Technologies
DIVERSIFIED SERVICES - Business/Management Services
|
$80.34
|
+3.14
4.07% |
$85.56
|
2,129,196
259.03% of 50 DAV
50 DAV is 822,000
|
$78.87
1.86%
|
3/21/2013
|
$71.14
|
PP = $73.00
|
|
MB = $76.65
|
 Most Recent Note - 5/3/2013 12:24:34 PM
G - Gapped up today and hit a new high, getting more extended from any sound base pattern. Its 50 DMA line and recent low ($70.09) define near-term support where violations would raise more serious concerns and trigger worrisome technical sell signals.
>>> The latest Featured Stock Update with an annotated graph appeared on 4/15/2013. Click here.
View all notes |
Alert me of new notes |
CANSLIM.net Company Profile |
SEC |
Zacks Reports |
StockTalk |
News |
Chart |
Request a new note
C
A N
S L
I M
|
LNKD
-
NYSE
Linkedin Corp Class A
INTERNET - Internet Information Providers
|
$175.59
|
-26.08
-12.93% |
$187.75
|
11,624,611
547.07% of 50 DAV
50 DAV is 2,124,900
|
$202.91
-13.46%
|
4/12/2013
|
$182.69
|
PP = $184.25
|
|
MB = $193.46
|
Most Recent Note - 5/3/2013 11:09:05 AM
G - Reported earnings +200% on +72% sales revenues for the Mar '13 quarter. Gapped down today, abruptly retreating from its 52-week high. Prior highs in the $184 area define near-term chart support above its 50 DMA line.
>>> The latest Featured Stock Update with an annotated graph appeared on 4/29/2013. Click here.
View all notes |
Alert me of new notes |
CANSLIM.net Company Profile |
SEC |
Zacks Reports |
StockTalk |
News |
Chart |
Request a new note
C
A N
S L
I M
|
Symbol/Exchange
Company Name
Industry Group |
PRICE |
CHANGE
(%Change) |
Day High |
Volume
(% DAV)
(% 50 day avg vol) |
52 Wk Hi
% From Hi |
Featured
Date |
Price
Featured |
Pivot Featured |
|
Max Buy |
MRLN
-
NASDAQ
Marlin Business Services
DIVERSIFIED SERVICES - Rental and Leasing Services
|
$25.33
|
+0.63
2.55% |
$25.97
|
13,822
51.96% of 50 DAV
50 DAV is 26,600
|
$25.00
1.31%
|
3/15/2013
|
$22.29
|
PP = $23.18
|
|
MB = $24.34
|
Most Recent Note - 5/3/2013 6:21:47 PM
G - Gapped up and wedged further above its "max buy" level with today's gain on much lighter than average volume. Prior highs in the $23 area define support to watch on pullbacks.
>>> The latest Featured Stock Update with an annotated graph appeared on 5/2/2013. Click here.
View all notes |
Alert me of new notes |
CANSLIM.net Company Profile |
SEC |
Zacks Reports |
StockTalk |
News |
Chart |
Request a new note
C
A N
S L
I M
|
N
-
NYSE
Netsuite Inc
DIVERSIFIED SERVICES - Business/Management Services
|
$89.77
|
+1.01
1.14% |
$91.02
|
324,928
87.21% of 50 DAV
50 DAV is 372,600
|
$89.19
0.65%
|
12/12/2012
|
$64.75
|
PP = $67.12
|
|
MB = $70.48
|
Most Recent Note - 5/3/2013 6:22:48 PM
G - Hit another new all-time high with today's gain. Its 50 DMA line defines important near-term support to watch. Reported earnings -33% on +32% sales revenues for the Mar '13 quarter, marking a 2nd consecutive quarterly comparison with earnings below the +25% minimum guideline (C criteria).
>>> The latest Featured Stock Update with an annotated graph appeared on 4/22/2013. Click here.
View all notes |
Alert me of new notes |
CANSLIM.net Company Profile |
SEC |
Zacks Reports |
StockTalk |
News |
Chart |
Request a new note
C
A N
S L
I M
|
PRAA
-
NASDAQ
Portfolio Recovery Assoc
DIVERSIFIED SERVICES - Business/Management Services
|
$138.97
|
+2.23
1.63% |
$140.98
|
121,175
174.35% of 50 DAV
50 DAV is 69,500
|
$138.20
0.56%
|
11/15/2004
|
$130.77
|
PP = $127.88
|
|
MB = $134.27
|
Most Recent Note - 5/3/2013 6:25:05 PM
G - Spiked further into new high territory while adding to its streak of volume-driven gains including the previously noted "breakaway gap". It is extended from any sound base and prior highs near $127 define near-term support to watch on pullbacks. Reported earnings +54% on +21% sales revenues for the Mar '13 quarter.
>>> The latest Featured Stock Update with an annotated graph appeared on 5/1/2013. Click here.
View all notes |
Alert me of new notes |
CANSLIM.net Company Profile |
SEC |
Zacks Reports |
StockTalk |
News |
Chart |
Request a new note
C
A N
S L
I M
|
PRLB
-
NYSE
Proto Labs Inc
MANUFACTURING - Small Tools and Accessories
|
$55.05
|
+2.63
5.02% |
$55.93
|
803,659
146.92% of 50 DAV
50 DAV is 547,000
|
$55.23
-0.33%
|
5/3/2013
|
$54.77
|
PP = $54.01
|
|
MB = $56.71
|
Most Recent Note - 5/3/2013 6:56:01 PM
Y - Highlighted in yellow in the earlier mid-day report, it posted a gain above the previously cited pivot point backed by +47% above average volume while hitting a new 52-week high triggering a technical buy signal. Reported earnings +46% on +24% sales revenues for the Mar '13 quarter, continuing its strong growth trend satisfying the C criteria. See the latest FSU analysis for more details and a new annotated graph.
>>> The latest Featured Stock Update with an annotated graph appeared on 5/3/2013. Click here.
View all notes |
Alert me of new notes |
CANSLIM.net Company Profile |
SEC |
Zacks Reports |
StockTalk |
News |
Chart |
Request a new note
C
A N
S L
I M
|
RRTS
-
NYSE
Roadrunner Trans Systems
TRANSPORTATION - Air Delivery and Freight Service
|
$24.24
|
+1.60
7.07% |
$24.33
|
419,388
238.15% of 50 DAV
50 DAV is 176,100
|
$23.88
1.51%
|
4/3/2013
|
$22.77
|
PP = $23.75
|
|
MB = $24.94
|
Most Recent Note - 5/3/2013 6:19:14 PM
Y - Considerable volume-driven gains late in the session today helped it trigger a new technical buy signal. No new pivot point is cited yet its color code is changed to yellow as it rebounded above its 50 DMA line and quickly spiked to a new 52-week high with volume +138% above average.
>>> The latest Featured Stock Update with an annotated graph appeared on 4/23/2013. Click here.
View all notes |
Alert me of new notes |
CANSLIM.net Company Profile |
SEC |
Zacks Reports |
StockTalk |
News |
Chart |
Request a new note
C
A N
S L
I M
|
Symbol/Exchange
Company Name
Industry Group |
PRICE |
CHANGE
(%Change) |
Day High |
Volume
(% DAV)
(% 50 day avg vol) |
52 Wk Hi
% From Hi |
Featured
Date |
Price
Featured |
Pivot Featured |
|
Max Buy |
VRX
-
NYSE
Valeant Pharmaceuticals
DRUGS - Drug Manufacturers - Other
|
$73.68
|
+1.53
2.12% |
$73.75
|
1,226,972
83.70% of 50 DAV
50 DAV is 1,466,000
|
$76.57
-3.77%
|
4/30/2013
|
$60.24
|
PP = $76.66
|
|
MB = $80.49
|
Most Recent Note - 5/2/2013 7:07:15 PM
Y- Reported earnings +14% on +25% sales revenues for the quarter ended March 31, 2013 versus the year ago period, below the +25% minimum earnings guideline (C criteria) raising fundamental concerns. Finished near the session low and near its 50 DMA line defining important near-term support above the recent low ($69.87 on 4/04/13). Subsequent violations may trigger technical sell signals. See the latest FSU analysis for more details and an annotated graph.
>>> The latest Featured Stock Update with an annotated graph appeared on 4/30/2013. Click here.
View all notes |
Alert me of new notes |
CANSLIM.net Company Profile |
SEC |
Zacks Reports |
StockTalk |
News |
Chart |
Request a new note
C
A N
S L
I M
|
|
|
|
THESE ARE NOT BUY RECOMMENDATIONS!
Comments contained in the body of this report are technical
opinions only. The material herein has been obtained
from sources believed to be reliable and accurate, however,
its accuracy and completeness cannot be guaranteed.
This site is not an investment advisor, hence it does
not endorse or recommend any securities or other investments.
Any recommendation contained in this report may not
be suitable for all investors and it is not to be deemed
an offer or solicitation on our part with respect to
the purchase or sale of any securities. All trademarks,
service marks and trade names appearing in this report
are the property of their respective owners, and are
likewise used for identification purposes only.
This report is a service available
only to active Paid Premium Members.
You may opt-out of receiving report notifications
at any time. Questions or comments may be submitted
by writing to Premium Membership Services 665 S.E. 10 Street, Suite 201 Deerfield Beach, FL 33441-5634 or by calling 1-800-965-8307
or 954-785-1121.
|
|
|

