You are not logged in.
This means you
CAN ONLY VIEW reports that were published prior to Sunday, February 25, 2024.
You
MUST UPGRADE YOUR MEMBERSHIP if you want to see any current reports.
AFTER MARKET UPDATE - FRIDAY, MAY 1ST, 2020
Previous After Market Report Next After Market Report >>>
|
|
|
|
DOW |
-622.03 |
23,723.69 |
-2.55% |
|
Volume |
922,645,247 |
-39% |
|
Volume |
3,724,667,100 |
-13% |
|
NASDAQ |
-284.60 |
8,604.95 |
-3.20% |
|
Advancers |
434 |
15% |
|
Advancers |
576 |
18% |
|
S&P 500 |
-81.72 |
2,830.71 |
-2.81% |
|
Decliners |
2,464 |
85% |
|
Decliners |
2,652 |
82% |
|
Russell 2000 |
-50.18 |
1,260.48 |
-3.83% |
|
52 Wk Highs |
5 |
|
|
52 Wk Highs |
20 |
|
|
S&P 600 |
-31.09 |
740.02 |
-4.03% |
|
52 Wk Lows |
5 |
|
|
52 Wk Lows |
20 |
|
|
 |
Major Indices Face Pressure Amid Wave of Earnings Warnings
Kenneth J. Gruneisen - Passed the CAN SLIM® Master's Exam
The S&P 500 fell 2.8%, while the Dow lost 622 points, with both indexes finishing the week down 0.2%. The Nasdaq Composite slid 3.2%, bringing its weekly decline to 0.3%. Breadth was negative as decliners led advancers by more than a 5-1 margin on the NYSE and more than a 4-1 margin on the Nasdaq exchange. The reported volume totals were lighter than the prior session on the NYSE and on the Nasdaq exchange. There were only 2 high-ranked companies from the Leaders List that hit new 52-week highs and were listed on the BreakOuts Page, versus 14 on the prior session. New 52-week highs and new 52-week lows totals were evenly matched on the NYSE and on the Nasdaq exchange. The major indices are in a confirmed uptrend (M criteria). Any sustainable rally requires a healthy crop of new leaders, so waning leadership of late is becoming a concern. Charts used courtesy of www.stockcharts.com
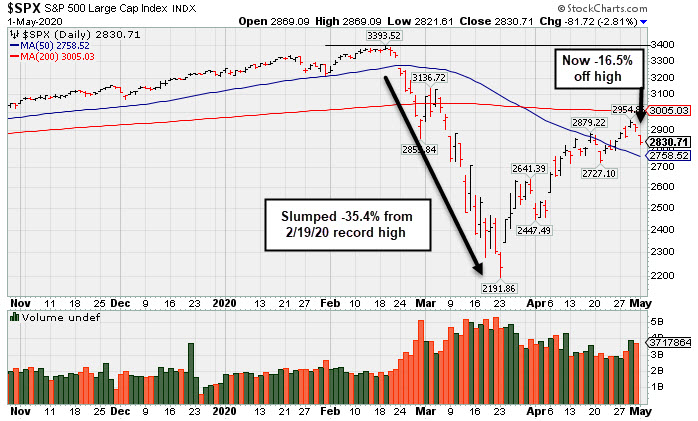
PICTURED: The S&P 500 Index slumped -35.4% from its 2/19/20 record high and has rebounded above its 50-day moving average (DMA) line to now sit -16.5% off its high.
Stocks finished lower on Friday, as profit warnings from key companies weighed on sentiment. All 11 S&P 500 sectors closed in negative territory. The Energy group led decliners with Exxon Mobil (XOM -7.17%) fell after posting its first quarterly loss in over 30 years. The Consumer Discretionary sector also underperformed, with Amazon (AMZN -7.60%) retreated from its new all-time high after missing Wall Street earnings estimates and warning that costs associated with the coronavirus outbreak could completely erase its second-quarter profits. In other earnings, Apple (AAPL -1.61%) fell after failing to provide current-quarter guidance for the first time since 2003. Meanwhile, Clorox (CLX +3.36%) rose after reporting its largest jump in sales in nearly a decade. Gilead Sciences (GILD -4.82%) delivered a top and bottom line beat, but shares still declined even after President Trump announced that its experimental drug earned emergency authorization from the FDA to treat COVID-19.
Renewed tensions between the U.S. and China further soured the mood, with President Trump threatening new tariffs on Chinese goods, along with the possibility of suspending investments in Chinese stocks from a government retirement fund in response to the coronavirus outbreak.
Treasuries advanced slightly, with the yield on the 10-year note down one basis point to 0.62%. On the data front, the ISM’s gauge of manufacturing contracted to a 11-year low in April. In commodities, WTI crude clocked its first weekly gain in a month as OPEC supply curbs took effect. |
 Kenneth J. Gruneisen started out as a licensed stockbroker in August 1987, a couple of months prior to the historic stock market crash that took the Dow Jones Industrial Average down -22.6% in a single day. He has published daily fact-based fundamental and technical analysis on high-ranked stocks online for two decades. Through FACTBASEDINVESTING.COM, Kenneth provides educational articles, news, market commentary, and other information regarding proven investment systems that work in good times and bad.
Comments contained in the body of this report are technical opinions only and are not necessarily those of Gruneisen Growth Corp. The material herein has been obtained from sources believed to be reliable and accurate, however, its accuracy and completeness cannot be guaranteed. Our firm, employees, and customers may effect transactions, including transactions contrary to any recommendation herein, or have positions in the securities mentioned herein or options with respect thereto. Any recommendation contained in this report may not be suitable for all investors and it is not to be deemed an offer or solicitation on our part with respect to the purchase or sale of any securities. |
|
 |
Financial, Tech, Retail, and Energy-Linked Groups Fell
Kenneth J. Gruneisen - Passed the CAN SLIM® Master's Exam
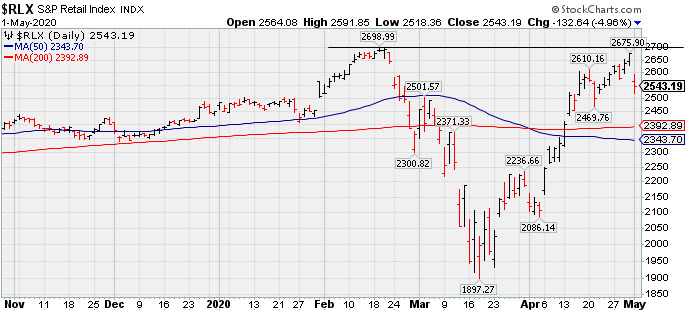
Financials had a negative bias as the Bank Index ($BKX -4.67%) and the Broker/Dealer Index ($XBD -2.11%) both fell. The tech sector also faced pressure as the Semiconductor Index ($SOX -5.02%), Networking Index ($NWX -3.88%), and the Biotech Index ($BTK -2.83%) ended unanimously in the red. Commodity-linked groups were mixed as the Oil Services Index ($OSX -8.87%) and the Integrated Oil Index ($XOI -6.50%) were standout decliners, meanwhile, the Gold & Silver Index ($XAU +3.24%) posted a standout gain. PICTURED: The Retail Index ($RLX -4.96%) recently rebounded near its record high, however, it gapped down Friday after Amazon (AMZN -7.60%) reported earnings -29% for the Mar '20 quarter versus the year-ago period.
| Oil Services |
$OSX |
27.84 |
-2.71 |
-8.87% |
-64.44% |
| Integrated Oil |
$XOI |
730.92 |
-50.78 |
-6.50% |
-42.47% |
| Semiconductor |
$SOX |
1,644.40 |
-86.84 |
-5.02% |
-11.10% |
| Networking |
$NWX |
505.37 |
-20.38 |
-3.88% |
-13.38% |
| Broker/Dealer |
$XBD |
236.43 |
-5.10 |
-2.11% |
-18.58% |
| Retail |
$RLX |
2,543.19 |
-132.64 |
-4.96% |
+3.83% |
| Gold & Silver |
$XAU |
117.36 |
+3.68 |
+3.24% |
+9.76% |
| Bank |
$BKX |
70.97 |
-3.40 |
-4.57% |
-37.39% |
| Biotech |
$BTK |
5,021.50 |
-146.48 |
-2.83% |
-0.91% |
|
|
|
 |
Featured Stocks
Kenneth J. Gruneisen - Passed the CAN SLIM® Master's Exam
As leadership improves the number of stocks covered in this area should be expected to increase gradually, as superior candidates are added to the Featured Stocks list on a case-by-case basis. Feel free to contact us if you have a need for any additional information. |
|
|
Color Codes Explained :
Y - Better candidates highlighted by our
staff of experts.
G - Previously featured
in past reports as yellow but may no longer be buyable under the
guidelines.
***Last / Change / Volume data in this table is the closing quote data***
Symbol/Exchange
Company Name
Industry Group |
PRICE |
CHANGE
(%Change) |
Day High |
Volume
(% DAV)
(% 50 day avg vol) |
52 Wk Hi
% From Hi |
Featured
Date |
Price
Featured |
Pivot Featured |
|
Max Buy |
 EBS
-
NYSE
EBS
-
NYSE
Emergent Biosolutions
DRUGS - Biotechnology
|
$78.70
|
+4.75
6.42% |
$79.00
|
783,750
133.97% of 50 DAV
50 DAV is 585,000
|
$83.01
-5.19%
|
4/24/2020
|
$72.10
|
PP = $73.99
|
|
MB = $77.69
|
 Most Recent Note - 5/1/2020 5:19:36 PM
G - Color code is changed to green after a volume-driven gain above its "max buy" level for its best ever close. Reported Mar '20 earnings of 1 cent per share versus a 10 cents per share loss for the year ago period with +1% better sales revenues. Prior highs in the $71-73 area define initial support to watch on pullbacks.
>>> FEATURED STOCK ARTICLE : Volume-Driven Gain for Vaccine Maker With Great Earnings History - 4/24/2020 |
View all notes |
Set NEW NOTE alert |
Company Profile |
SEC
News |
Chart |
Request a new note
C
A
S
I |
NFLX
-
NASDAQ
Netflix Inc
SPECIALTY RETAIL - Music and Video Stores
|
$415.27
|
-4.58
-1.09% |
$427.97
|
8,280,504
86.33% of 50 DAV
50 DAV is 9,592,000
|
$449.52
-7.62%
|
4/13/2020
|
$393.60
|
PP = $393.62
|
|
MB = $413.30
|
Most Recent Note - 5/1/2020 5:20:42 PM
Y - Quietly consolidating after testing prior highs in the $393 area defining initial support to watch. Fundamentals remain strong after it reported earnings +107% on +28% sales revenues for the Mar '20 quarter versus the year ago period.
>>> FEATURED STOCK ARTICLE : Netflix Reported Another Strong Quarter After Rally From Base - 4/21/2020 |
View all notes |
Set NEW NOTE alert |
Company Profile |
SEC
News |
Chart |
Request a new note
C
A
S
I |
NOW
-
NYSE
Servicenow Inc
Computer Sftwr-Enterprse
|
$339.51
|
-12.03
-3.42% |
$351.00
|
2,446,020
88.40% of 50 DAV
50 DAV is 2,767,000
|
$362.95
-6.46%
|
4/30/2020
|
$343.05
|
PP = $363.05
|
|
MB = $381.20
|
Most Recent Note - 5/1/2020 5:22:23 PM
Y - Pulled back today with lighter volume. Highlighted in yellow with new pivot point cited based on its 2/19/20 high plus 10 cents in the 4/30/20 mid-day report. Rebounded toward its all-time high with 2 big gap up gains in a row backed by above average volume, rallying on the right side of an 11-week cup-shaped base. Subsequent gains above the pivot point backed by at least +40% above average volume are needed to trigger a proper technical buy signal. New CEO as of 1/01/20. It was dropped from the Featured Stocks list on 8/02/19. Earnings rose +57% on +33% sales revenues for the Mar '20 quarter versus the year-ago period, its 4th consecutive comparison above the +25% minimum earnings guideline (C criteria). See the latest FSU analysis fore more details and an annotated graph.
>>> FEATURED STOCK ARTICLE : Fundamental Strength Continues; Volume Heavy Behind Big Gain - 4/30/2020 |
View all notes |
Set NEW NOTE alert |
Company Profile |
SEC
News |
Chart |
Request a new note
C
A
S
I |
QLYS
-
NASDAQ
Qualys Inc
Computer Sftwr-Security
|
$99.86
|
-5.58
-5.29% |
$103.79
|
520,174
97.59% of 50 DAV
50 DAV is 533,000
|
$110.89
-9.95%
|
4/9/2020
|
$100.44
|
PP = $97.22
|
|
MB = $102.08
|
Most Recent Note - 5/1/2020 5:24:03 PM
Y - Color code is changed to yellow after slumping below its "max buy" level with today's big loss on average volume. Prior highs in the $97 area define initial support to watch on pullbacks. Due to report earnings news on 5/07/20.
>>> FEATURED STOCK ARTICLE : Volume Totals Cooling While Stubbornly Holding Ground Near High - 4/27/2020 |
View all notes |
Set NEW NOTE alert |
Company Profile |
SEC
News |
Chart |
Request a new note
C
A
S
I |
|
|
|
THESE ARE NOT BUY RECOMMENDATIONS!
Comments contained in the body of this report are technical
opinions only. The material herein has been obtained
from sources believed to be reliable and accurate, however,
its accuracy and completeness cannot be guaranteed.
This site is not an investment advisor, hence it does
not endorse or recommend any securities or other investments.
Any recommendation contained in this report may not
be suitable for all investors and it is not to be deemed
an offer or solicitation on our part with respect to
the purchase or sale of any securities. All trademarks,
service marks and trade names appearing in this report
are the property of their respective owners, and are
likewise used for identification purposes only.
This report is a service available
only to active Paid Premium Members.
You may opt-out of receiving report notifications
at any time. Questions or comments may be submitted
by writing to Premium Membership Services 665 S.E. 10 Street, Suite 201 Deerfield Beach, FL 33441-5634 or by calling 1-800-965-8307
or 954-785-1121.
|
|
|