You are not logged in.
This means you
CAN ONLY VIEW reports that were published prior to Thursday, May 1, 2025.
You
MUST UPGRADE YOUR MEMBERSHIP if you want to see any current reports.
AFTER MARKET UPDATE - MONDAY, MAY 4TH, 2020
Previous After Market Report Next After Market Report >>>
|
|
|
|
DOW |
+26.07 |
23,749.76 |
+0.11% |
|
Volume |
968,530,162 |
+5% |
|
Volume |
3,373,692,500 |
-9% |
|
NASDAQ |
+105.76 |
8,710.71 |
+1.23% |
|
Advancers |
1,361 |
47% |
|
Advancers |
1,710 |
53% |
|
S&P 500 |
+12.03 |
2,842.74 |
+0.42% |
|
Decliners |
1,527 |
53% |
|
Decliners |
1,526 |
47% |
|
Russell 2000 |
+3.49 |
1,263.97 |
+0.28% |
|
52 Wk Highs |
5 |
|
|
52 Wk Highs |
19 |
|
|
S&P 600 |
-4.00 |
736.02 |
-0.54% |
|
52 Wk Lows |
10 |
|
|
52 Wk Lows |
16 |
|
|
 |
Major Indices Overcame Early Weakness to Finish Higher
Kenneth J. Gruneisen - Passed the CAN SLIM® Master's Exam
The Dow reversed a 200-point midday decline to finish 26 points higher. The S&P 500 snapped a two day losing streak, advancing 0.4%. The Tech-heavy Nasdaq Composite rallied 1.2%. Breadth was fairly even as decliners led advancers by an 8-7 margin on the NYSE, meanwhile advancers led decliners by a 8-7 margin on the Nasdaq exchange. The reported volume totals were higher than the prior session on the NYSE and lower on the Nasdaq exchange. There were 9 high-ranked companies from the Leaders List that hit new 52-week highs and were listed on the BreakOuts Page, versus 2 on the prior session. New 52-week lows outnumbered new highs on the NYSE while new 52-week highs outnumbered new lows on the Nasdaq exchange. The major indices are in a confirmed uptrend (M criteria). Any sustainable rally requires a healthy crop of new leaders, so waning leadership of late is becoming a concern. Charts used courtesy of www.stockcharts.com
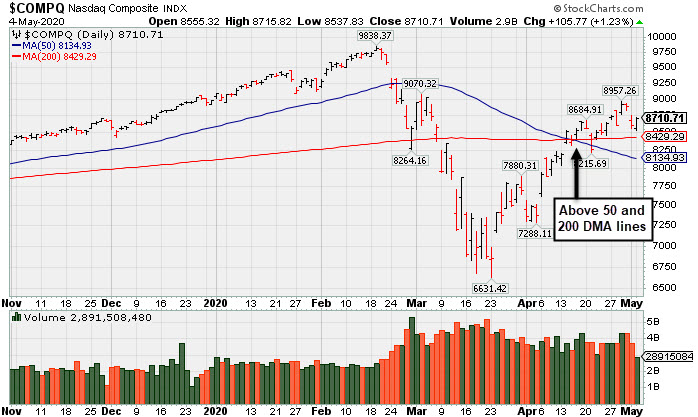
PICTURED: The Nasdaq Composite Index recently rebounded above its 50-day and 200-day moving average (DMA) lines.
Stocks U.S. equities pared an early session decline on Monday, as gains in Energy and Tech-related stocks propelled the major averages higher. Geopolitical strains between the U.S. and China weighed on investor sentiment after Secretary of State Mike Pompeo stated that there was “enormous evidence” indicating the coronavirus originated in a Wuhan laboratory. On the data front, final April updates showed manufacturing activity across major European counties contracted at the fastest pace on record. Domestically, factory orders dropped 10.3% in March, while durable goods orders slumped by more than expected during the same period. Treasuries declined, with the yield on the 10-year note up one basis point to 0.63%. In commodities, COMEX gold rose 0.6% to $1,712.00/ounce.
Eight of 11 S&P 500 sectors ended in positive territory. Energy stocks paced the gains, with Exxon Mobil (XOM +4.03%) as WTI crude added advanced for a fourth consecutive session. Industrials was a notable laggard, with shares of major airliners sliding between 5% and 8% after Berkshire Hathaway (BRKB -2.58%) CEO Warren Buffett reported the conglomerate liquidated their entire stake in Delta Air Lines (DAL -6.43%), American Airlines (AAL -7.71%) , United Airlines (UAL -5.11%), and Southwest (LUV -5.71%). In earnings, Tyson Foods (TSN -7.82%) fell after its profit and sales fell short of analyst expectations amid production disruptions related to the coronavirus. In other corporate news, Disney (DIS -2.20%) fell following an analyst downgrade and ahead of its earnings report due on Tuesday. |
 Kenneth J. Gruneisen started out as a licensed stockbroker in August 1987, a couple of months prior to the historic stock market crash that took the Dow Jones Industrial Average down -22.6% in a single day. He has published daily fact-based fundamental and technical analysis on high-ranked stocks online for two decades. Through FACTBASEDINVESTING.COM, Kenneth provides educational articles, news, market commentary, and other information regarding proven investment systems that work in good times and bad.
Comments contained in the body of this report are technical opinions only and are not necessarily those of Gruneisen Growth Corp. The material herein has been obtained from sources believed to be reliable and accurate, however, its accuracy and completeness cannot be guaranteed. Our firm, employees, and customers may effect transactions, including transactions contrary to any recommendation herein, or have positions in the securities mentioned herein or options with respect thereto. Any recommendation contained in this report may not be suitable for all investors and it is not to be deemed an offer or solicitation on our part with respect to the purchase or sale of any securities. |
|
 |
Retail, Tech, and Commodity-Linked Groups Rose
Kenneth J. Gruneisen - Passed the CAN SLIM® Master's Exam
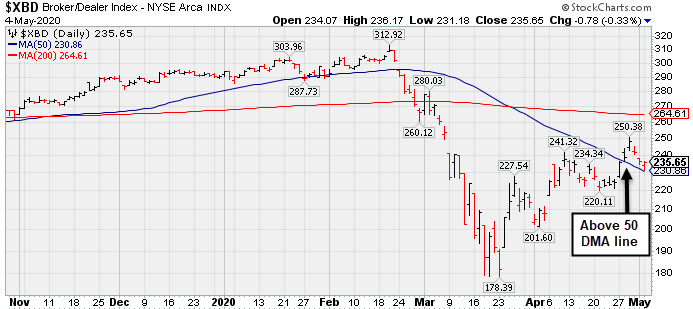
Financials had a negative bias as the Bank Index ($BKX -1.13%) and the Broker/Dealer Index ($XBD -0.33%) both fell. The Retail Index ($RLX +1.21%) notched a gain. The tech sector had a positive bias as the Semiconductor Index ($SOX +1.03%) and the Biotech Index ($BTK +3.27%) both rose while the Networking Index ($NWX +0.05%) finished flat. Commodity-linked groups had a positive bias as the Oil Services Index ($OSX +4.06%) and the Integrated Oil Index ($XOI +4.23%) both outpaced the Gold & Silver Index ($XAU +1.93%). PICTURED: The Broker/Dealer Index ($XBD -0.33%) has been consolidating since recently rebounding above its 50-day moving average (DMA) line.
| Oil Services |
$OSX |
28.98 |
+1.14 |
+4.09% |
-62.98% |
| Integrated Oil |
$XOI |
761.83 |
+30.91 |
+4.23% |
-40.04% |
| Semiconductor |
$SOX |
1,661.30 |
+16.90 |
+1.03% |
-10.18% |
| Networking |
$NWX |
505.62 |
+0.26 |
+0.05% |
-13.33% |
| Broker/Dealer |
$XBD |
235.65 |
-0.78 |
-0.33% |
-18.85% |
| Retail |
$RLX |
2,574.06 |
+30.87 |
+1.21% |
+5.09% |
| Gold & Silver |
$XAU |
119.62 |
+2.26 |
+1.93% |
+11.88% |
| Bank |
$BKX |
70.17 |
-0.80 |
-1.13% |
-38.10% |
| Biotech |
$BTK |
5,185.38 |
+163.88 |
+3.26% |
+2.33% |
|
|
|
 |
Volume-Driven Gain For New All-Time High
Kenneth J. Gruneisen - Passed the CAN SLIM® Master's Exam
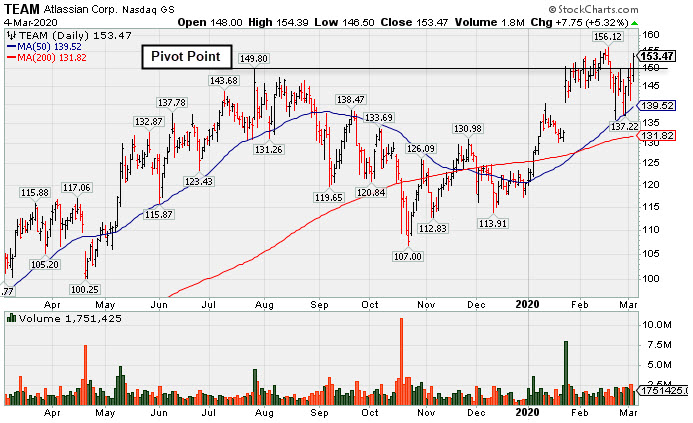
Atlassian Corp (TEAM +$8.54 or +5.52% to $163.13) finished strong after highlighted in yellow with pivot point based on its 2/19/20 high plus 10 cents in the earlier mid-day report (read here). It hit a new all-time high with today's gain and strong close above the pivot point backed by +61% above average volume clinching a convincing technical buy signal.
TEAM has a 98 Earnings Per Share rating, but last week it reported earnings +19% on +33% sales revenues for the Mar '20 quarter, breaking a strong track record of +25% earnings increases (C criteria). It rebounded from below its 200 DMA line in recent weeks and showed resilience since dropped from the Featured Stocks list on 3/11/20.
This Australia - based software developer has shown 9 consecutive quarterly comparisons above the +25% minimum guideline (C criteria). Its annual earnings (A criteria) history has been strong since its $21 IPO on 12/10/15.
TEAM was last shown in the FSU section on 3/04/20 with an annotated graph under the headline, "Found Support at 50-Day Average During Recent Consolidation". The number of top-rated funds owning its shares rose from 266 in Sep '17 to 709 in Mar '20, a reassuring sign concerning the I criteria. It has a Timeliness Rating of A and Sponsorship Rating of A. Its current Up/Down Volume Ratio of 1.0 is an unbiased indication its shares have been neutral concerning accumulation or distribution over the past 50 days. |
|
|
Color Codes Explained :
Y - Better candidates highlighted by our
staff of experts.
G - Previously featured
in past reports as yellow but may no longer be buyable under the
guidelines.
***Last / Change / Volume data in this table is the closing quote data***
Symbol/Exchange
Company Name
Industry Group |
PRICE |
CHANGE
(%Change) |
Day High |
Volume
(% DAV)
(% 50 day avg vol) |
52 Wk Hi
% From Hi |
Featured
Date |
Price
Featured |
Pivot Featured |
|
Max Buy |
 EBS
-
NYSE
EBS
-
NYSE
Emergent Biosolutions
DRUGS - Biotechnology
|
$79.50
|
+0.80
1.02% |
$79.65
|
590,405
99.56% of 50 DAV
50 DAV is 593,000
|
$83.01
-4.23%
|
4/24/2020
|
$72.10
|
PP = $73.99
|
|
MB = $77.69
|
Most Recent Note - 5/1/2020 5:19:36 PM
G - Color code is changed to green after a volume-driven gain above its "max buy" level for its best ever close. Reported Mar '20 earnings of 1 cent per share versus a 10 cents per share loss for the year ago period with +1% better sales revenues. Prior highs in the $71-73 area define initial support to watch on pullbacks.
>>> FEATURED STOCK ARTICLE : Volume-Driven Gain for Vaccine Maker With Great Earnings History - 4/24/2020 |
View all notes |
Set NEW NOTE alert |
Company Profile |
SEC
News |
Chart |
Request a new note
C
A
S
I |
NFLX
-
NASDAQ
Netflix Inc
SPECIALTY RETAIL - Music and Video Stores
|
$428.15
|
+12.88
3.10% |
$428.54
|
7,344,915
75.90% of 50 DAV
50 DAV is 9,677,000
|
$449.52
-4.75%
|
4/13/2020
|
$393.60
|
PP = $393.62
|
|
MB = $413.30
|
 Most Recent Note - 5/4/2020 6:12:19 PM
Y - Posted a solid gain today on light volume. Prior highs in the $393 area define initial support to watch. Fundamentals remain strong after it reported earnings +107% on +28% sales revenues for the Mar '20 quarter versus the year ago period.
>>> FEATURED STOCK ARTICLE : Netflix Reported Another Strong Quarter After Rally From Base - 4/21/2020 |
View all notes |
Set NEW NOTE alert |
Company Profile |
SEC
News |
Chart |
Request a new note
C
A
S
I |
NOW
-
NYSE
Servicenow Inc
Computer Sftwr-Enterprse
|
$354.64
|
+15.13
4.46% |
$356.50
|
2,510,902
90.42% of 50 DAV
50 DAV is 2,777,000
|
$362.95
-2.29%
|
4/30/2020
|
$343.05
|
PP = $363.05
|
|
MB = $381.20
|
Most Recent Note - 5/4/2020 6:16:14 PM
Y - Posted a solid gain today with near average volume. Highlighted in yellow with new pivot point cited based on its 2/19/20 high plus 10 cents in the 4/30/20 mid-day report. Subsequent gains above the pivot point backed by at least +40% above average volume are needed to trigger a proper technical buy signal. New CEO as of 1/01/20. Earnings rose +57% on +33% sales revenues for the Mar '20 quarter versus the year-ago period, its 4th consecutive comparison above the +25% minimum earnings guideline (C criteria).
>>> FEATURED STOCK ARTICLE : Fundamental Strength Continues; Volume Heavy Behind Big Gain - 4/30/2020 |
View all notes |
Set NEW NOTE alert |
Company Profile |
SEC
News |
Chart |
Request a new note
C
A
S
I |
QLYS
-
NASDAQ
Qualys Inc
Computer Sftwr-Security
|
$101.24
|
+1.38
1.38% |
$101.49
|
610,026
113.81% of 50 DAV
50 DAV is 536,000
|
$110.89
-8.70%
|
4/9/2020
|
$100.44
|
PP = $97.22
|
|
MB = $102.08
|
Most Recent Note - 5/1/2020 5:24:03 PM
Y - Color code is changed to yellow after slumping below its "max buy" level with today's big loss on average volume. Prior highs in the $97 area define initial support to watch on pullbacks. Due to report earnings news on 5/07/20.
>>> FEATURED STOCK ARTICLE : Volume Totals Cooling While Stubbornly Holding Ground Near High - 4/27/2020 |
View all notes |
Set NEW NOTE alert |
Company Profile |
SEC
News |
Chart |
Request a new note
C
A
S
I |
TEAM
-
NASDAQ
Atlassian Corp Plc Cl A
Comp Sftwr-Spec Enterprs
|
$163.13
|
+8.54
5.52% |
$163.69
|
3,235,820
159.64% of 50 DAV
50 DAV is 2,027,000
|
$158.98
2.61%
|
5/4/2020
|
$159.70
|
PP = $156.22
|
|
MB = $164.03
|
Most Recent Note - 5/4/2020 6:05:33 PM
Y - Finished strong after highlighted in yellow with pivot point based on its 2/19/20 high plus 10 cents in the earlier mid-day report. Hit a new all-time high with today's gain and strong close above the pivot point backed by +61% above average volume clinching a convincing technical buy signal. It has a 98 Earnings Per Share rating, but last week it reported earnings +19% on +33% sales revenues for the Mar '20 quarter, breaking a strong track record of +25% earnings increases (C criteria). Rebounded from below its 200 DMA line in recent weeks and showed resilience since dropped from the Featured Stocks list on 3/11/20. See the latest FSU analysis for more details and a new annotated graph.
>>> FEATURED STOCK ARTICLE : Volume-Driven Gain For New All-Time High - 5/4/2020 |
View all notes |
Set NEW NOTE alert |
Company Profile |
SEC
News |
Chart |
Request a new note
C
A
S
I |
Symbol/Exchange
Company Name
Industry Group |
PRICE |
CHANGE
(%Change) |
Day High |
Volume
(% DAV)
(% 50 day avg vol) |
52 Wk Hi
% From Hi |
Featured
Date |
Price
Featured |
Pivot Featured |
|
Max Buy |
|
|
|
THESE ARE NOT BUY RECOMMENDATIONS!
Comments contained in the body of this report are technical
opinions only. The material herein has been obtained
from sources believed to be reliable and accurate, however,
its accuracy and completeness cannot be guaranteed.
This site is not an investment advisor, hence it does
not endorse or recommend any securities or other investments.
Any recommendation contained in this report may not
be suitable for all investors and it is not to be deemed
an offer or solicitation on our part with respect to
the purchase or sale of any securities. All trademarks,
service marks and trade names appearing in this report
are the property of their respective owners, and are
likewise used for identification purposes only.
This report is a service available
only to active Paid Premium Members.
You may opt-out of receiving report notifications
at any time. Questions or comments may be submitted
by writing to Premium Membership Services 665 S.E. 10 Street, Suite 201 Deerfield Beach, FL 33441-5634 or by calling 1-800-965-8307
or 954-785-1121.
|
|
|