You are not logged in.
This means you
CAN ONLY VIEW reports that were published prior to Monday, April 7, 2025.
You
MUST UPGRADE YOUR MEMBERSHIP if you want to see any current reports.
AFTER MARKET UPDATE - THURSDAY, APRIL 30TH, 2020
Previous After Market Report Next After Market Report >>>
|
|
|
|
DOW |
-288.14 |
24,345.72 |
-1.17% |
|
Volume |
1,522,599,283 |
+25% |
|
Volume |
4,296,299,700 |
-1% |
|
NASDAQ |
-25.16 |
8,889.55 |
-0.28% |
|
Advancers |
806 |
28% |
|
Advancers |
914 |
28% |
|
S&P 500 |
-27.08 |
2,912.43 |
-0.92% |
|
Decliners |
2,054 |
72% |
|
Decliners |
2,353 |
72% |
|
Russell 2000 |
-50.10 |
1,310.66 |
-3.68% |
|
52 Wk Highs |
17 |
|
|
52 Wk Highs |
28 |
|
|
S&P 600 |
-31.85 |
771.11 |
-3.97% |
|
52 Wk Lows |
2 |
|
|
52 Wk Lows |
7 |
|
|
 |
Dow and S&P 500 Notch Best Monthly Gains Since 1987
Kenneth J. Gruneisen - Passed the CAN SLIM® Master's Exam
Despite the session’s losses, the Dow and S&P 500 both notched their best monthly performance since 1987 and are within 20% of their respective all-time highs. The Dow lost 288 points, but rose 11.1% in April. The S&P 500 slipped 0.9%, paring its monthly gain to 12.7%. The Nasdaq Composite slipped 0.3%, but still posted its best month since 2001 with a 15.5% advance. Breadth was negative as decliners led advancers by about a 5-2 margin on the NYSE and on the Nasdaq exchange. The reported volume totals were mixed, higher than the prior session on the NYSE and lower on the Nasdaq exchange. There were 14 high-ranked companies from the Leaders List hit new 52-week highs and were listed on the BreakOuts Page, versus 20 on the prior session. New 52-week highs totals contracted again yet still outnumbered the single-digit new 52-week lows totals on the NYSE and on the Nasdaq exchange. The major indices are in a confirmed uptrend (M criteria). Any sustainable rally requires a healthy crop of new leaders, so waning leadership of late is becoming a concern. Charts used courtesy of www.stockcharts.com
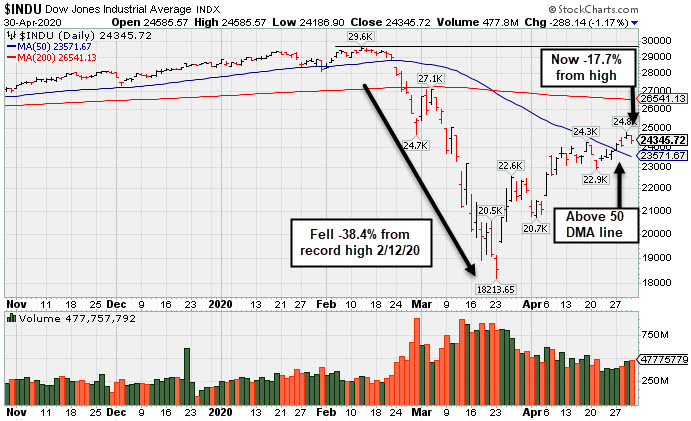
PICTURED: The Dow Jones Industrial Average slumped -38.4% from its 2/12/20 record high and has rebounded above its 50-day moving average (DMA) line to now sit -17.7% off its high.
Stocks fell on Thursday, as investors digested another raft of downbeat economic data updates and a flurry of corporate earnings results. On the data front, initial jobless claims came in at 3.8 million in the week ended April 25, bringing the total to more than 30 million unemployment claims in the past six weeks. Separately, personal spending fell the most on record in March. Treasuries were mixed, with the yield on the 10-year note up two basis points to 0.63%.
Central bank updates also garnered attention. The Federal Reserve expanded the scope of its “Main Street” lending program to include larger businesses. Meanwhile, the European Central Bank left its benchmark rate unchanged and pledged to increase government bond purchases, if necessary. In commodities, WTI crude spiked 26.6% to $19.07/barrel.
Nine of 11 S&P 500 sectors ended in negative territory, with the Materials leading laggards. The Communication Services bucked the downtrend, with Facebook (FB +5.23%) rose after noting signs of stability in its advertising revenue during the first few weeks of April. In other earnings, Microsoft (MSFT +1.00%) rose following a top and bottom line beat. Tesla (TSLA -2.33%) fell despite posting a surprise profit for the third-straight quarter. |
 Kenneth J. Gruneisen started out as a licensed stockbroker in August 1987, a couple of months prior to the historic stock market crash that took the Dow Jones Industrial Average down -22.6% in a single day. He has published daily fact-based fundamental and technical analysis on high-ranked stocks online for two decades. Through FACTBASEDINVESTING.COM, Kenneth provides educational articles, news, market commentary, and other information regarding proven investment systems that work in good times and bad.
Comments contained in the body of this report are technical opinions only and are not necessarily those of Gruneisen Growth Corp. The material herein has been obtained from sources believed to be reliable and accurate, however, its accuracy and completeness cannot be guaranteed. Our firm, employees, and customers may effect transactions, including transactions contrary to any recommendation herein, or have positions in the securities mentioned herein or options with respect thereto. Any recommendation contained in this report may not be suitable for all investors and it is not to be deemed an offer or solicitation on our part with respect to the purchase or sale of any securities. |
|
 |
Retail Index Bucks Widespread Group Losses
Kenneth J. Gruneisen - Passed the CAN SLIM® Master's Exam
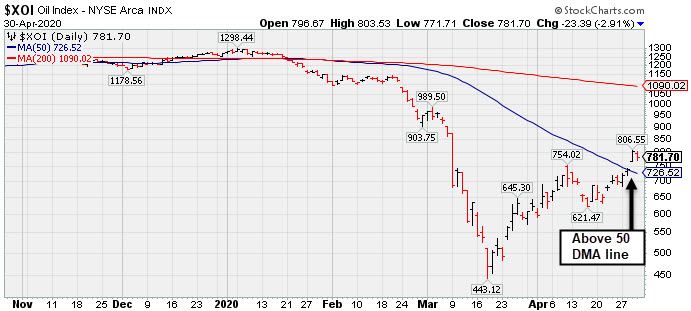
Financials had a negative bias as the Bank Index ($BKX -3.76%) and the Broker/Dealer Index ($XBD -2.65%) both fell. The Retail Index ($RLX +1.47%) was a standout gainer. The tech sector had a negative bias as the Semiconductor Index ($SOX -3.70%), Networking Index ($NWX -3.08%), and the Biotech Index ($BTK -1.63%) ended unanimously in the red. Commodity-linked groups also faced pressure as the Oil Services Index ($OSX -4.13%) and the Integrated Oil Index ($XOI -2.91%) and the Gold & Silver Index ($XAU -4.85%) each fell. PICTURED: The Integrated Oil Index ($XOI -2.91%) recently rebounded above its 50-day moving average (DMA) line.
| Oil Services |
$OSX |
30.55 |
-1.32 |
-4.14% |
-60.98% |
| Integrated Oil |
$XOI |
781.70 |
-23.39 |
-2.91% |
-38.48% |
| Semiconductor |
$SOX |
1,731.24 |
-66.52 |
-3.70% |
-6.40% |
| Networking |
$NWX |
525.75 |
-16.71 |
-3.08% |
-9.88% |
| Broker/Dealer |
$XBD |
241.53 |
-6.58 |
-2.65% |
-16.82% |
| Retail |
$RLX |
2,675.83 |
+38.67 |
+1.47% |
+9.25% |
| Gold & Silver |
$XAU |
113.68 |
-5.79 |
-4.85% |
+6.32% |
| Bank |
$BKX |
74.37 |
-2.91 |
-3.77% |
-34.39% |
| Biotech |
$BTK |
5,167.98 |
-85.52 |
-1.63% |
+1.98% |
|
|
|
 |
Fundamental Strength Continues; Volume Heavy Behind Big Gain
Kenneth J. Gruneisen - Passed the CAN SLIM® Master's Exam
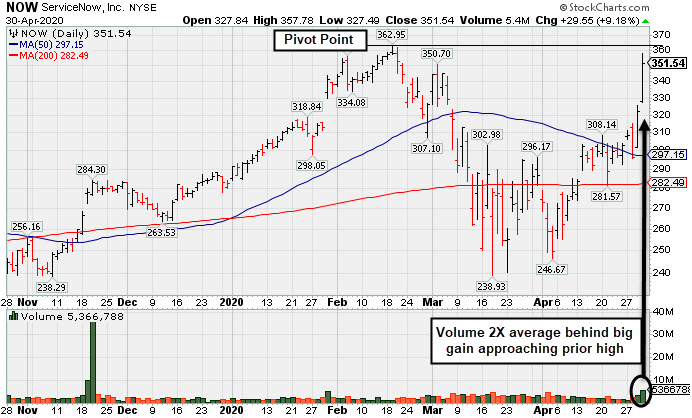
ServiceNow Inc (NOW +$29.55 or +9.18% to $351.54) was highlighted in yellow with new pivot point cited based on its 2/19/20 high plus 10 cents in the earlier mid-day repot (read here). It rebounded toward its all-time high with today's gap up and big volume-driven gain, working on the right side of an 11-week cup-shaped base. Subsequent gains above the pivot point backed by at least +40% above average volume are needed to trigger a proper technical buy signal.
NOW has a new CEO as of 1/01/20. It was last shown in this FSU section on 7/31/19 with an annotated graph under the headline, "Slumped Below 50-Day Average With Loss on Higher Volume". It went through some choppy consolidations yet has maintained its strong fundamentals since dropped from the Featured Stocks list on 8/02/19.
Annual earnings (A criteria) growth has been strong since FY '15. It has an Earnings Per Share Rating of 97. The Computer Software - Enterprise group has a Group Relative Strength Rating of 96, a reassuring sign concerning the L criteria.
The number of top-rated funds owning its shares rose from 1,030 in Jun '17 to 1,975 in Mar '20, a reassuring sign concerning the I criteria. It has a Timeliness Rating of A and a Sponsorship Rating of B. However, its current Up/Down Volume Ratio of 0.8 is an unbiased indication its shares have faced distributional pressure over the past 50 days. |
|
|
Color Codes Explained :
Y - Better candidates highlighted by our
staff of experts.
G - Previously featured
in past reports as yellow but may no longer be buyable under the
guidelines.
***Last / Change / Volume data in this table is the closing quote data***
Symbol/Exchange
Company Name
Industry Group |
PRICE |
CHANGE
(%Change) |
Day High |
Volume
(% DAV)
(% 50 day avg vol) |
52 Wk Hi
% From Hi |
Featured
Date |
Price
Featured |
Pivot Featured |
|
Max Buy |
 EBS
-
NYSE
EBS
-
NYSE
Emergent Biosolutions
DRUGS - Biotechnology
|
$73.95
|
+0.00
0.00% |
$75.74
|
483,263
82.61% of 50 DAV
50 DAV is 585,000
|
$83.01
-10.91%
|
4/24/2020
|
$72.10
|
PP = $73.99
|
|
MB = $77.69
|
 Most Recent Note - 4/30/2020 5:36:22 PM
Y - After today's close it reported Mar '20 earnings of 1 cent per share versus a 10 cents per share loss for the year ago period with +1% better sales revenues. Volume and volatility often increase near earnings news. Color code was changed to yellow after pulling back following 2 big volume-driven gains for a new all-time high. Highlighted with pivot point cited based on its December 2018 high in the 4/24/20 mid-day report.
>>> FEATURED STOCK ARTICLE : Volume-Driven Gain for Vaccine Maker With Great Earnings History - 4/24/2020 |
View all notes |
Set NEW NOTE alert |
Company Profile |
SEC
News |
Chart |
Request a new note
C
A
S
I |
NFLX
-
NASDAQ
Netflix Inc
SPECIALTY RETAIL - Music and Video Stores
|
$419.85
|
+7.96
1.93% |
$424.44
|
7,789,559
81.73% of 50 DAV
50 DAV is 9,531,000
|
$449.52
-6.60%
|
4/13/2020
|
$393.60
|
PP = $393.62
|
|
MB = $413.30
|
Most Recent Note - 4/29/2020 5:05:56 PM
Y - Managed a "positive reversal" today after pulling back to test prior highs in the $393 area defining initial support to watch. Fundamentals remain strong after it reported earnings +107% on +28% sales revenues for the Mar '20 quarter versus the year ago period.
>>> FEATURED STOCK ARTICLE : Netflix Reported Another Strong Quarter After Rally From Base - 4/21/2020 |
View all notes |
Set NEW NOTE alert |
Company Profile |
SEC
News |
Chart |
Request a new note
C
A
S
I |
NOW
-
NYSE
Servicenow Inc
Computer Sftwr-Enterprse
|
$351.54
|
+29.55
9.18% |
$357.78
|
5,364,455
199.79% of 50 DAV
50 DAV is 2,685,000
|
$362.95
-3.14%
|
4/30/2020
|
$343.05
|
PP = $363.05
|
|
MB = $381.20
|
Most Recent Note - 4/30/2020 5:32:08 PM
Y - Highlighted in yellow with new pivot point cited based on its 2/19/20 high plus 10 cents in the earlier mid-day report. Rebounded toward its all-time high with today's gap up and big gain backed by twice its average volume, rallying on the right side of an 11-week cup-shaped base. Subsequent gains above the pivot point backed by at least +40% above average volume are needed to trigger a proper technical buy signal. New CEO as of 1/01/20. It was dropped from the Featured Stocks list on 8/02/19. Earnings rose +57% on +33% sales revenues for the Mar '20 quarter versus the year-ago period, its 4th consecutive comparison above the +25% minimum earnings guideline (C criteria). See the latest FSU analysis fore more details and a new annotated graph.
>>> FEATURED STOCK ARTICLE : Fundamental Strength Continues; Volume Heavy Behind Big Gain - 4/30/2020 |
View all notes |
Set NEW NOTE alert |
Company Profile |
SEC
News |
Chart |
Request a new note
C
A
S
I |
QLYS
-
NASDAQ
Qualys Inc
Computer Sftwr-Security
|
$105.44
|
+0.60
0.57% |
$107.94
|
503,630
95.02% of 50 DAV
50 DAV is 530,000
|
$110.89
-4.91%
|
4/9/2020
|
$100.44
|
PP = $97.22
|
|
MB = $102.08
|
Most Recent Note - 4/29/2020 12:48:11 PM
G - Consolidating near its all-time high, extended from the previously noted base. Prior highs in the $97 area define initial support to watch on pullbacks. Due to report earnings news on 5/07/20. See the latest FSU analysis for more details and an annotated graph.
>>> FEATURED STOCK ARTICLE : Volume Totals Cooling While Stubbornly Holding Ground Near High - 4/27/2020 |
View all notes |
Set NEW NOTE alert |
Company Profile |
SEC
News |
Chart |
Request a new note
C
A
S
I |
|
|
|
THESE ARE NOT BUY RECOMMENDATIONS!
Comments contained in the body of this report are technical
opinions only. The material herein has been obtained
from sources believed to be reliable and accurate, however,
its accuracy and completeness cannot be guaranteed.
This site is not an investment advisor, hence it does
not endorse or recommend any securities or other investments.
Any recommendation contained in this report may not
be suitable for all investors and it is not to be deemed
an offer or solicitation on our part with respect to
the purchase or sale of any securities. All trademarks,
service marks and trade names appearing in this report
are the property of their respective owners, and are
likewise used for identification purposes only.
This report is a service available
only to active Paid Premium Members.
You may opt-out of receiving report notifications
at any time. Questions or comments may be submitted
by writing to Premium Membership Services 665 S.E. 10 Street, Suite 201 Deerfield Beach, FL 33441-5634 or by calling 1-800-965-8307
or 954-785-1121.
|
|
|