You are not logged in.
This means you
CAN ONLY VIEW reports that were published prior to Monday, April 14, 2025.
You
MUST UPGRADE YOUR MEMBERSHIP if you want to see any current reports.
AFTER MARKET UPDATE - WEDNESDAY, APRIL 27TH, 2011
Previous After Market Report Next After Market Report >>>
|
|
|
|
DOW |
+95.59 |
12,690.96 |
+0.76% |
|
Volume |
962,520,310 |
+6% |
|
Volume |
2,021,291,660 |
+2% |
|
NASDAQ |
+22.34 |
2,869.88 |
+0.78% |
|
Advancers |
1,888 |
60% |
|
Advancers |
1,626 |
60% |
|
S&P 500 |
+8.42 |
1,355.66 |
+0.62% |
|
Decliners |
1,112 |
36% |
|
Decliners |
971 |
36% |
|
Russell 2000 |
+5.27 |
858.31 |
+0.62% |
|
52 Wk Highs |
290 |
|
|
52 Wk Highs |
148 |
|
|
S&P 600 |
+4.11 |
455.95 |
+0.91% |
|
52 Wk Lows |
10 |
|
|
52 Wk Lows |
25 |
|
|
 |
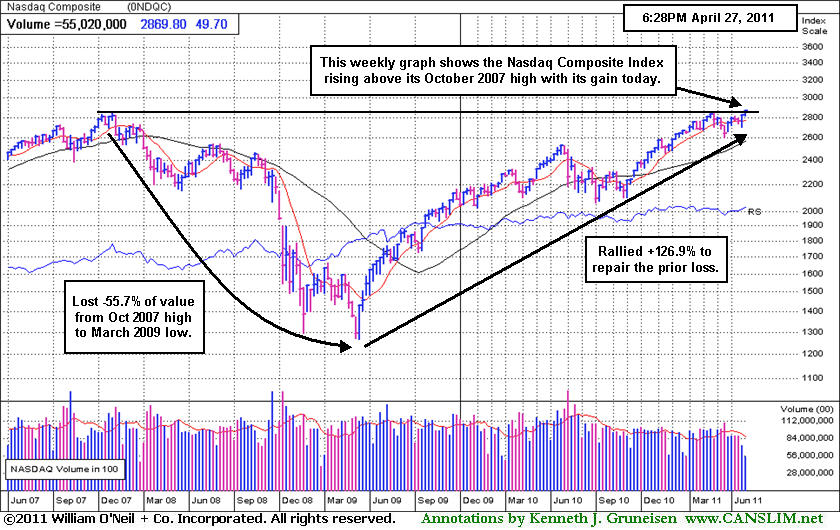
Nasdaq Composite Index Finally Rises Above 2007 Peak
Kenneth J. Gruneisen - Passed the CAN SLIM® Master's Exam
The major averages rallied to new recovery highs after Fed Chairman Ben Bernanke said the end of the Fed's bond-buying program in June should not have a significant impact on financial markets or the economy. Volume totals were reported higher on both major stock exchanges as advancing issues beat decliners by 9-5 on both the NYSE and the Nasdaq. New 52-week highs solidly outnumbered new 52-week lows on the NYSE and on the Nasdaq exchange. There were 108 high-ranked companies from the CANSLIM.net Leaders List that made new 52-week highs and appeared on the CANSLIM.net BreakOuts Page, up from the total of 86 on the prior session. On the Featured Stocks Page there were gains from 14 of the 21 high-ranked market leaders currently listed.
For the first time since the central bank was founded in 1913, a news conference from the Federal Reserve got high marks on Wall Street. The policy statement suggested that the economy is recovering at a moderate pace, and a pickup in inflation is likely to be transitory. Treasuries dropped as the Fed renewed its pledge to keep interest rates low for an extended period.
A new economic report showed March durable goods orders rose 2.5%, more than expected, showing businesses intend to keep spending to update equipment. Crude oil rose to a two-week high as U.S. gasoline stockpiles tumbled to the lowest level since August 2009. The dollar weakened against the euro for the seventh day ahead of the Fed decision, the longest losing streak for the U.S. currency since March.
International Business Machines Corp (IBM +1.12%) was the top performing Dow component. hitting a new record high. Boeing Co (BA +0.75%), another Dow component, reported better-than-expected earnings while revenue was short of analyst estimates. In merger news, drug-maker Johnson & Johnson (JNJ +0.95%) agreed to buy Synthes for $21.3 billion. CenturyLink Inc (CTL -0.45%) will purchase Savvis Inc (SVVS +9.08%) for $2.5 billion. Broadcom Corp (BRCM -12.27%) fell following a disappointing revenue forecast. Amazon.com Inc (AMZN +7.86%) rallied even though profits missed forecasts, as analysts remained bullish on the stock. Keep in mind that earnings reports will continue to be a factor, and volume and volatility are often greater near earnings announcements.
PICTURED: The Nasdaq Composite Index rallied to its best level of the day in the final hour, topping its October 2007 high in the process. Regular readers of this commentary may recall earlier this year as we observed the S&P Mid-Cap 400 Index and S&P Small-Cap 600 Index each hitting new all-time highs. The tech-heavy Nasdaq Composite Index had not made it to new all-time highs in 2007, as the Dow Jones Industrial Average and benchmark S&P 500 Index both did. However, the Nasdaq Composite Index is now officially the first of the 3 major averages to have fully recovered all (-55.7%) that it lost in the 2007-2009 Bear Market, which required a +126.9% gain.
|
 Kenneth J. Gruneisen started out as a licensed stockbroker in August 1987, a couple of months prior to the historic stock market crash that took the Dow Jones Industrial Average down -22.6% in a single day. He has published daily fact-based fundamental and technical analysis on high-ranked stocks online for two decades. Through FACTBASEDINVESTING.COM, Kenneth provides educational articles, news, market commentary, and other information regarding proven investment systems that work in good times and bad.
Comments contained in the body of this report are technical opinions only and are not necessarily those of Gruneisen Growth Corp. The material herein has been obtained from sources believed to be reliable and accurate, however, its accuracy and completeness cannot be guaranteed. Our firm, employees, and customers may effect transactions, including transactions contrary to any recommendation herein, or have positions in the securities mentioned herein or options with respect thereto. Any recommendation contained in this report may not be suitable for all investors and it is not to be deemed an offer or solicitation on our part with respect to the purchase or sale of any securities. |
|
 |
Retail, Tech, and Defensive Groups Led Gainers
Kenneth J. Gruneisen - Passed the CAN SLIM® Master's Exam
The Retail Index ($RLX +1.85%) posted a solid gain and the Bank Index ($BKX +0.96%) also was a positive influence on the major averages, yet the Broker/Dealer Index ($XBD +0.11%) only edged higher. The Biotechnology Index ($BTK +2.83%) led the tech sector higher, and the Networking Index ($NWX +0.73%) and Internet Index ($IIX +0.73%) followed with smaller gains, but the Semiconductor Index ($SOX +0.04%) finished flat. Defensive groups posted solid gains as the Healthcare Index ($HMO +1.43%) and Gold & Silver Index ($XAU +1.83%) both were on the rise. Energy-related shares were mixed as the Oil Services Index ($OSX -0.63%) fell and the Integrated Oil Index ($XOI +0.31%) posted a small gain.
Charts courtesy www.stockcharts.com
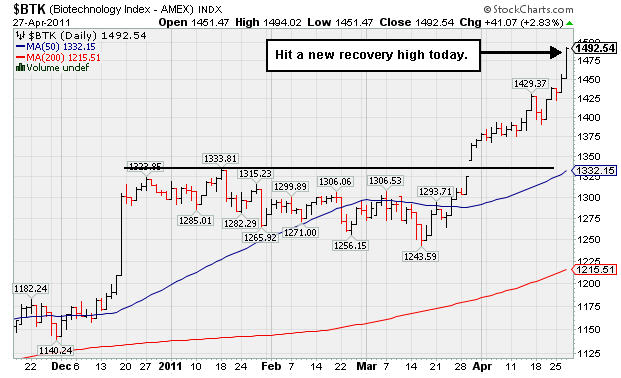
PICTURED: The Biotechnology Index ($BTK +2.83%) hit a new recovery high today.
| Oil Services |
$OSX |
287.41 |
-1.82 |
-0.63% |
+17.25% |
| Healthcare |
$HMO |
2,299.41 |
+32.44 |
+1.43% |
+35.90% |
| Integrated Oil |
$XOI |
1,375.19 |
+4.28 |
+0.31% |
+13.36% |
| Semiconductor |
$SOX |
450.64 |
+0.16 |
+0.04% |
+9.43% |
| Networking |
$NWX |
341.51 |
+2.48 |
+0.73% |
+21.73% |
| Internet |
$IIX |
328.56 |
+2.40 |
+0.73% |
+6.77% |
| Broker/Dealer |
$XBD |
121.29 |
+0.13 |
+0.11% |
-0.19% |
| Retail |
$RLX |
542.72 |
+9.86 |
+1.85% |
+6.75% |
| Gold & Silver |
$XAU |
222.02 |
+3.98 |
+1.83% |
-2.01% |
| Bank |
$BKX |
51.40 |
+0.49 |
+0.96% |
-1.55% |
| Biotech |
$BTK |
1,492.54 |
+41.06 |
+2.83% |
+15.02% |
|
|
|
 |
New All-Time High After Another Volume-Driven Gain
Kenneth J. Gruneisen - Passed the CAN SLIM® Master's Exam
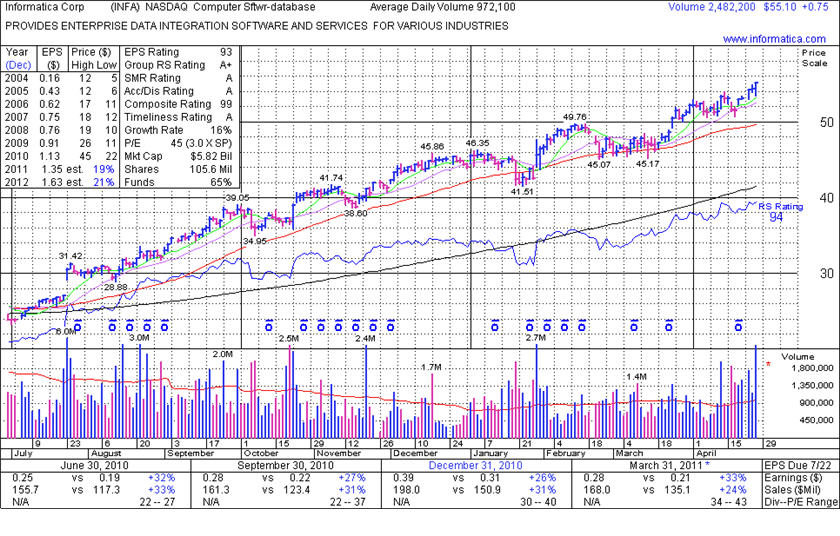
Informatica Corp. (INFA +$0.75 or +1.38% to $55.10) finished at the session high today with a 5th consecutive gain with above average volume for yet another new 52-week high. It is extended from its latest sound base pattern. Disciplined investors may watch for secondary buy points to develop. It reported +33% earnings on +24% sales revenues for the quarter ended March 31, 2011 versus the year ago period. Prior highs in the $49 area define support to watch coinciding with its 50-day moving average (DMA) line. Since its last appearance in this FSU section with an annotated graph on 3/28/11 under the headline, "Quiet Pullback Following Breakout With Near Minimum Volume", it stubbornly held its ground and rallied higher.
In the 3/24/11 mid-day report this Redwood City, CA-based Computer Software - Database firm was highlighted in yellow and noted for having strong characteristics. The Jun, Sep, and Dec '10 earnings increases were all above the +25% minimum guidelines, and it has maintained a steady annual earnings (A criteria) history. The number of top-rated funds owning its shares rose from 634 in Mar '10 to 678 in Mar '11, a reassuring sign concerning the I criteria.
|
|
|
Color Codes Explained :
Y - Better candidates highlighted by our
staff of experts.
G - Previously featured
in past reports as yellow but may no longer be buyable under the
guidelines.
***Last / Change / Volume data in this table is the closing quote data***
Symbol/Exchange
Company Name
Industry Group |
PRICE |
CHANGE
(%Change) |
Day High |
Volume
(% DAV)
(% 50 day avg vol) |
52 Wk Hi
% From Hi |
Featured
Date |
Price
Featured |
Pivot Featured |
|
Max Buy |
AIXG
-
NASDAQ
Aixtron Se
ELECTRONICS - Semiconductor Equipment andamp; Mate
|
$43.66
|
+1.18
2.78% |
$43.66
|
444,511
178.30% of 50 DAV
50 DAV is 249,300
|
$44.96
-2.89%
|
4/5/2011
|
$44.14
|
PP = $44.64
|
|
MB = $46.87
|
 Most Recent Note - 4/27/2011 11:59:58 AM
G - Consolidating near its 50 DMA line, perched only -5.6% off its all-time high. Rebound above its 50 DMA was noted as a technical improvement that helps its outlook after it recently found support near prior lows in the $38 area.
>>> The latest Featured Stock Update with an annotated graph appeared on 4/5/2011. Click here.
View all notes |
Alert me of new notes |
CANSLIM.net Company Profile |
SEC |
Zacks Reports |
StockTalk |
News |
Chart |
Request a new note
C
A N
S L
I M


|
BIDU
-
NASDAQ
Baidu Inc Ads
INTERNET - Internet Information Providers
|
$151.11
|
-1.26
-0.83% |
$153.67
|
11,999,567
172.34% of 50 DAV
50 DAV is 6,962,900
|
$152.77
-1.09%
|
3/17/2011
|
$121.97
|
PP = $131.73
|
|
MB = $138.32
|
Most Recent Note - 4/27/2011 12:15:29 PM
G - Perched at an all-time high, extended from its latest base. Prior high near $131 defines initial chart support to watch near its rising 50 DMA line.
>>> The latest Featured Stock Update with an annotated graph appeared on 4/7/2011. Click here.
View all notes |
Alert me of new notes |
CANSLIM.net Company Profile |
SEC |
Zacks Reports |
StockTalk |
News |
Chart |
Request a new note
C
A N
S L
I M
|
CMG
-
NYSE
Chipotle Mexican Grill
LEISURE - Restaurants
|
$263.00
|
-1.94
-0.73% |
$268.90
|
8,272,083
799.31% of 50 DAV
50 DAV is 1,034,900
|
$289.35
-9.11%
|
4/1/2011
|
$274.00
|
PP = $275.10
|
|
MB = $288.86
|
Most Recent Note - 4/27/2011 4:59:48 PM
G - Small loss today came on 8 times average volume while it nearly tested its 50 DMA line ($261.81 now), an important chart support level. Recently negated its latest technical breakout. Gapped down on 4/21/11 after reporting earnings +23% on +24% sales revenues for the quarter ended March 31, 2011 versus the year ago period, its weakest earnings increase in years, and below the +25% guideline.
>>> The latest Featured Stock Update with an annotated graph appeared on 4/13/2011. Click here.
View all notes |
Alert me of new notes |
CANSLIM.net Company Profile |
SEC |
Zacks Reports |
StockTalk |
News |
Chart |
Request a new note
C
A N
S L
I M
|
CTCT
-
NASDAQ
Constant Contact Inc
MEDIA - Advertising Services
|
$30.98
|
-0.18
-0.58% |
$31.47
|
246,658
53.90% of 50 DAV
50 DAV is 457,600
|
$36.33
-14.73%
|
3/22/2011
|
$33.59
|
PP = $32.49
|
|
MB = $34.11
|
Most Recent Note - 4/27/2011 5:18:28 PM
G - Still lingering below its 50 DMA line since triggering worrisome technical sell signals with damaging losses on heavy volume just over a week ago. Due to report earnings after the close on Thursday, April 28th.
>>> The latest Featured Stock Update with an annotated graph appeared on 4/19/2011. Click here.
View all notes |
Alert me of new notes |
CANSLIM.net Company Profile |
SEC |
Zacks Reports |
StockTalk |
News |
Chart |
Request a new note
C
A N
S L
I M
|
CTSH
-
NASDAQ
Cognizant Tech Sol Cl A
COMPUTER SOFTWARE and SERVICES - Business Software and Services
|
$81.79
|
-0.16
-0.20% |
$82.14
|
2,262,449
103.77% of 50 DAV
50 DAV is 2,180,200
|
$82.93
-1.37%
|
2/7/2011
|
$75.09
|
PP = $76.46
|
|
MB = $80.28
|
Most Recent Note - 4/27/2011 5:23:06 PM
G - Holding its ground -1.4% off its all-time high. Reporting earnings on Tuesday, May 3rd before the open. Last week it tested prior highs in the $77-78 area and its 50 DMA line and found prompt support.
>>> The latest Featured Stock Update with an annotated graph appeared on 4/15/2011. Click here.
View all notes |
Alert me of new notes |
CANSLIM.net Company Profile |
SEC |
Zacks Reports |
StockTalk |
News |
Chart |
Request a new note
C
A N
S L
I M
|
Symbol/Exchange
Company Name
Industry Group |
PRICE |
CHANGE
(%Change) |
Day High |
Volume
(% DAV)
(% 50 day avg vol) |
52 Wk Hi
% From Hi |
Featured
Date |
Price
Featured |
Pivot Featured |
|
Max Buy |
DECK
-
NASDAQ
Deckers Outdoor Corp
CONSUMER NON-DURABLES - Textile - Apparel Footwear
|
$96.72
|
+1.21
1.27% |
$96.86
|
740,024
56.10% of 50 DAV
50 DAV is 1,319,200
|
$97.00
-0.29%
|
2/3/2011
|
$79.61
|
PP = $82.67
|
|
MB = $86.80
|
Most Recent Note - 4/27/2011 5:24:53 PM
G - Gain today with below average volume for a best ever close. Gains on light volume have been noted while rising from a shorter than minimum length "cup-with-handle" type consolidation. Its 50 DMA line defines initial chart support to watch.
>>> The latest Featured Stock Update with an annotated graph appeared on 4/6/2011. Click here.
View all notes |
Alert me of new notes |
CANSLIM.net Company Profile |
SEC |
Zacks Reports |
StockTalk |
News |
Chart |
Request a new note
C
A N
S L
I M
|
EZPW
-
NASDAQ
Ezcorp Inc Cl A
SPECIALTY RETAIL - Specialty Retail, Other
|
$30.51
|
+0.25
0.83% |
$30.64
|
384,870
104.87% of 50 DAV
50 DAV is 367,000
|
$33.08
-7.77%
|
2/18/2011
|
$27.94
|
PP = $30.04
|
|
MB = $31.54
|
Most Recent Note - 4/25/2011 7:24:57 PM
G - Closed near the session low after gapping up today, posting its 4th consecutive gain with volume increasing to above average. Reported earnings +31% on +21% sales revenues for the quarter ended March 31, 2011 versus the year ago period. Last week it rebounded above its 50 DMA line and prior highs in the $29-30 area, helping its outlook.
>>> The latest Featured Stock Update with an annotated graph appeared on 4/11/2011. Click here.
View all notes |
Alert me of new notes |
CANSLIM.net Company Profile |
SEC |
Zacks Reports |
StockTalk |
News |
Chart |
Request a new note
C
A N
S L
I M
|
FOSL
-
NASDAQ
Fossil Inc
CONSUMER DURABLES - Recreational Goods, Other
|
$95.52
|
-0.37
-0.39% |
$96.37
|
775,028
79.39% of 50 DAV
50 DAV is 976,200
|
$96.99
-1.52%
|
2/1/2011
|
$73.30
|
PP = $74.44
|
|
MB = $78.16
|
Most Recent Note - 4/27/2011 5:28:24 PM
G - Stubbornly holding its ground with volume totals cooling while perched near its all-time high. Previously noted - "It rallied more than +108% higher in 8 months since first featured in yellow in the 8/10/10 mid-day report (read here). It could produce more climactic gains, but recently it has been noted - "Extended from any sound base. Prior highs in the $83-85 area define chart support to watch above its 50 DMA line."
>>> The latest Featured Stock Update with an annotated graph appeared on 3/30/2011. Click here.
View all notes |
Alert me of new notes |
CANSLIM.net Company Profile |
SEC |
Zacks Reports |
StockTalk |
News |
Chart |
Request a new note
C
A N
S L
I M
|
HMSY
-
NASDAQ
H M S Holdings Corp
COMPUTER SOFTWARE and SERVICES - Healthcare Information Service
|
$80.81
|
+0.28
0.35% |
$82.86
|
175,480
104.64% of 50 DAV
50 DAV is 167,700
|
$84.82
-4.73%
|
11/19/2010
|
$61.89
|
PP = $63.01
|
|
MB = $66.16
|
Most Recent Note - 4/26/2011 7:32:23 PM
G - Gapped up today but the reversed into the red and closed near the session low -5.1% below its all-time high. Due to report earnings before the open on Friday April 29th. See the latest FSU analysis for more details and a new annotated graph.
>>> The latest Featured Stock Update with an annotated graph appeared on 4/26/2011. Click here.
View all notes |
Alert me of new notes |
CANSLIM.net Company Profile |
SEC |
Zacks Reports |
StockTalk |
News |
Chart |
Request a new note
C
A N
S L
I M
|
HS
-
NYSE
Healthspring Inc
HEALTH SERVICES - Health Care Plans
|
$40.24
|
-0.36
-0.89% |
$40.87
|
731,327
83.03% of 50 DAV
50 DAV is 880,800
|
$40.78
-1.32%
|
3/22/2011
|
$38.29
|
PP = $38.85
|
|
MB = $40.79
|
Most Recent Note - 4/26/2011 4:33:29 PM
Y - Gapped up today for a gain with slightly below average volume for a new high close, approaching its "max buy" level. Its 50 DMA line ($37.52 now) defines important support above recent lows in the $35.50 area.
>>> The latest Featured Stock Update with an annotated graph appeared on 4/21/2011. Click here.
View all notes |
Alert me of new notes |
CANSLIM.net Company Profile |
SEC |
Zacks Reports |
StockTalk |
News |
Chart |
Request a new note
C
A N
S L
I M
|
Symbol/Exchange
Company Name
Industry Group |
PRICE |
CHANGE
(%Change) |
Day High |
Volume
(% DAV)
(% 50 day avg vol) |
52 Wk Hi
% From Hi |
Featured
Date |
Price
Featured |
Pivot Featured |
|
Max Buy |
INFA
-
NASDAQ
Informatica Corp
COMPUTER SOFTWARE and SERVICES - Business Software and Services
|
$55.10
|
+0.75
1.38% |
$55.10
|
2,485,020
255.63% of 50 DAV
50 DAV is 972,100
|
$54.27
1.53%
|
3/24/2011
|
$50.04
|
PP = $49.86
|
|
MB = $52.35
|
Most Recent Note - 4/27/2011 5:07:42 PM
G - Finished at the session high today with a 5th consecutive gain with above average volume for a new 52-week high. Reported +33% earnings on +24% sales revenues for the quarter ended March 31, 2011 versus the year ago period. Prior highs in the $49 area define support to watch coinciding with its 50 DMA line.
>>> The latest Featured Stock Update with an annotated graph appeared on 4/27/2011. Click here.
View all notes |
Alert me of new notes |
CANSLIM.net Company Profile |
SEC |
Zacks Reports |
StockTalk |
News |
Chart |
Request a new note
C
A N
S L
I M
|
LULU
-
NASDAQ
Lululemon Athletica
MANUFACTURING - Textile Manufacturing
|
$100.48
|
+1.86
1.89% |
$100.86
|
1,850,141
82.30% of 50 DAV
50 DAV is 2,248,100
|
$102.83
-2.28%
|
3/28/2011
|
$68.11
|
PP = $85.38
|
|
MB = $89.65
|
Most Recent Note - 4/27/2011 4:50:48 PM
G - Perched near its all-time high, this high-ranked Retail-Apparel firm is extended from any sound base pattern. Prior highs and its 50 DMA line in the $85 area define important chart support to watch.
>>> The latest Featured Stock Update with an annotated graph appeared on 3/31/2011. Click here.
View all notes |
Alert me of new notes |
CANSLIM.net Company Profile |
SEC |
Zacks Reports |
StockTalk |
News |
Chart |
Request a new note
C
A N
S L
I M
|
MG
-
NYSE
Mistras Group Inc
DIVERSIFIED SERVICES - Bulding and Faci;ity Management Services
|
$18.25
|
-0.06
-0.33% |
$18.37
|
90,620
70.14% of 50 DAV
50 DAV is 129,200
|
$18.40
-0.81%
|
3/15/2011
|
$15.48
|
PP = $15.90
|
|
MB = $16.70
|
Most Recent Note - 4/27/2011 5:34:52 PM
G - Stubbornly holding its ground, extended from any sound base pattern. Its 50 DMA line and prior highs define important support to watch.
>>> The latest Featured Stock Update with an annotated graph appeared on 4/12/2011. Click here.
View all notes |
Alert me of new notes |
CANSLIM.net Company Profile |
SEC |
Zacks Reports |
StockTalk |
News |
Chart |
Request a new note
C
A N
S L
I M
|
MWIV
-
NASDAQ
M W I Veterinary Supply
HEALTH SERVICES - Medical Instruments and; Supplies
|
$81.00
|
+0.76
0.95% |
$82.06
|
110,828
108.12% of 50 DAV
50 DAV is 102,500
|
$84.97
-4.67%
|
11/4/2010
|
$61.79
|
PP = $59.60
|
|
MB = $62.58
|
Most Recent Note - 4/25/2011 12:09:16 PM
G - Pulling back today from the new all-time high hit on the prior session. Since first featured in yellow on 7/29/10 it has traded as much as +63% higher. Extended from any sound base pattern, its 50 DMA line defines important support to watch.
>>> The latest Featured Stock Update with an annotated graph appeared on 4/8/2011. Click here.
View all notes |
Alert me of new notes |
CANSLIM.net Company Profile |
SEC |
Zacks Reports |
StockTalk |
News |
Chart |
Request a new note
C
A N
S L
I M
|
OPEN
-
NASDAQ
Opentable Inc
INTERNET - Internet Software and Services
|
$110.67
|
+1.97
1.81% |
$111.35
|
787,389
65.76% of 50 DAV
50 DAV is 1,197,300
|
$118.66
-6.73%
|
3/17/2011
|
$90.71
|
PP = $96.07
|
|
MB = $100.87
|
Most Recent Note - 4/26/2011 3:57:59 PM
G - Down today on heavy volume. Reporting earnings on Tuesday, May 3rd for the quarter ended March 31, 2011. Repeatedly noted - "Extended from its latest base. Prior highs near $96 and its 50 DMA line define support to watch on pullbacks.
>>> The latest Featured Stock Update with an annotated graph appeared on 4/25/2011. Click here.
View all notes |
Alert me of new notes |
CANSLIM.net Company Profile |
SEC |
Zacks Reports |
StockTalk |
News |
Chart |
Request a new note
C
A N
S L
I M
|
Symbol/Exchange
Company Name
Industry Group |
PRICE |
CHANGE
(%Change) |
Day High |
Volume
(% DAV)
(% 50 day avg vol) |
52 Wk Hi
% From Hi |
Featured
Date |
Price
Featured |
Pivot Featured |
|
Max Buy |
PAY
-
NYSE
Verifone Systems Inc
COMPUTER HARDWARE - Transaction Automation Systems
|
$53.74
|
+0.93
1.76% |
$54.02
|
2,519,431
102.46% of 50 DAV
50 DAV is 2,458,900
|
$58.88
-8.73%
|
1/27/2011
|
$41.77
|
PP = $44.97
|
|
MB = $47.22
|
Most Recent Note - 4/26/2011 4:01:25 PM
G - Reversed into the red after an early gain today. Its 50 DMA line ($51.22 now) defines important chart support to watch.
>>> The latest Featured Stock Update with an annotated graph appeared on 4/4/2011. Click here.
View all notes |
Alert me of new notes |
CANSLIM.net Company Profile |
SEC |
Zacks Reports |
StockTalk |
News |
Chart |
Request a new note
C
A N
S L
I M
|
PCLN
-
NASDAQ
Priceline.Com Inc
INTERNET - Internet Software and Services
|
$539.45
|
+1.76
0.33% |
$544.56
|
729,274
62.08% of 50 DAV
50 DAV is 1,174,800
|
$547.91
-1.54%
|
1/3/2011
|
$399.55
|
PP = $428.20
|
|
MB = $449.61
|
Most Recent Note - 4/27/2011 5:37:39 PM
G - Stubbornly holding its ground near its 52-week high with volume totals cooling. It may go on to produce more climactic gains, yet it has been repeatedly noted - "Extended from any sound base pattern. Its 50 DMA line has defined support throughout its advance."
>>> The latest Featured Stock Update with an annotated graph appeared on 4/20/2011. Click here.
View all notes |
Alert me of new notes |
CANSLIM.net Company Profile |
SEC |
Zacks Reports |
StockTalk |
News |
Chart |
Request a new note
C
A N
S L
I M
|
RAX
-
NYSE
Rackspace Hosting Inc
INTERNET - Internet Software and; Services
|
$45.80
|
+1.86
4.23% |
$45.93
|
2,140,153
131.69% of 50 DAV
50 DAV is 1,625,100
|
$45.41
0.86%
|
3/16/2011
|
$36.28
|
PP = $40.72
|
|
MB = $42.76
|
Most Recent Note - 4/27/2011 4:45:46 PM
G - Rallied for a new all-time high today, getting more extended from any sound base. Prior highs near $40 define support above its 50 DMA line.
>>> The latest Featured Stock Update with an annotated graph appeared on 4/18/2011. Click here.
View all notes |
Alert me of new notes |
CANSLIM.net Company Profile |
SEC |
Zacks Reports |
StockTalk |
News |
Chart |
Request a new note
C
A N
S L
I M
|
TIBX
-
NASDAQ
Tibco Software Inc
COMPUTER SOFTWARE and SERVICES - Business Software and Services
|
$29.83
|
+0.33
1.12% |
$29.85
|
2,029,038
83.27% of 50 DAV
50 DAV is 2,436,600
|
$29.98
-0.50%
|
3/18/2011
|
$23.88
|
PP = $26.04
|
|
MB = $27.34
|
Most Recent Note - 4/27/2011 5:16:43 PM
G - Quietly holding its ground near its all-time high, extended from any sound base after a spurt of volume-driven gains. As previously noted, support is defined by prior highs in the $25-26 area and its 50 DMA line.
>>> The latest Featured Stock Update with an annotated graph appeared on 4/14/2011. Click here.
View all notes |
Alert me of new notes |
CANSLIM.net Company Profile |
SEC |
Zacks Reports |
StockTalk |
News |
Chart |
Request a new note
C
A N
S L
I M
|
UA
-
NYSE
Under Armour Inc Cl A
CONSUMER NON-DURABLES - Textile - Apparel Clothing
|
$70.05
|
+0.41
0.59% |
$70.40
|
1,730,272
208.69% of 50 DAV
50 DAV is 829,100
|
$80.00
-12.44%
|
3/31/2011
|
$68.04
|
PP = $70.79
|
|
MB = $74.33
|
Most Recent Note - 4/27/2011 5:13:21 PM
G - Held its ground at its 50 DMA line and prior chart highs today. It was down considerably with heavy volume on 4/26/11 after reporting earnings +64% on +36% sales revenues for the quarter ended March 31, 2011 versus the year ago period.
>>> The latest Featured Stock Update with an annotated graph appeared on 4/1/2011. Click here.
View all notes |
Alert me of new notes |
CANSLIM.net Company Profile |
SEC |
Zacks Reports |
StockTalk |
News |
Chart |
Request a new note
C
A N
S L
I M
|
Symbol/Exchange
Company Name
Industry Group |
PRICE |
CHANGE
(%Change) |
Day High |
Volume
(% DAV)
(% 50 day avg vol) |
52 Wk Hi
% From Hi |
Featured
Date |
Price
Featured |
Pivot Featured |
|
Max Buy |
ULTA
-
NASDAQ
Ulta Salon Cosm & Frag
SPECIALTY RETAIL - Specialty Retail, Other
|
$52.91
|
+0.34
0.65% |
$53.08
|
326,756
52.56% of 50 DAV
50 DAV is 621,700
|
$53.99
-2.00%
|
1/6/2011
|
$36.12
|
PP = $37.34
|
|
MB = $39.21
|
Most Recent Note - 4/27/2011 5:14:39 PM
G - Holding its ground stubbornly near its all-time high. It has been noted as extended from any sound base. Its 50 DMA line defines chart support to watch well above prior highs.
>>> The latest Featured Stock Update with an annotated graph appeared on 3/29/2011. Click here.
View all notes |
Alert me of new notes |
CANSLIM.net Company Profile |
SEC |
Zacks Reports |
StockTalk |
News |
Chart |
Request a new note
C
A N
S L
I M
|
|
|
|
THESE ARE NOT BUY RECOMMENDATIONS!
Comments contained in the body of this report are technical
opinions only. The material herein has been obtained
from sources believed to be reliable and accurate, however,
its accuracy and completeness cannot be guaranteed.
This site is not an investment advisor, hence it does
not endorse or recommend any securities or other investments.
Any recommendation contained in this report may not
be suitable for all investors and it is not to be deemed
an offer or solicitation on our part with respect to
the purchase or sale of any securities. All trademarks,
service marks and trade names appearing in this report
are the property of their respective owners, and are
likewise used for identification purposes only.
This report is a service available
only to active Paid Premium Members.
You may opt-out of receiving report notifications
at any time. Questions or comments may be submitted
by writing to Premium Membership Services 665 S.E. 10 Street, Suite 201 Deerfield Beach, FL 33441-5634 or by calling 1-800-965-8307
or 954-785-1121.
|
|
|

