You are not logged in.
This means you
CAN ONLY VIEW reports that were published prior to Tuesday, April 15, 2025.
You
MUST UPGRADE YOUR MEMBERSHIP if you want to see any current reports.
AFTER MARKET UPDATE - TUESDAY, APRIL 26TH, 2011
Previous After Market Report Next After Market Report >>>
|
|
|
|
DOW |
+115.49 |
12,595.37 |
+0.93% |
|
Volume |
909,567,980 |
+30% |
|
Volume |
1,982,357,000 |
+37% |
|
NASDAQ |
+21.66 |
2,847.54 |
+0.77% |
|
Advancers |
2,202 |
70% |
|
Advancers |
1,663 |
61% |
|
S&P 500 |
+11.99 |
1,347.24 |
+0.90% |
|
Decliners |
850 |
27% |
|
Decliners |
957 |
35% |
|
Russell 2000 |
+8.81 |
853.04 |
+1.04% |
|
52 Wk Highs |
318 |
|
|
52 Wk Highs |
158 |
|
|
S&P 600 |
+5.65 |
451.84 |
+1.27% |
|
52 Wk Lows |
6 |
|
|
52 Wk Lows |
28 |
|
|
 |
Indices Rally To New Recovery Highs
Kenneth J. Gruneisen - Passed the CAN SLIM® Master's Exam
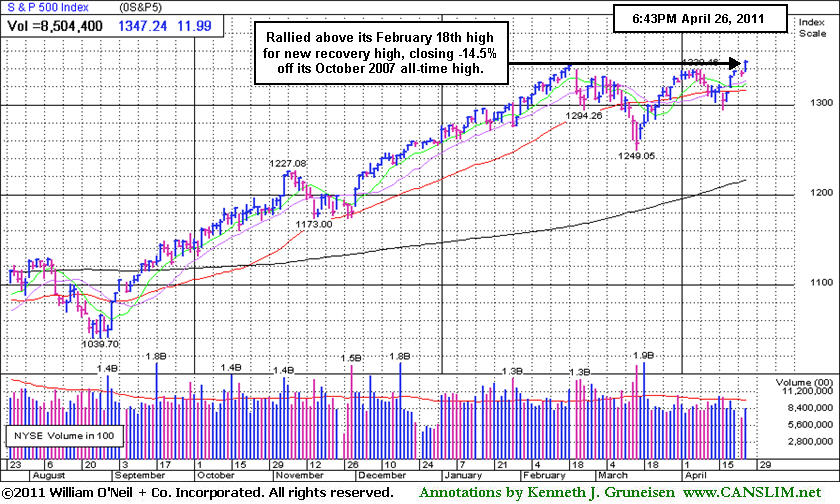
The major averages soared to new recovery highs as volume totals increased on both major exchanges, action clearly indicative of institutional buying demand or accumulation. Advancing issues beat decliners by 5-2 on the NYSE and by 2-1 on the Nasdaq. New 52-week highs solidly outnumbered new 52-week lows on the NYSE and on the Nasdaq exchange, and on the NYSE new 52-week lows sank into the single digits again. There were 86 high-ranked companies from the CANSLIM.net Leaders List that made new 52-week highs and appeared on the CANSLIM.net BreakOuts Page, up from the total of 65 on the prior session. The companies currently listed on the Featured Stocks Page diverged from the broader market, however, as there were gains from only 5 of the 21 high-ranked market leaders currently listed.
The Federal Reserve Board began a two-day policy meeting during which it will decide whether to continue with its planned $600 billion of bond purchases through June. On Wednesday it release a policy statement and a news conference hosted by Fed Chairman Ben Bernanke will mark the first time since the central bank was founded in 1913 that the head of the Fed will hold a news conference just hours after making a decision on interest rates.
The news on the housing industry continues to be depressed. A survey of twenty major U.S. cities showed that residential real estate prices dropped in February by 3.3% on an annual basis, the most in more than a year. The market also celebrated a bigger-than-expected rise in the April consumer confidence index. The report was a sign the labor market is improving.
Strong earnings also helped underpin the rally on Wall Street. First quarter earnings have beaten estimates at nearly 80% of S&P 500 companies reporting so far. Major names like Ford Motor Company (F +0.77%), 3-M Co (MMM +1.93%), and United Parcel Service, Inc (UPS +0.90%) all posted better-than-expected profits, and IBM joined the party by boosting its dividend and share buyback plan. Keep in mind that earnings reports will continue to be a factor, and volume and volatility are often greater near earnings announcements.
PICTURED: The S&P 500 Index rose above its February 18, 2011 high and reached its highest level since June of 2008, and is up more than 7% from its 2011 low. It is now perched -14.5% below its October 2007 all-time high.
|
 Kenneth J. Gruneisen started out as a licensed stockbroker in August 1987, a couple of months prior to the historic stock market crash that took the Dow Jones Industrial Average down -22.6% in a single day. He has published daily fact-based fundamental and technical analysis on high-ranked stocks online for two decades. Through FACTBASEDINVESTING.COM, Kenneth provides educational articles, news, market commentary, and other information regarding proven investment systems that work in good times and bad.
Comments contained in the body of this report are technical opinions only and are not necessarily those of Gruneisen Growth Corp. The material herein has been obtained from sources believed to be reliable and accurate, however, its accuracy and completeness cannot be guaranteed. Our firm, employees, and customers may effect transactions, including transactions contrary to any recommendation herein, or have positions in the securities mentioned herein or options with respect thereto. Any recommendation contained in this report may not be suitable for all investors and it is not to be deemed an offer or solicitation on our part with respect to the purchase or sale of any securities. |
|
 |
Healthcare, Bank, and Some Tech Groups Gain Ground
Kenneth J. Gruneisen - Passed the CAN SLIM® Master's Exam
The Healthcare Index ($HMO +2.14%) was a standout gainer on Tuesday and the Biotechnology Index ($BTK +1.37%) and Semiconductor Index ($SOX +1.59%) led the tech sector. The Retail Index ($RLX -0.09%), Internet Index ($IIX -0.03%), and Networking Index ($NWX -0.17%) inched lower. The Bank Index ($BKX +0.85%) outpaced the Broker/Dealer Index ($XBD +0.15%). Energy-related groups posted gains as the Oil Services Index ($OSX +0.39%) and Integrated Oil Index ($XOI +0.81%) ended higher. The Gold & Silver Index ($XAU -0.95%) was a clear laggard on the mostly positive session.
Charts courtesy www.stockcharts.com
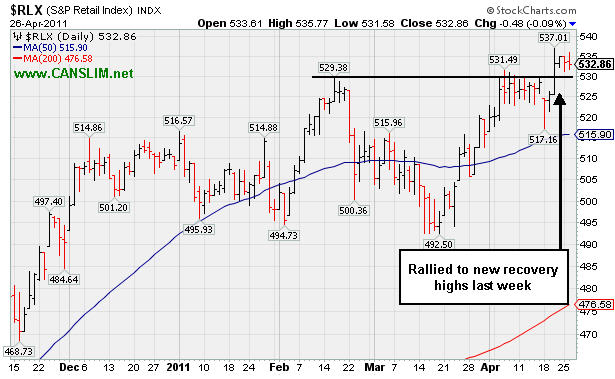
PICTURED: The Retail Index ($RLX -0.09%) rallied to new recovery highs last week. Despite the high gas prices, high unemployment, and worrisome government deficits the strength in retail shares is a reassuring sign that the consumer is still alive and spending.
| Oil Services |
$OSX |
289.23 |
+1.11 |
+0.39% |
+18.00% |
| Healthcare |
$HMO |
2,266.97 |
+47.54 |
+2.14% |
+33.98% |
| Integrated Oil |
$XOI |
1,370.91 |
+11.01 |
+0.81% |
+13.00% |
| Semiconductor |
$SOX |
450.48 |
+7.07 |
+1.59% |
+9.39% |
| Networking |
$NWX |
339.03 |
-0.58 |
-0.17% |
+20.84% |
| Internet |
$IIX |
326.17 |
-0.11 |
-0.03% |
+5.99% |
| Broker/Dealer |
$XBD |
121.16 |
+0.18 |
+0.15% |
-0.29% |
| Retail |
$RLX |
532.86 |
-0.48 |
-0.09% |
+4.82% |
| Gold & Silver |
$XAU |
218.04 |
-2.10 |
-0.95% |
-3.77% |
| Bank |
$BKX |
50.91 |
+0.43 |
+0.85% |
-2.49% |
| Biotech |
$BTK |
1,451.47 |
+19.60 |
+1.37% |
+11.86% |
|
|
|
 |
Consolidating Above 50-Day Average Ahead Of Earnings News
Kenneth J. Gruneisen - Passed the CAN SLIM® Master's Exam
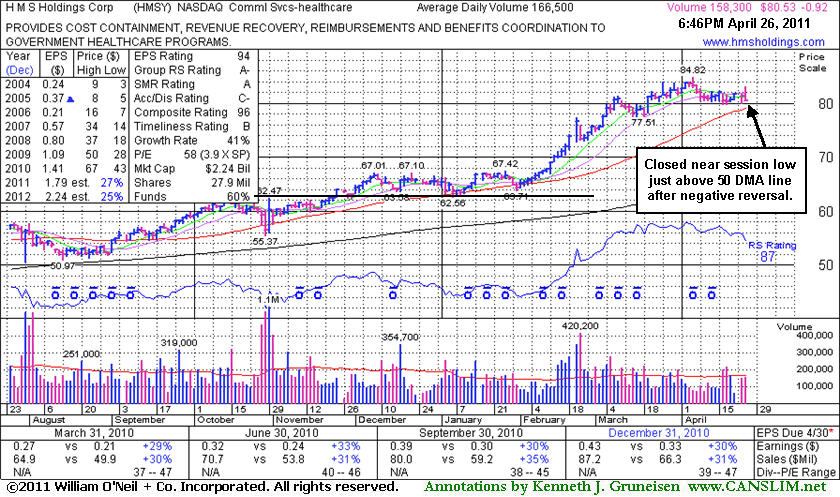
H M S Holdings Corp (HMSY -$0.92 or -1.13% to $80.53) gapped up today, then reversed into the red and closed near the session low. It is quietly perched -5.1% below its all-time high. Before the market open on Friday, April 29, 2011 it will report the financial results for the first quarter 2011 which ended March 31. Volume and volatility often increase near earnings news. Its short consolidation above its 50-day moving average (DMA) line ($79.08 now) is not a long enough period to be considered a sound new base pattern. Disciplined investors may watch for a new base to form and be noted in the future. In just over 26 months since it was first featured at $34.08 in the February 20, 2009 mid-day report when clearing an ascending base pattern it has traded up as much as +148.8% higher.
Volume totals have mostly been light or near average since its last appearance in this FSU section on 3/25/11 with an annotated graph under the headline, "Distributional Pressure Evident While Advancing". This Commercial Services - Healthcare firm has maintained a solid sales revenues and earnings growth history that still satisfies the C and A criteria. The number of top-rated funds owning its shares has risen from 462 in Mar '10 to 504 in Mar '11, a very reassuring sign concerning the I criteria.
|
|
|
Color Codes Explained :
Y - Better candidates highlighted by our
staff of experts.
G - Previously featured
in past reports as yellow but may no longer be buyable under the
guidelines.
***Last / Change / Volume data in this table is the closing quote data***
Symbol/Exchange
Company Name
Industry Group |
PRICE |
CHANGE
(%Change) |
Day High |
Volume
(% DAV)
(% 50 day avg vol) |
52 Wk Hi
% From Hi |
Featured
Date |
Price
Featured |
Pivot Featured |
|
Max Buy |
AIXG
-
NASDAQ
Aixtron Se
ELECTRONICS - Semiconductor Equipment andamp; Mate
|
$42.48
|
+0.80
1.92% |
$42.64
|
274,719
108.54% of 50 DAV
50 DAV is 253,100
|
$44.96
-5.52%
|
4/5/2011
|
$44.14
|
PP = $44.64
|
|
MB = $46.87
|
 Most Recent Note - 4/26/2011 4:29:03 PM
G - Up today with slightly higher than average volume, closing above its 50 DMA line, a technical improvement that helps its outlook. Recently found support near prior lows in the $38 area.
>>> The latest Featured Stock Update with an annotated graph appeared on 4/5/2011. Click here.
View all notes |
Alert me of new notes |
CANSLIM.net Company Profile |
SEC |
Zacks Reports |
StockTalk |
News |
Chart |
Request a new note
C
A N
S L
I M


|
BIDU
-
NASDAQ
Baidu Inc Ads
INTERNET - Internet Information Providers
|
$152.37
|
+0.41
0.27% |
$154.89
|
8,689,338
124.57% of 50 DAV
50 DAV is 6,975,200
|
$152.77
-0.26%
|
3/17/2011
|
$121.97
|
PP = $131.73
|
|
MB = $138.32
|
Most Recent Note - 4/25/2011 7:20:16 PM
G - Up on light volume today for another new high close. It is extended from its latest base, and the prior high near $131 defines initial chart support to watch near its rising 50 DMA line.
>>> The latest Featured Stock Update with an annotated graph appeared on 4/7/2011. Click here.
View all notes |
Alert me of new notes |
CANSLIM.net Company Profile |
SEC |
Zacks Reports |
StockTalk |
News |
Chart |
Request a new note
C
A N
S L
I M
|
CMG
-
NYSE
Chipotle Mexican Grill
LEISURE - Restaurants
|
$264.94
|
-7.71
-2.83% |
$273.88
|
1,163,282
98.44% of 50 DAV
50 DAV is 1,181,700
|
$289.35
-8.44%
|
4/1/2011
|
$274.00
|
PP = $275.10
|
|
MB = $288.86
|
Most Recent Note - 4/26/2011 4:07:25 PM
G - Down today on higher volume, slumping toward its 50 DMA line ($261.94 now), an important chart support level. Recently negated its latest technical breakout. Gapped down on 4/21/11 after reporting earnings +23% on +24% sales revenues for the quarter ended March 31, 2011 versus the year ago period, its weakest earnings increase in years, and below the +25% guideline.
>>> The latest Featured Stock Update with an annotated graph appeared on 4/13/2011. Click here.
View all notes |
Alert me of new notes |
CANSLIM.net Company Profile |
SEC |
Zacks Reports |
StockTalk |
News |
Chart |
Request a new note
C
A N
S L
I M
|
CTCT
-
NASDAQ
Constant Contact Inc
MEDIA - Advertising Services
|
$31.16
|
-0.01
-0.03% |
$31.39
|
398,415
87.24% of 50 DAV
50 DAV is 456,700
|
$36.33
-14.23%
|
3/22/2011
|
$33.59
|
PP = $32.49
|
|
MB = $34.11
|
Most Recent Note - 4/20/2011 5:42:52 PM
G - Small gain today with light volume following 2 damaging losses with heavy volume in prior 3 sessions. Concerns were raised as it completely negated its recent breakout, slumping below its 50 DMA line again and triggering worrisome technical sell signals. Due to report earnings after the close on Thursday, April 28th. See the latest FSU analysis for details and a new annotated graph.
>>> The latest Featured Stock Update with an annotated graph appeared on 4/19/2011. Click here.
View all notes |
Alert me of new notes |
CANSLIM.net Company Profile |
SEC |
Zacks Reports |
StockTalk |
News |
Chart |
Request a new note
C
A N
S L
I M
|
CTSH
-
NASDAQ
Cognizant Tech Sol Cl A
COMPUTER SOFTWARE and SERVICES - Business Software and Services
|
$81.95
|
+0.12
0.15% |
$82.30
|
2,474,887
114.07% of 50 DAV
50 DAV is 2,169,600
|
$82.93
-1.18%
|
2/7/2011
|
$75.09
|
PP = $76.46
|
|
MB = $80.28
|
Most Recent Note - 4/20/2011 4:50:19 PM
G - Gapped up today, rallying with below average volume to finish -1% off its all-time high. This week it tested prior highs in the $77-78 area and its 50 DMA line and found prompt support. See the latest FSU analysis for more details and a new annotated graph.
>>> The latest Featured Stock Update with an annotated graph appeared on 4/15/2011. Click here.
View all notes |
Alert me of new notes |
CANSLIM.net Company Profile |
SEC |
Zacks Reports |
StockTalk |
News |
Chart |
Request a new note
C
A N
S L
I M
|
Symbol/Exchange
Company Name
Industry Group |
PRICE |
CHANGE
(%Change) |
Day High |
Volume
(% DAV)
(% 50 day avg vol) |
52 Wk Hi
% From Hi |
Featured
Date |
Price
Featured |
Pivot Featured |
|
Max Buy |
DECK
-
NASDAQ
Deckers Outdoor Corp
CONSUMER NON-DURABLES - Textile - Apparel Footwear
|
$95.51
|
-0.41
-0.43% |
$96.44
|
1,042,784
78.83% of 50 DAV
50 DAV is 1,322,800
|
$97.00
-1.54%
|
2/3/2011
|
$79.61
|
PP = $82.67
|
|
MB = $86.80
|
Most Recent Note - 4/20/2011 4:51:35 PM
G - Gapped up today and hit a new all-time high with a gain on light volume while rising from a shorter than minimum length "cup-with-handle" type consolidation. Its 50 DMA line defines initial chart support to watch.
>>> The latest Featured Stock Update with an annotated graph appeared on 4/6/2011. Click here.
View all notes |
Alert me of new notes |
CANSLIM.net Company Profile |
SEC |
Zacks Reports |
StockTalk |
News |
Chart |
Request a new note
C
A N
S L
I M
|
EZPW
-
NASDAQ
Ezcorp Inc Cl A
SPECIALTY RETAIL - Specialty Retail, Other
|
$30.26
|
-0.18
-0.59% |
$30.78
|
323,779
90.59% of 50 DAV
50 DAV is 357,400
|
$33.08
-8.52%
|
2/18/2011
|
$27.94
|
PP = $30.04
|
|
MB = $31.54
|
Most Recent Note - 4/25/2011 7:24:57 PM
G - Closed near the session low after gapping up today, posting its 4th consecutive gain with volume increasing to above average. Reported earnings +31% on +21% sales revenues for the quarter ended March 31, 2011 versus the year ago period. Last week it rebounded above its 50 DMA line and prior highs in the $29-30 area, helping its outlook.
>>> The latest Featured Stock Update with an annotated graph appeared on 4/11/2011. Click here.
View all notes |
Alert me of new notes |
CANSLIM.net Company Profile |
SEC |
Zacks Reports |
StockTalk |
News |
Chart |
Request a new note
C
A N
S L
I M
|
FOSL
-
NASDAQ
Fossil Inc
CONSUMER DURABLES - Recreational Goods, Other
|
$95.89
|
-0.74
-0.77% |
$96.83
|
509,254
51.03% of 50 DAV
50 DAV is 997,900
|
$96.99
-1.13%
|
2/1/2011
|
$73.30
|
PP = $74.44
|
|
MB = $78.16
|
Most Recent Note - 4/20/2011 11:31:25 AM
G - Gapped up today and hit a new all-time high. Previously noted - "It rallied more than +108% higher in 8 months since first featured in yellow in the 8/10/10 mid-day report (read here). It could produce more climactic gains, but recently it has been noted - "Extended from any sound base. Prior highs in the $83-85 area define chart support to watch above its 50 DMA line."
>>> The latest Featured Stock Update with an annotated graph appeared on 3/30/2011. Click here.
View all notes |
Alert me of new notes |
CANSLIM.net Company Profile |
SEC |
Zacks Reports |
StockTalk |
News |
Chart |
Request a new note
C
A N
S L
I M
|
HMSY
-
NASDAQ
H M S Holdings Corp
COMPUTER SOFTWARE and SERVICES - Healthcare Information Service
|
$80.53
|
-0.92
-1.13% |
$83.16
|
158,297
95.47% of 50 DAV
50 DAV is 165,800
|
$84.82
-5.06%
|
11/19/2010
|
$61.89
|
PP = $63.01
|
|
MB = $66.16
|
Most Recent Note - 4/26/2011 7:32:23 PM
G - Gapped up today but the reversed into the red and closed near the session low -5.1% below its all-time high. Due to report earnings before the open on Friday April 29th. See the latest FSU analysis for more details and a new annotated graph.
>>> The latest Featured Stock Update with an annotated graph appeared on 4/26/2011. Click here.
View all notes |
Alert me of new notes |
CANSLIM.net Company Profile |
SEC |
Zacks Reports |
StockTalk |
News |
Chart |
Request a new note
C
A N
S L
I M
|
HS
-
NYSE
Healthspring Inc
HEALTH SERVICES - Health Care Plans
|
$40.60
|
+1.04
2.63% |
$41.53
|
825,789
95.06% of 50 DAV
50 DAV is 868,700
|
$40.78
-0.44%
|
3/22/2011
|
$38.29
|
PP = $38.85
|
|
MB = $40.79
|
Most Recent Note - 4/26/2011 4:33:29 PM
Y - Gapped up today for a gain with slightly below average volume for a new high close, approaching its "max buy" level. Its 50 DMA line ($37.52 now) defines important support above recent lows in the $35.50 area.
>>> The latest Featured Stock Update with an annotated graph appeared on 4/21/2011. Click here.
View all notes |
Alert me of new notes |
CANSLIM.net Company Profile |
SEC |
Zacks Reports |
StockTalk |
News |
Chart |
Request a new note
C
A N
S L
I M
|
Symbol/Exchange
Company Name
Industry Group |
PRICE |
CHANGE
(%Change) |
Day High |
Volume
(% DAV)
(% 50 day avg vol) |
52 Wk Hi
% From Hi |
Featured
Date |
Price
Featured |
Pivot Featured |
|
Max Buy |
INFA
-
NASDAQ
Informatica Corp
COMPUTER SOFTWARE and SERVICES - Business Software and Services
|
$54.35
|
+0.12
0.22% |
$54.95
|
1,197,139
127.59% of 50 DAV
50 DAV is 938,300
|
$54.27
0.15%
|
3/24/2011
|
$50.04
|
PP = $49.86
|
|
MB = $52.35
|
Most Recent Note - 4/25/2011 11:58:07 AM
G - Reported +33% earnings on +24% sales revenues for the quarter ended March 31, 2011 versus the year ago period. Touched a new 52-week high today. Prior highs in the $49 area define support to watch coinciding with its 50 DMA line.
>>> The latest Featured Stock Update with an annotated graph appeared on 3/28/2011. Click here.
View all notes |
Alert me of new notes |
CANSLIM.net Company Profile |
SEC |
Zacks Reports |
StockTalk |
News |
Chart |
Request a new note
C
A N
S L
I M
|
LULU
-
NASDAQ
Lululemon Athletica
MANUFACTURING - Textile Manufacturing
|
$98.62
|
-2.76
-2.72% |
$101.68
|
1,646,861
72.00% of 50 DAV
50 DAV is 2,287,300
|
$102.83
-4.09%
|
3/28/2011
|
$68.11
|
PP = $85.38
|
|
MB = $89.65
|
Most Recent Note - 4/26/2011 4:20:40 PM
G - Pulling back from all-time highs hit last week, this high-ranked Retail-Apparel firm has been noted as extended from any sound base pattern. Prior highs and its 50 DMA line in the $85 area define initial chart support to watch.
>>> The latest Featured Stock Update with an annotated graph appeared on 3/31/2011. Click here.
View all notes |
Alert me of new notes |
CANSLIM.net Company Profile |
SEC |
Zacks Reports |
StockTalk |
News |
Chart |
Request a new note
C
A N
S L
I M
|
MG
-
NYSE
Mistras Group Inc
DIVERSIFIED SERVICES - Bulding and Faci;ity Management Services
|
$18.31
|
-0.04
-0.22% |
$18.46
|
77,014
58.26% of 50 DAV
50 DAV is 132,200
|
$18.40
-0.48%
|
3/15/2011
|
$15.48
|
PP = $15.90
|
|
MB = $16.70
|
Most Recent Note - 4/21/2011 6:06:43 PM
G - Closed at the session high today and matched its all-time high with above average volume behind a 7th consecutive gain. It is extended from any sound base pattern, meanwhile its 50 DMA line and prior highs define important support to watch.
>>> The latest Featured Stock Update with an annotated graph appeared on 4/12/2011. Click here.
View all notes |
Alert me of new notes |
CANSLIM.net Company Profile |
SEC |
Zacks Reports |
StockTalk |
News |
Chart |
Request a new note
C
A N
S L
I M
|
MWIV
-
NASDAQ
M W I Veterinary Supply
HEALTH SERVICES - Medical Instruments and; Supplies
|
$80.24
|
-0.25
-0.31% |
$81.02
|
144,355
146.85% of 50 DAV
50 DAV is 98,300
|
$84.97
-5.57%
|
11/4/2010
|
$61.79
|
PP = $59.60
|
|
MB = $62.58
|
Most Recent Note - 4/25/2011 12:09:16 PM
G - Pulling back today from the new all-time high hit on the prior session. Since first featured in yellow on 7/29/10 it has traded as much as +63% higher. Extended from any sound base pattern, its 50 DMA line defines important support to watch.
>>> The latest Featured Stock Update with an annotated graph appeared on 4/8/2011. Click here.
View all notes |
Alert me of new notes |
CANSLIM.net Company Profile |
SEC |
Zacks Reports |
StockTalk |
News |
Chart |
Request a new note
C
A N
S L
I M
|
OPEN
-
NASDAQ
Opentable Inc
INTERNET - Internet Software and Services
|
$108.70
|
-6.92
-5.99% |
$117.92
|
1,775,671
142.54% of 50 DAV
50 DAV is 1,245,700
|
$118.66
-8.39%
|
3/17/2011
|
$90.71
|
PP = $96.07
|
|
MB = $100.87
|
Most Recent Note - 4/26/2011 3:57:59 PM
G - Down today on heavy volume. Reporting earnings on Tuesday, May 3rd for the quarter ended March 31, 2011. Repeatedly noted - "Extended from its latest base. Prior highs near $96 and its 50 DMA line define support to watch on pullbacks.
>>> The latest Featured Stock Update with an annotated graph appeared on 4/25/2011. Click here.
View all notes |
Alert me of new notes |
CANSLIM.net Company Profile |
SEC |
Zacks Reports |
StockTalk |
News |
Chart |
Request a new note
C
A N
S L
I M
|
Symbol/Exchange
Company Name
Industry Group |
PRICE |
CHANGE
(%Change) |
Day High |
Volume
(% DAV)
(% 50 day avg vol) |
52 Wk Hi
% From Hi |
Featured
Date |
Price
Featured |
Pivot Featured |
|
Max Buy |
PAY
-
NYSE
Verifone Systems Inc
COMPUTER HARDWARE - Transaction Automation Systems
|
$52.81
|
-2.04
-3.72% |
$55.64
|
2,047,125
84.22% of 50 DAV
50 DAV is 2,430,800
|
$58.88
-10.31%
|
1/27/2011
|
$41.77
|
PP = $44.97
|
|
MB = $47.22
|
Most Recent Note - 4/26/2011 4:01:25 PM
G - Reversed into the red after an early gain today. Its 50 DMA line ($51.22 now) defines important chart support to watch.
>>> The latest Featured Stock Update with an annotated graph appeared on 4/4/2011. Click here.
View all notes |
Alert me of new notes |
CANSLIM.net Company Profile |
SEC |
Zacks Reports |
StockTalk |
News |
Chart |
Request a new note
C
A N
S L
I M
|
PCLN
-
NASDAQ
Priceline.Com Inc
INTERNET - Internet Software and Services
|
$537.69
|
-6.62
-1.22% |
$546.20
|
809,384
67.87% of 50 DAV
50 DAV is 1,192,600
|
$547.91
-1.87%
|
1/3/2011
|
$399.55
|
PP = $428.20
|
|
MB = $449.61
|
Most Recent Note - 4/21/2011 6:09:18 PM
G - Closed near the session high today and hit a new 52-week high with a 3rd consecutive gain on below average volume. Without great volume conviction behind any recent gains, it has been repeatedly noted - "Extended from any sound base pattern. Its 50 DMA line has defined support throughout its advance."
>>> The latest Featured Stock Update with an annotated graph appeared on 4/20/2011. Click here.
View all notes |
Alert me of new notes |
CANSLIM.net Company Profile |
SEC |
Zacks Reports |
StockTalk |
News |
Chart |
Request a new note
C
A N
S L
I M
|
RAX
-
NYSE
Rackspace Hosting Inc
INTERNET - Internet Software and; Services
|
$43.94
|
-0.81
-1.81% |
$45.37
|
1,203,015
69.36% of 50 DAV
50 DAV is 1,734,500
|
$45.41
-3.24%
|
3/16/2011
|
$36.28
|
PP = $40.72
|
|
MB = $42.76
|
Most Recent Note - 4/26/2011 4:23:58 PM
G - Reversed into the red after quietly touching a new all-time high today. It is extended from any sound base. Prior highs near $40 define support above its 50 DMA line.
>>> The latest Featured Stock Update with an annotated graph appeared on 4/18/2011. Click here.
View all notes |
Alert me of new notes |
CANSLIM.net Company Profile |
SEC |
Zacks Reports |
StockTalk |
News |
Chart |
Request a new note
C
A N
S L
I M
|
TIBX
-
NASDAQ
Tibco Software Inc
COMPUTER SOFTWARE and SERVICES - Business Software and Services
|
$29.50
|
-0.43
-1.44% |
$29.99
|
2,403,770
99.32% of 50 DAV
50 DAV is 2,420,200
|
$29.98
-1.60%
|
3/18/2011
|
$23.88
|
PP = $26.04
|
|
MB = $27.34
|
Most Recent Note - 4/20/2011 5:03:45 PM
G - Small gap up gain today with below average volume for its second best close. It is extended from a sound base after a spurt of volume-driven gains. As previously noted, support is defined by prior highs in the $25-26 area and its 50 DMA line.
>>> The latest Featured Stock Update with an annotated graph appeared on 4/14/2011. Click here.
View all notes |
Alert me of new notes |
CANSLIM.net Company Profile |
SEC |
Zacks Reports |
StockTalk |
News |
Chart |
Request a new note
C
A N
S L
I M
|
UA
-
NYSE
Under Armour Inc Cl A
CONSUMER NON-DURABLES - Textile - Apparel Clothing
|
$69.64
|
-8.83
-11.25% |
$75.45
|
4,606,789
612.04% of 50 DAV
50 DAV is 752,700
|
$80.00
-12.95%
|
3/31/2011
|
$68.04
|
PP = $70.79
|
|
MB = $74.33
|
Most Recent Note - 4/26/2011 11:57:53 AM
G - Down considerably today with heavy volume after reporting strong sales and earnings for the quarter ended March 31, 2011. Gapped down and it is now testing support near prior highs in the $70 area and its 50 DMA line.
>>> The latest Featured Stock Update with an annotated graph appeared on 4/1/2011. Click here.
View all notes |
Alert me of new notes |
CANSLIM.net Company Profile |
SEC |
Zacks Reports |
StockTalk |
News |
Chart |
Request a new note
C
A N
S L
I M
|
Symbol/Exchange
Company Name
Industry Group |
PRICE |
CHANGE
(%Change) |
Day High |
Volume
(% DAV)
(% 50 day avg vol) |
52 Wk Hi
% From Hi |
Featured
Date |
Price
Featured |
Pivot Featured |
|
Max Buy |
ULTA
-
NASDAQ
Ulta Salon Cosm & Frag
SPECIALTY RETAIL - Specialty Retail, Other
|
$52.57
|
-0.15
-0.28% |
$53.17
|
557,041
90.66% of 50 DAV
50 DAV is 614,400
|
$53.99
-2.63%
|
1/6/2011
|
$36.12
|
PP = $37.34
|
|
MB = $39.21
|
Most Recent Note - 4/20/2011 11:29:14 AM
G - Gapped up and hit a new all-time high today. It is extended from any sound base. Its 50 DMA line defines chart support to watch well above prior highs.
>>> The latest Featured Stock Update with an annotated graph appeared on 3/29/2011. Click here.
View all notes |
Alert me of new notes |
CANSLIM.net Company Profile |
SEC |
Zacks Reports |
StockTalk |
News |
Chart |
Request a new note
C
A N
S L
I M
|
|
|
|
THESE ARE NOT BUY RECOMMENDATIONS!
Comments contained in the body of this report are technical
opinions only. The material herein has been obtained
from sources believed to be reliable and accurate, however,
its accuracy and completeness cannot be guaranteed.
This site is not an investment advisor, hence it does
not endorse or recommend any securities or other investments.
Any recommendation contained in this report may not
be suitable for all investors and it is not to be deemed
an offer or solicitation on our part with respect to
the purchase or sale of any securities. All trademarks,
service marks and trade names appearing in this report
are the property of their respective owners, and are
likewise used for identification purposes only.
This report is a service available
only to active Paid Premium Members.
You may opt-out of receiving report notifications
at any time. Questions or comments may be submitted
by writing to Premium Membership Services 665 S.E. 10 Street, Suite 201 Deerfield Beach, FL 33441-5634 or by calling 1-800-965-8307
or 954-785-1121.
|
|
|

