You are not logged in.
This means you
CAN ONLY VIEW reports that were published prior to Tuesday, July 9, 2024.
You
MUST UPGRADE YOUR MEMBERSHIP if you want to see any current reports.
AFTER MARKET UPDATE - MONDAY, APRIL 8TH, 2024
Previous After Market Report Next After Market Report >>>
|
|
|
|
DOW |
-11.24 |
38,892.80 |
-0.03% |
|
Volume |
799,443,224 |
-4% |
|
Volume |
4,410,771,500 |
-5% |
|
NASDAQ |
+5.44 |
16,253.96 |
+0.03% |
|
Advancers |
1,644 |
60% |
|
Advancers |
2,407 |
57% |
|
S&P 500 |
-1.95 |
5,202.39 |
-0.04% |
|
Decliners |
1,114 |
40% |
|
Decliners |
1,850 |
43% |
|
Russell 2000 |
+10.24 |
2,073.71 |
+0.50% |
|
52 Wk Highs |
124 |
|
|
52 Wk Highs |
114 |
|
|
S&P 600 |
+8.33 |
1,316.99 |
+0.64% |
|
52 Wk Lows |
15 |
|
|
52 Wk Lows |
88 |
|
|
Based on noted distributional action in the major indices last week there has been a shift in (M criteria) market conditions from a "confirmed uptrend" to an "uptrend under pressure". Use greater caution.
|
 |
Leadership Improved but Major Indexes Were Little Changed
Kenneth J. Gruneisen - Passed the CAN SLIM® Master's Exam
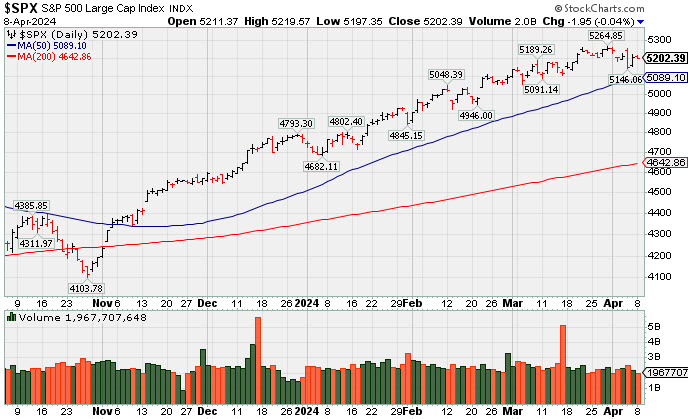
There was not a lot of conviction on either side of the tape. Strength in regional bank shares led to the outperformance of the Russell 2000, which closed +0.5% higher. Volume reported was lighter than the prior session total on the NYSE and on the Nasdaq exchange. Breadth was positive as advancers led decliners by more than a 4-3 margin on the NYSE and on the Nasdaq exchange. There were 48 high-ranked companies from the Leaders List that hit new 52-week highs and were listed on the BreakOuts Page, versus the total of 29 on the prior session. New 52-week highs totals expanded and outnumbered new 52-week lows on the NYSE and on the Nasdaq exchange. The major indices are in an uptrend that is under pressure (M criteria). Greater caution is important for all investors. Always stand ready to protect against losses.
PICTURED: The S&P 500 Index was little changed with a light volume total while consolidating well above its 50-day moving average line.
This week's economix calendar includes inflation data in the form of the March Consumer Price Index on Wednesday and Producer Price Index on Thursday. Meanwhile, there was optimism in front of first quarter earnings results from some big banks which are due to report on Friday morning. There were small gains from JP Morgan Chase (JPM +0.52%), Wells Fargo (WFC +0.68%), and Citigroup (C +0.21%).
The 10-yr note yield settled four basis points higher at 4.43% and the 2-yr note yield settled six basis points higher at 4.79%. Fresh Treasury sales this week will include a $58 billion 3-yr note auction on Tuesday, a $39 billion 10-yr note auction on Wednesday, and a $22 billion 30-yr bond auction on Thursday.
|
 Kenneth J. Gruneisen started out as a licensed stockbroker in August 1987, a couple of months prior to the historic stock market crash that took the Dow Jones Industrial Average down -22.6% in a single day. He has published daily fact-based fundamental and technical analysis on high-ranked stocks online for two decades. Through FACTBASEDINVESTING.COM, Kenneth provides educational articles, news, market commentary, and other information regarding proven investment systems that work in good times and bad.
Comments contained in the body of this report are technical opinions only and are not necessarily those of Gruneisen Growth Corp. The material herein has been obtained from sources believed to be reliable and accurate, however, its accuracy and completeness cannot be guaranteed. Our firm, employees, and customers may effect transactions, including transactions contrary to any recommendation herein, or have positions in the securities mentioned herein or options with respect thereto. Any recommendation contained in this report may not be suitable for all investors and it is not to be deemed an offer or solicitation on our part with respect to the purchase or sale of any securities. |
|
 |
Financial Indexes Led Group Gainers
Kenneth J. Gruneisen - Passed the CAN SLIM® Master's Exam
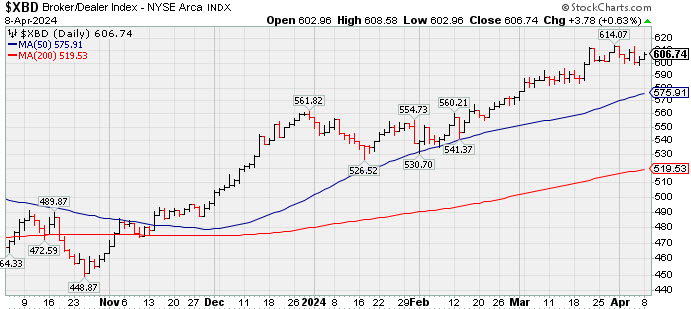
The major indices got a boost from gains in the Broker/Dealer Index ($XBD +0.63%) and Bank Index ($BKX +1.27%) while te Retail Index ($RLX +0.24%) posted a smaller gain. The tech sector was indecisive as the Semiconductor Index ($SOX +0.13%) and the Networking Index ($NWX +0.27%) both inched higher and the Biotech Index ($BTK -0.04%) finished flat. Commodity-linked groups had a negative bias as the Gold & Silver Index ($XAU -0.51%), Oil Services Index ($OSX -0.89%), and Integrated Oil Index ($XOI -0.49%) each posted a small loss.
![]() PICTURED: The Broker/Dealer Index ($XBD +0.63%) has been consolidating near its all-time high.
| Oil Services |
$OSX |
94.23 |
-0.84 |
-0.89% |
+12.34% |
| Integrated Oil |
$XOI |
2,249.28 |
-11.16 |
-0.49% |
+20.77% |
| Semiconductor |
$SOX |
4,825.39 |
+6.26 |
+0.13% |
+15.57% |
| Networking |
$NWX |
782.71 |
+2.07 |
+0.27% |
-6.02% |
| Broker/Dealer |
$XBD |
606.74 |
+3.78 |
+0.63% |
+8.87% |
| Retail |
$RLX |
4,504.08 |
+10.70 |
+0.24% |
+15.82% |
| Gold & Silver |
$XAU |
135.65 |
-0.69 |
-0.51% |
+7.93% |
| Bank |
$BKX |
103.19 |
+1.30 |
+1.27% |
+7.47% |
| Biotech |
$BTK |
5,186.52 |
-2.26 |
-0.04% |
-4.29% |
|
|
|
 |
Volume Totals Cooling While Building a New Base
Kenneth J. Gruneisen - Passed the CAN SLIM® Master's Exam
Axon Enterprise Inc's (AXON +$1.31 or +0.42% to $311.21) color code was changed to yellow with new pivot point cited based on its 3/04/24 high plus 10 cents while hovering in a tight range near its all-time high. Volume-driven gains above the pivot point are needed to trigger a proper technical buy signal. Its 50-day moving average (DMA) line ($291) defines near-term support to watch.
AXON was highlighted in yellow in the 11/08/23 mid-day report (read here) with new pivot point cited based on its 10/17/23 high after a cup-with-handle base. It was last shown in detail in this FSU section on 3/14/24 with an annotated graph under the headline, "Hovering Near All-Time High; Spiked Higher Following Earnings".
Bullish action came after AXON reported Dec '23 quarterly earnings +60% on +29% sales revenues versus the year-ago period, its 5th strong quarter well above the +25% minimum earnings guideline (C criteria). Annual earnings had a slight downturn in FY '22 after years of strong growth.
The company has a small supply of only 75.3 million shares outstanding (S criteria) which can contribute to greater price volatility in the event of institutional buying or selling. The number of top-rated funds owning its shares rose from 978 in Mar '23 to 1,517 in Mar '24, a reassuring sign concerning the I criteria. AXON has a Timeliness Rating of A and an Accumulation/Distribution Rating of B. Charts courtesy www.stockcharts.com 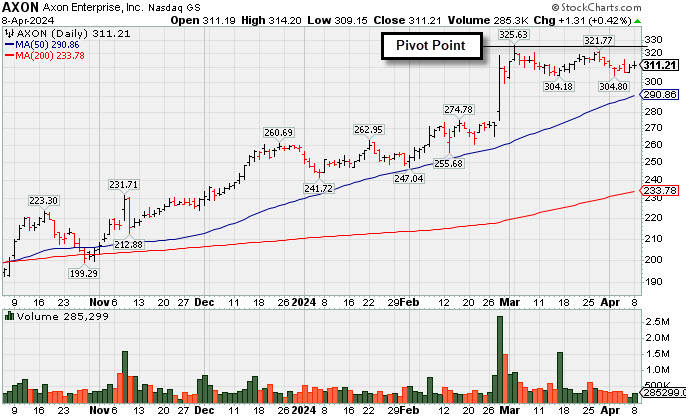
Symbol/Exchange
Company Name
Industry Group | PRICE | CHANGE
(%Change) | Day High | Volume
(% DAV)
(% 50 day avg vol) | 52 Wk Hi
% From Hi | Featured
Date | Price
Featured | Pivot Featured | | Max Buy |  ANET - NYSE ANET - NYSE
Arista Networks
Computer-Networking | $297.38 | -0.22
-0.07% | $299.18 | 1,323,888
48.85% of 50 DAV
50 DAV is 2,710,000 | $307.74
-3.37%
| 3/18/2024 | $188.84 | PP = $292.76 | | MB = $307.40 | Most Recent Note - 4/5/2024 7:25:06 PM
Y - Still hovering near its all-time high with recent gains lacking great volume conviction. Found support near prior highs in the $292 area and additional near-term support to watch is its 50 DMA line ($279) and an upward trendline connecting its October-March lows.
>>> FEATURED STOCK ARTICLE : Consolidating Abover Recent Highs and Above 50-Day Average - 3/26/2024 | View all notes | Set NEW NOTE alert | Company Profile | SEC News | Chart | Request a new note C A S I | NVO - NYSE
Novo Nordisk ADR
Medical-Ethical Drugs | $127.46 | +1.60
1.27% | $127.63 | 3,011,803
55.23% of 50 DAV
50 DAV is 5,453,000 | $138.28
-7.82%
| 3/1/2024 | $124.23 | PP = $124.97 | | MB = $131.22 |  Most Recent Note - 4/8/2024 5:19:16 PM Most Recent Note - 4/8/2024 5:19:16 PM
Y - Posted a gain today with lighter volume. Quietly pulling back below the pivot point of the previously noted "3-weeks tight" base and testing its 50 DMA line ($124.30) which defines important near-term support.
>>> FEATURED STOCK ARTICLE : Volume Cools While Consolidating Above 50-Day Moving Average Line - 4/3/2024 | View all notes | Set NEW NOTE alert | Company Profile | SEC News | Chart | Request a new note C A S I | AXON - NASDAQ
Axon Enterprise
Security/Sfty | $311.21 | +1.31
0.42% | $314.20 | 285,299
57.87% of 50 DAV
50 DAV is 493,000 | $325.63
-4.43%
| 4/5/2024 | $309.90 | PP = $325.73 | | MB = $342.02 | Most Recent Note - 4/8/2024 5:17:45 PM
Y - Color code was changed to yellow with new pivot point cited based on its 3/04/24 high plus 10 cents. Volume totals have been cooling while hovering in a tight range near its all-time high. Volume-driven gains above the pivot point are needed to trigger a proper technical buy signal. Its 50-day moving average (DMA) line ($291) defines near-term support to watch. Fundamentals remain strong. See the latest FSU analysis for more details and a new annotated graph.
>>> FEATURED STOCK ARTICLE : Volume Totals Cooling While Building a New Base - 4/8/2024 | View all notes | Set NEW NOTE alert | Company Profile | SEC News | Chart | Request a new note C A S I | TDG - NYSE
TransDigm Group
Aerospace/Defense | $1,233.29 | -1.99
-0.16% | $1,239.26 | 121,851
55.89% of 50 DAV
50 DAV is 218,000 | $1,246.22
-1.04%
| 12/12/2023 | $1,000.39 | PP = $1,013.18 | | MB = $1,063.84 | Most Recent Note - 4/5/2024 7:26:47 PM
G - Rebounded today following a "negative reversal" on the prior session after touching a new all-time high. Its 50 DMA line ($1,168) defines near-term support to watch.
>>> FEATURED STOCK ARTICLE : Perched in Tight Range Encountering Distribtion Near All-Time High - 3/15/2024 | View all notes | Set NEW NOTE alert | Company Profile | SEC News | Chart | Request a new note C A S I | CRWD - NASDAQ
CrowdStrike Holdings
Computer Sftwr-Security | $313.69 | -1.81
-0.57% | $316.64 | 1,432,536
36.33% of 50 DAV
50 DAV is 3,943,000 | $365.00
-14.06%
| 1/2/2024 | $246.42 | PP = $261.91 | | MB = $275.01 | Most Recent Note - 4/8/2024 5:24:35 PM
G - Still lingering below its 50 DMA ($317.59) with volume totals cooling. A rebound above the 50 DMA line is needed for its outlook to improve. It has not formed a sound base. Fundamentals remain strong after it reported Jan ''24 quarterly earnings +102% on +33% sales revenues versus the year-ago period.
>>> FEATURED STOCK ARTICLE : 50-Day Moving Average Line Support Being Tested - 4/1/2024 | View all notes | Set NEW NOTE alert | Company Profile | SEC News | Chart | Request a new note C A S I | Symbol/Exchange
Company Name
Industry Group | PRICE | CHANGE
(%Change) | Day High | Volume
(% DAV)
(% 50 day avg vol) | 52 Wk Hi
% From Hi | Featured
Date | Price
Featured | Pivot Featured | | Max Buy | PCAR - NASDAQ
Paccar
Trucks and Parts-Hvy Duty | $122.51 | +0.30
0.25% | $123.20 | 1,837,468
84.13% of 50 DAV
50 DAV is 2,184,000 | $125.50
-2.38%
| 1/23/2024 | $100.35 | PP = $98.57 | | MB = $103.50 | Most Recent Note - 4/5/2024 7:37:28 PM
G - Posted a 2nd consecutive gain today with lighter volume after pulling back from its all-time high. Very extended from any sound base, its 50 DMA line ($112.61) defines near-term support to watch. Fundamentals remain strong.
>>> FEATURED STOCK ARTICLE : Hit New High With 5th Consecutive Gain - 3/21/2024 | View all notes | Set NEW NOTE alert | Company Profile | SEC News | Chart | Request a new note C A S I | HUBB - NYSE
Hubbell
Electrical-Power/Equipmt | $415.74 | -1.34
-0.32% | $420.03 | 363,288
81.82% of 50 DAV
50 DAV is 444,000 | $429.61
-3.23%
| 1/30/2024 | $343.26 | PP = $336.83 | | MB = $353.67 | Most Recent Note - 4/8/2024 5:25:52 PM
G - Holding its ground after a noted "negative reversal" at its all-time high on 4/04/24. It is very extended from the previously noted base. Its 50 DMA line ($380.73) defines important support to watch.
>>> FEATURED STOCK ARTICLE : Hubbell Perched at All-Time High After 5 Weekly Gains - 3/22/2024 | View all notes | Set NEW NOTE alert | Company Profile | SEC News | Chart | Request a new note C A S I | MANH - NASDAQ
Manhattan Associates
Computer Sftwr-Enterprse | $242.09 | -1.42
-0.58% | $244.95 | 326,083
84.92% of 50 DAV
50 DAV is 384,000 | $266.94
-9.31%
| 1/31/2024 | $240.57 | PP = $230.71 | | MB = $242.25 | Most Recent Note - 4/5/2024 7:34:27 PM
G - Sputtering beneath its 50 DMA line ($247.20) this week raising concerns. Recent lows in the $239-241 area define important near-term support where violations would raise greater concerns and trigger a worrisome technical sell signal.
>>> FEATURED STOCK ARTICLE : Manhattan Associates Consolidating Above 50-Day Moving Average - 3/25/2024 | View all notes | Set NEW NOTE alert | Company Profile | SEC News | Chart | Request a new note C A S I | USLM - NASDAQ
U.S. Lime & Minerals
Bldg-Cement/Concrt/Ag | $304.28 | -0.72
-0.24% | $308.00 | 30,613
122.45% of 50 DAV
50 DAV is 25,000 | $307.48
-1.04%
| 2/9/2024 | $254.68 | PP = $265.09 | | MB = $278.34 | Most Recent Note - 4/8/2024 12:34:27 PM
G - Inching higher again today for a new all-time high, extended from the previously noted base. Its 50 DMA line ($273) defines near-term support to watch.
>>> FEATURED STOCK ARTICLE : Gain With Light Volume for Best Ever Close - 4/5/2024 | View all notes | Set NEW NOTE alert | Company Profile | SEC News | Chart | Request a new note C A S I | NOW - NYSE
ServiceNow
Computer Sftwr-Enterprse | $785.60 | +2.10
0.27% | $789.99 | 989,670
81.19% of 50 DAV
50 DAV is 1,219,000 | $815.32
-3.65%
| 2/22/2024 | $771.75 | PP = $815.32 | | MB = $856.09 | Most Recent Note - 4/5/2024 7:22:30 PM
Y - Posted a solid gain today with average (higher) volume, finding support near its 50 DMA line ($770). Prior lows in the $730 area define the next important near-term support to watch.
>>> FEATURED STOCK ARTICLE : NOW Quietly Rebounded Above 50-Day Moving Average Line - 3/20/2024 | View all notes | Set NEW NOTE alert | Company Profile | SEC News | Chart | Request a new note C A S I | Symbol/Exchange
Company Name
Industry Group | PRICE | CHANGE
(%Change) | Day High | Volume
(% DAV)
(% 50 day avg vol) | 52 Wk Hi
% From Hi | Featured
Date | Price
Featured | Pivot Featured | | Max Buy | SNPS - NASDAQ
Synopsys
Computer Sftwr-Design | $576.54 | +1.09
0.19% | $577.87 | 596,661
54.84% of 50 DAV
50 DAV is 1,088,000 | $629.38
-8.40%
| 2/22/2024 | $600.65 | PP = $582.85 | | MB = $611.99 | Most Recent Note - 4/5/2024 7:35:58 PM
Y - Volume totals have been cooling while still consolidating just above near-term support at its 50 DMA line ($566). More damaging losses would raise concerns and trigger a technical sell signal. Previously noted - " A strong volume-driven gain and close above the pivot point is needed to clinch a proper technical buy signal."
>>> FEATURED STOCK ARTICLE : Rallying From Support at 50-Day Moving Average Line - 3/19/2024 | View all notes | Set NEW NOTE alert | Company Profile | SEC News | Chart | Request a new note C A S I | PAY - NYSE
Paymentus Holdings
Finance-CrdtCard/PmtPr | $21.27 | +0.59
2.85% | $21.64 | 469,897
128.39% of 50 DAV
50 DAV is 366,000 | $25.21
-15.63%
| 3/5/2024 | $19.97 | PP = $18.89 | | MB = $19.83 | Most Recent Note - 4/8/2024 5:20:26 PM
G - Posted a gain today with higher (+28% above-average) volume. It is extended from the previously noted base. Its 50 DMA line ($18.80) coincides with prior highs in the $18 range defining important support to watch on pullbacks.
>>> FEATURED STOCK ARTICLE : Consolidating After Powerful Breakout and Volume-Driven Gains - 3/27/2024 | View all notes | Set NEW NOTE alert | Company Profile | SEC News | Chart | Request a new note C A S I | HUBS - NYSE
HubSpot
Comp Sftwr-Spec Enterprs | $670.15 | +0.15
0.02% | $674.50 | 456,696
87.66% of 50 DAV
50 DAV is 521,000 | $693.85
-3.42%
| 4/4/2024 | $686.66 | PP = $660.10 | | MB = $693.11 | Most Recent Note - 4/5/2024 11:51:26 AM
Y - Gapped up today and on track for a solid gain. On the prior session it finished in middle of its intra-day range after highlighted yellow in the mid-day report with pivot point cited based on its 2/09/24 high plus 10 cents. Hit a new 52-week high with a volume-driven gain triggering a technical buy signal after finding prompt support at its 50 DMA line ($617) in recent weeks. Reported Dec '23 quarterly earnings +59% on +24% sales revenues versus the year-ago period, its 6th consecutive quarterly comparison well above the +25% minimum guideline (C criteria). Annual earnings history (A criteria) has been strong. Faces some resistance due to old overhead supply up to the $866 level. See the latest FSU analysis for more details and a new annotated graph.
>>> FEATURED STOCK ARTICLE : Encountered Distributional Pressure and Finished Below Pivot Point - 4/4/2024 | View all notes | Set NEW NOTE alert | Company Profile | SEC News | Chart | Request a new note C A S I |
|
|
|
Color Codes Explained :
Y - Better candidates highlighted by our
staff of experts.
G - Previously featured
in past reports as yellow but may no longer be buyable under the
guidelines.
***Last / Change / Volume data in this table is the closing quote data***
Symbol/Exchange
Company Name
Industry Group |
PRICE |
CHANGE
(%Change) |
Day High |
Volume
(% DAV)
(% 50 day avg vol) |
52 Wk Hi
% From Hi |
Featured
Date |
Price
Featured |
Pivot Featured |
|
Max Buy |
 ANET
-
NYSE
ANET
-
NYSE
Arista Networks
Computer-Networking
|
$297.60
|
+8.83
3.06% |
$298.25
|
1,451,932
53.20% of 50 DAV
50 DAV is 2,729,000
|
$307.74
-3.29%
|
3/18/2024
|
$188.84
|
PP = $292.76
|
|
MB = $307.40
|
Most Recent Note - 4/5/2024 7:25:06 PM
Y - Still hovering near its all-time high with recent gains lacking great volume conviction. Found support near prior highs in the $292 area and additional near-term support to watch is its 50 DMA line ($279) and an upward trendline connecting its October-March lows.
>>> FEATURED STOCK ARTICLE : Consolidating Abover Recent Highs and Above 50-Day Average - 3/26/2024 |
View all notes |
Set NEW NOTE alert |
Company Profile |
SEC
News |
Chart |
Request a new note
C
A
S
I |
NVO
-
NYSE
Novo Nordisk ADR
Medical-Ethical Drugs
|
$125.86
|
+1.90
1.53% |
$126.17
|
4,994,996
92.43% of 50 DAV
50 DAV is 5,404,000
|
$138.28
-8.98%
|
3/1/2024
|
$124.23
|
PP = $124.97
|
|
MB = $131.22
|
Most Recent Note - 4/4/2024 3:57:27 PM
Y - Quietly pulling back below the pivot point of the previously noted "3-weeks tight" base and testing its 50 DMA line ($123.46) which defines important near-term support. See the latest FSU analysis for more details and an annotated graph.
>>> FEATURED STOCK ARTICLE : Volume Cools While Consolidating Above 50-Day Moving Average Line - 4/3/2024 |
View all notes |
Set NEW NOTE alert |
Company Profile |
SEC
News |
Chart |
Request a new note
C
A
S
I |
AXON
-
NASDAQ
Axon Enterprise
Security/Sfty
|
$309.90
|
+3.07
1.00% |
$312.25
|
183,787
36.98% of 50 DAV
50 DAV is 497,000
|
$325.63
-4.83%
|
4/5/2024
|
$309.90
|
PP = $325.73
|
|
MB = $342.02
|
Most Recent Note - 4/5/2024 7:31:39 PM
Y - Color code is changed to yellow with new pivot point cited based on its 3/04/24 high plus 10 cents while hovering in a tight range near its all-time high. Volume-driven gains above the pivot point are needed to trigger a proper technical buy signal. Its 50-day moving average (DMA) line ($290) defines near-term support to watch. Fundamentals remain strong.
>>> FEATURED STOCK ARTICLE : Hovering Near All-Time High; Spiked Higher Following Earnings - 3/14/2024 |
View all notes |
Set NEW NOTE alert |
Company Profile |
SEC
News |
Chart |
Request a new note
C
A
S
I |
TDG
-
NYSE
TransDigm Group
Aerospace/Defense
|
$1,235.28
|
+30.92
2.57% |
$1,237.13
|
152,925
70.47% of 50 DAV
50 DAV is 217,000
|
$1,246.22
-0.88%
|
12/12/2023
|
$1,000.39
|
PP = $1,013.18
|
|
MB = $1,063.84
|
Most Recent Note - 4/5/2024 7:26:47 PM
G - Rebounded today following a "negative reversal" on the prior session after touching a new all-time high. Its 50 DMA line ($1,168) defines near-term support to watch.
>>> FEATURED STOCK ARTICLE : Perched in Tight Range Encountering Distribtion Near All-Time High - 3/15/2024 |
View all notes |
Set NEW NOTE alert |
Company Profile |
SEC
News |
Chart |
Request a new note
C
A
S
I |
CRWD
-
NASDAQ
CrowdStrike Holdings
Computer Sftwr-Security
|
$315.50
|
+6.31
2.04% |
$317.50
|
1,768,161
44.24% of 50 DAV
50 DAV is 3,997,000
|
$365.00
-13.56%
|
1/2/2024
|
$246.42
|
PP = $261.91
|
|
MB = $275.01
|
Most Recent Note - 4/4/2024 3:54:49 PM
G - Slumping below its 50 DMA ($317) today with light volume amid widespread market weakness. Only a prompt rebound above the 50 DMA line would help its outlook improve. It has not formed a sound base of sufficient length. Fundamentals remain strong after it reported Jan '24 quarterly earnings +102% on +33% sales revenues versus the year-ago period.
>>> FEATURED STOCK ARTICLE : 50-Day Moving Average Line Support Being Tested - 4/1/2024 |
View all notes |
Set NEW NOTE alert |
Company Profile |
SEC
News |
Chart |
Request a new note
C
A
S
I |
Symbol/Exchange
Company Name
Industry Group |
PRICE |
CHANGE
(%Change) |
Day High |
Volume
(% DAV)
(% 50 day avg vol) |
52 Wk Hi
% From Hi |
Featured
Date |
Price
Featured |
Pivot Featured |
|
Max Buy |
PCAR
-
NASDAQ
Paccar
Trucks and Parts-Hvy Duty
|
$122.21
|
+1.68
1.39% |
$122.75
|
1,391,679
62.60% of 50 DAV
50 DAV is 2,223,000
|
$125.50
-2.62%
|
1/23/2024
|
$100.35
|
PP = $98.57
|
|
MB = $103.50
|
Most Recent Note - 4/5/2024 7:37:28 PM
G - Posted a 2nd consecutive gain today with lighter volume after pulling back from its all-time high. Very extended from any sound base, its 50 DMA line ($112.61) defines near-term support to watch. Fundamentals remain strong.
>>> FEATURED STOCK ARTICLE : Hit New High With 5th Consecutive Gain - 3/21/2024 |
View all notes |
Set NEW NOTE alert |
Company Profile |
SEC
News |
Chart |
Request a new note
C
A
S
I |
HUBB
-
NYSE
Hubbell
Electrical-Power/Equipmt
|
$417.08
|
+4.52
1.10% |
$423.57
|
449,662
101.96% of 50 DAV
50 DAV is 441,000
|
$429.61
-2.92%
|
1/30/2024
|
$343.26
|
PP = $336.83
|
|
MB = $353.67
|
Most Recent Note - 4/4/2024 3:55:51 PM
G - Reversed into the red today after hitting another new all-time high. It is very extended from the previously noted base. Its 50 DMA line ($377) defines important support to watch.
>>> FEATURED STOCK ARTICLE : Hubbell Perched at All-Time High After 5 Weekly Gains - 3/22/2024 |
View all notes |
Set NEW NOTE alert |
Company Profile |
SEC
News |
Chart |
Request a new note
C
A
S
I |
MANH
-
NASDAQ
Manhattan Associates
Computer Sftwr-Enterprse
|
$243.51
|
+1.48
0.61% |
$245.41
|
315,021
82.04% of 50 DAV
50 DAV is 384,000
|
$266.94
-8.78%
|
1/31/2024
|
$240.57
|
PP = $230.71
|
|
MB = $242.25
|
Most Recent Note - 4/5/2024 7:34:27 PM
G - Sputtering beneath its 50 DMA line ($247.20) this week raising concerns. Recent lows in the $239-241 area define important near-term support where violations would raise greater concerns and trigger a worrisome technical sell signal.
>>> FEATURED STOCK ARTICLE : Manhattan Associates Consolidating Above 50-Day Moving Average - 3/25/2024 |
View all notes |
Set NEW NOTE alert |
Company Profile |
SEC
News |
Chart |
Request a new note
C
A
S
I |
USLM
-
NASDAQ
U.S. Lime & Minerals
Bldg-Cement/Concrt/Ag
|
$305.06
|
+6.32
2.12% |
$305.20
|
23,368
93.47% of 50 DAV
50 DAV is 25,000
|
$307.48
-0.79%
|
2/9/2024
|
$254.68
|
PP = $265.09
|
|
MB = $278.34
|
Most Recent Note - 4/5/2024 7:21:07 PM
G - Posted a gain today with lighter volume for a best-ever close, extended from the previously noted base. Its 50 DMA line ($272) defines near-term support to watch. See the latest FSU analysis for more detailed analysis and an annotated graph.
>>> FEATURED STOCK ARTICLE : Gain With Light Volume for Best Ever Close - 4/5/2024 |
View all notes |
Set NEW NOTE alert |
Company Profile |
SEC
News |
Chart |
Request a new note
C
A
S
I |
NOW
-
NYSE
ServiceNow
Computer Sftwr-Enterprse
|
$783.50
|
+25.95
3.43% |
$791.88
|
1,284,951
102.88% of 50 DAV
50 DAV is 1,249,000
|
$815.32
-3.90%
|
2/22/2024
|
$771.75
|
PP = $815.32
|
|
MB = $856.09
|
Most Recent Note - 4/5/2024 7:22:30 PM
Y - Posted a solid gain today with average (higher) volume, finding support near its 50 DMA line ($770). Prior lows in the $730 area define the next important near-term support to watch.
>>> FEATURED STOCK ARTICLE : NOW Quietly Rebounded Above 50-Day Moving Average Line - 3/20/2024 |
View all notes |
Set NEW NOTE alert |
Company Profile |
SEC
News |
Chart |
Request a new note
C
A
S
I |
Symbol/Exchange
Company Name
Industry Group |
PRICE |
CHANGE
(%Change) |
Day High |
Volume
(% DAV)
(% 50 day avg vol) |
52 Wk Hi
% From Hi |
Featured
Date |
Price
Featured |
Pivot Featured |
|
Max Buy |
SNPS
-
NASDAQ
Synopsys
Computer Sftwr-Design
|
$574.71
|
+7.60
1.34% |
$578.90
|
773,639
70.27% of 50 DAV
50 DAV is 1,101,000
|
$629.38
-8.69%
|
2/22/2024
|
$600.65
|
PP = $582.85
|
|
MB = $611.99
|
Most Recent Note - 4/5/2024 7:35:58 PM
Y - Volume totals have been cooling while still consolidating just above near-term support at its 50 DMA line ($566). More damaging losses would raise concerns and trigger a technical sell signal. Previously noted - " A strong volume-driven gain and close above the pivot point is needed to clinch a proper technical buy signal."
>>> FEATURED STOCK ARTICLE : Rallying From Support at 50-Day Moving Average Line - 3/19/2024 |
View all notes |
Set NEW NOTE alert |
Company Profile |
SEC
News |
Chart |
Request a new note
C
A
S
I |
PAY
-
NYSE
Paymentus Holdings
Finance-CrdtCard/PmtPr
|
$20.68
|
+0.13
0.63% |
$20.74
|
349,616
96.31% of 50 DAV
50 DAV is 363,000
|
$25.21
-17.97%
|
3/5/2024
|
$19.97
|
PP = $18.89
|
|
MB = $19.83
|
Most Recent Note - 4/4/2024 3:58:14 PM
G - Suffering a 4th consecutive loss today with above-average volume. It is extended from the previously noted base. Its 50 DMA line ($18.60) coincides with prior highs in the $18 range defining important support to watch on pullbacks.
>>> FEATURED STOCK ARTICLE : Consolidating After Powerful Breakout and Volume-Driven Gains - 3/27/2024 |
View all notes |
Set NEW NOTE alert |
Company Profile |
SEC
News |
Chart |
Request a new note
C
A
S
I |
HUBS
-
NYSE
HubSpot
Comp Sftwr-Spec Enterprs
|
$670.00
|
+12.15
1.85% |
$688.87
|
916,674
180.45% of 50 DAV
50 DAV is 508,000
|
$693.85
-3.44%
|
4/4/2024
|
$686.66
|
PP = $660.10
|
|
MB = $693.11
|
Most Recent Note - 4/5/2024 11:51:26 AM
Y - Gapped up today and on track for a solid gain. On the prior session it finished in middle of its intra-day range after highlighted yellow in the mid-day report with pivot point cited based on its 2/09/24 high plus 10 cents. Hit a new 52-week high with a volume-driven gain triggering a technical buy signal after finding prompt support at its 50 DMA line ($617) in recent weeks. Reported Dec '23 quarterly earnings +59% on +24% sales revenues versus the year-ago period, its 6th consecutive quarterly comparison well above the +25% minimum guideline (C criteria). Annual earnings history (A criteria) has been strong. Faces some resistance due to old overhead supply up to the $866 level. See the latest FSU analysis for more details and a new annotated graph.
>>> FEATURED STOCK ARTICLE : Encountered Distributional Pressure and Finished Below Pivot Point - 4/4/2024 |
View all notes |
Set NEW NOTE alert |
Company Profile |
SEC
News |
Chart |
Request a new note
C
A
S
I |
|
|
|
THESE ARE NOT BUY RECOMMENDATIONS!
Comments contained in the body of this report are technical
opinions only. The material herein has been obtained
from sources believed to be reliable and accurate, however,
its accuracy and completeness cannot be guaranteed.
This site is not an investment advisor, hence it does
not endorse or recommend any securities or other investments.
Any recommendation contained in this report may not
be suitable for all investors and it is not to be deemed
an offer or solicitation on our part with respect to
the purchase or sale of any securities. All trademarks,
service marks and trade names appearing in this report
are the property of their respective owners, and are
likewise used for identification purposes only.
This report is a service available
only to active Paid Premium Members.
You may opt-out of receiving report notifications
at any time. Questions or comments may be submitted
by writing to Premium Membership Services 665 S.E. 10 Street, Suite 201 Deerfield Beach, FL 33441-5634 or by calling 1-800-965-8307
or 954-785-1121.
|
|
|