You are not logged in.
This means you
CAN ONLY VIEW reports that were published prior to Monday, April 14, 2025.
You
MUST UPGRADE YOUR MEMBERSHIP if you want to see any current reports.
AFTER MARKET UPDATE - TUESDAY, APRIL 8TH, 2014
Previous After Market Report Next After Market Report >>>
|
|
|
|
DOW |
+10.27 |
16,256.14 |
+0.06% |
|
Volume |
732,607,480 |
-11% |
|
Volume |
2,040,470,240 |
-14% |
|
NASDAQ |
+33.24 |
4,112.99 |
+0.81% |
|
Advancers |
2,090 |
66% |
|
Advancers |
1,868 |
65% |
|
S&P 500 |
+6.92 |
1,851.96 |
+0.38% |
|
Decliners |
968 |
30% |
|
Decliners |
924 |
32% |
|
Russell 2000 |
+8.46 |
1,144.24 |
+0.74% |
|
52 Wk Highs |
33 |
|
|
52 Wk Highs |
24 |
|
|
S&P 600 |
+5.61 |
660.40 |
+0.86% |
|
52 Wk Lows |
14 |
|
|
52 Wk Lows |
36 |
|
|
 |
Major Averages Rose With Less Volume Conviction
Kenneth J. Gruneisen - Passed the CAN SLIM® Master's Exam
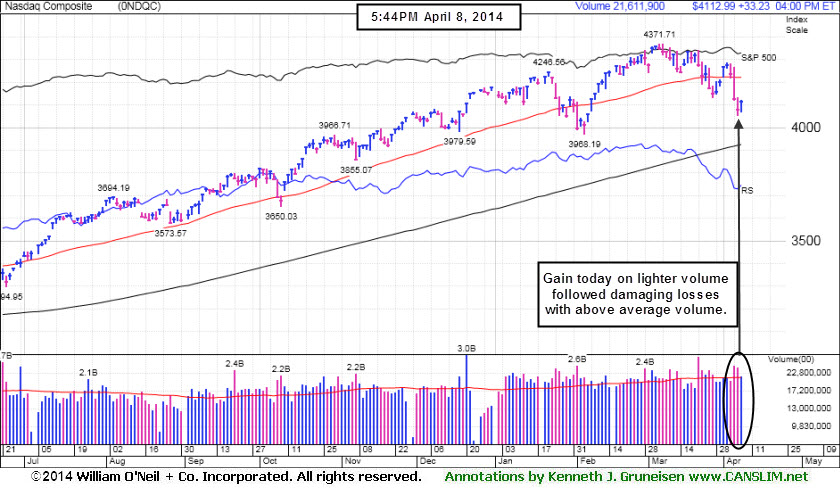
The major averages snapped a three-day slump on Tuesday. The volume totals behind the gains were reported lighter on the NYSE and on the Nasdaq exchange, a sign of lackluster buying demand from the institutional crowd. Advancers led decliners by a 2-1 margin on the NYSE and on the Nasdaq exchange. There were only 9 high-ranked companies from the CANSLIM.net Leaders List that made new 52-week highs and appeared on the CANSLIM.net BreakOuts Page, from the total of 6 stocks on the prior session. The list of stocks hitting new 52-week highs outnumbered new 52-week lows on the NYSE however new lows outnumbered new highs on the Nasdaq exchange. There were gains for 4 of the 5 high-ranked companies currently included on the Featured Stocks Page, a list that has grown shorter as numerous leaders have broken down in recent weeks. The Market (M criteria) pullback again earned the label of a "correction" as a result of the latest pressure on the indices, especially the tech-heavy Nasdaq Composite Index, coupled with waning leadership (fewer stocks hitting new 52-week highs). Investors are reminded to limit losses by always selling any stock that falls more than -7% from their purchase price. This is precisely how the fact-based investment system prompts investors to reduce their overall market exposure during weak periods.
 The Dow gained 10 points to 16256. The S&P 500 edged back into positive territory for the year as it increased more than 6 points to close at 1,851. The NASDAQ rose 33 points to 4112 after posting its worst three-day decline since 2011. Stocks advanced as technology shares including Oracle (ORCL +2.1%) and Facebook (FB +2.1%) staged a rebound. The utilities and energy sectors also helped lift the market with small gains for NextEra Energy (NEE +2.8%) and Exxon Mobil (XOM +0.8%). On the downside, the health care group fell as biotechnology stocks extended their recent losing streak. Gilead Sciences (GILD -3%) and Biogen (BIIB -2.4%) fell. Telecommunications also finished lower, led by AT&T's (T -0.8%) retreat.
Overall, Tuesday's gains came before the start of first-quarter earnings season which kicked off after the close. Consensus estimates are for S&P 500 profits to grow +1% for the three-month period, according to Bloomberg data.
Treasury prices advanced for a fourth day after a government auction of three-notes attracted better-than-average demand. The 10-year note gained 6/32 to yield 2.68%. The 30-year bond rose 10/32 to yield 3.54%.
The CANSLIM.net Featured Stocks Page shows the most action-worthy candidates and their latest notes and a Headline Link directs members to the latest detailed analysis with data-packed graphs annotated by a Certified expert along with links to additional resources. The Premium Member Homepage includes "dynamic archives" to all prior pay reports published. Watch for an announcement via email concerning the next WEBCAST.
PICTURED: The Nasdaq Composite Index tallied a gain with lighter volume following damaging losses with above average volume which sent the tech-heavy index slumping below its 50-day moving average (DMA) line. Deterioration adds emphasis on the importance for investors to use caution and currently aim toward reducing market exposure.
|
 Kenneth J. Gruneisen started out as a licensed stockbroker in August 1987, a couple of months prior to the historic stock market crash that took the Dow Jones Industrial Average down -22.6% in a single day. He has published daily fact-based fundamental and technical analysis on high-ranked stocks online for two decades. Through FACTBASEDINVESTING.COM, Kenneth provides educational articles, news, market commentary, and other information regarding proven investment systems that work in good times and bad.
Comments contained in the body of this report are technical opinions only and are not necessarily those of Gruneisen Growth Corp. The material herein has been obtained from sources believed to be reliable and accurate, however, its accuracy and completeness cannot be guaranteed. Our firm, employees, and customers may effect transactions, including transactions contrary to any recommendation herein, or have positions in the securities mentioned herein or options with respect thereto. Any recommendation contained in this report may not be suitable for all investors and it is not to be deemed an offer or solicitation on our part with respect to the purchase or sale of any securities. |
|
 |
Retail, Broker/Dealer, Tech and Commodity-Linked Groups Rose
Kenneth J. Gruneisen - Passed the CAN SLIM® Master's Exam
The Retail Index ($RLX +1.25%) was a positive influence on the major averages and the Broker/Dealer Index ($XBD +0.56%) posted a modest gain while the Bank Index ($BKX +0.03%) finished flat. The Semiconductor Index ($SOX +1.27%) tallied a solid gain and the Networking Index ($NWX +0.73%) rose, meanwhile the Biotechnology Index ($BTK -0.74%) lost ground. Commodity-linked groups also had a positive bias as the Gold & Silver Index ($XAU +2.43%) outpaced the Oil Services Index ($OSX +1.30%) and the Integrated Oil Index ($XOI +0.61%).
Charts courtesy www.stockcharts.com
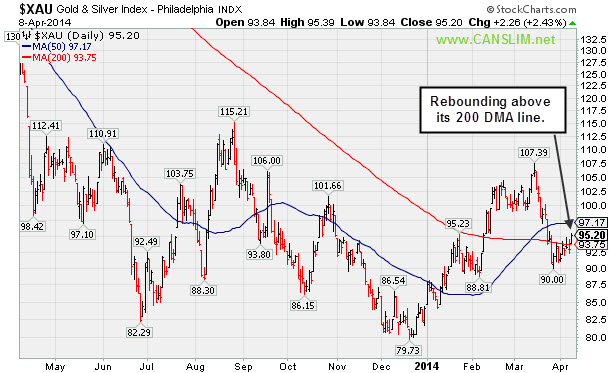
PICTURED: The Gold & Silver Index ($XAU +2.43%) has rebounded above its 200-day moving average (DMA) line. Although it abruptly declined in March the shorter-term 50 DMA line has recently converged and crossed above its 200 DMA line which is an encouraging sign.
| Oil Services |
$OSX |
288.42 |
+3.69 |
+1.30% |
+2.63% |
| Integrated Oil |
$XOI |
1,531.62 |
+9.30 |
+0.61% |
+1.89% |
| Semiconductor |
$SOX |
581.18 |
+7.27 |
+1.27% |
+8.63% |
| Networking |
$NWX |
334.39 |
+2.41 |
+0.73% |
+3.23% |
| Broker/Dealer |
$XBD |
152.00 |
+0.85 |
+0.56% |
-5.33% |
| Retail |
$RLX |
877.12 |
+10.87 |
+1.25% |
-6.67% |
| Gold & Silver |
$XAU |
95.20 |
+2.26 |
+2.43% |
+13.13% |
| Bank |
$BKX |
70.59 |
+0.02 |
+0.03% |
+1.92% |
| Biotech |
$BTK |
2,489.13 |
-18.55 |
-0.74% |
+6.81% |
|
|
|
 |
Fell -54.9% in Year After Dropped From Featured Stocks List
Kenneth J. Gruneisen - Passed the CAN SLIM® Master's Exam
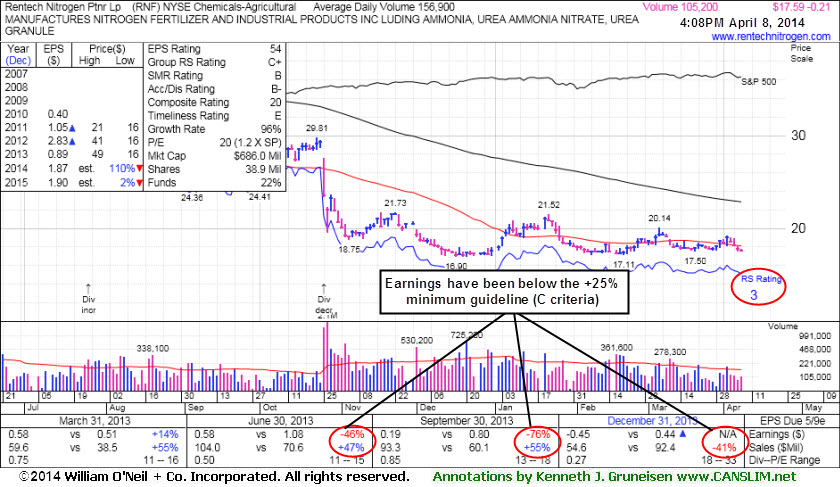
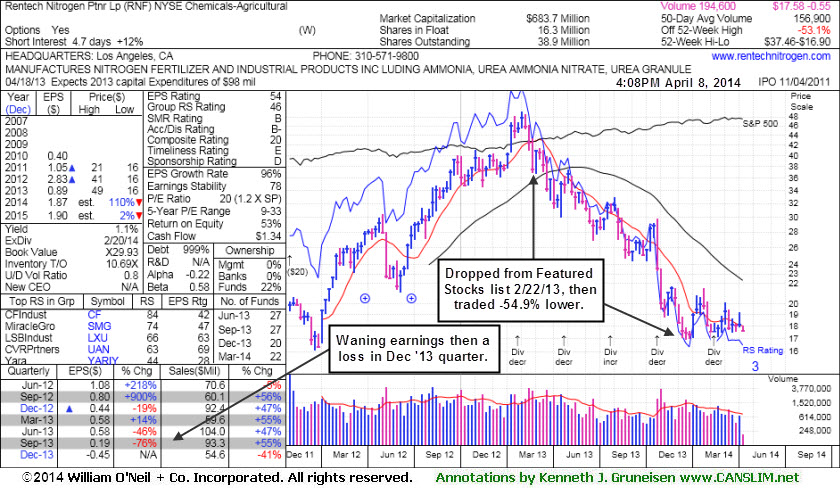
Market conditions (the M criteria) are challenging at times. There are few stocks included on the Featured Stocks list and none of the companies need additional review in detail with annotated graphs. At times like these we have an opportunity to look back and review previously featured stocks which were dropped. This can serve as an educational review of the investment system's tactics and a reminder that high-ranked leaders eventually fall out of favor. In this example we look back at a company dropped from the Featured Stocks list on February 22, 2013. Since then its fundamentals have deteriorated and it has fallen even more out of favor with the institutional crowd while trading as much as -54.9% lower.
Rentech Nitrogen Ptnr LP (RNF -$0.21 to $17.59) made its last appearance in this FSU section on 2/22/13 when it was dropped from the Featured Stocks list. Annotated graphs were included under the headline, "Damaging Losses on Heavy Volume Violated Old Highs", as heavy volume more than 3 times average followed the prior session's gap down after violating its 50-day moving average (DMA) line. The damaging losses sent it below prior highs near $40-41 and the weak action raised serious concerns while triggering additional technical sell signals. Not all stocks dropped from the Featured Stocks list fall as badly, but this is a vivid example of why investors should follow the investment system's sell rules and reduce the possibility of more devastating losses.
It was previously noted with caution - "The number of top-rated funds owning its shares had fallen from 52 in Jun '12 to 36 as of Dec '12, a disconcerting sign concerning the I criteria. Only 22 top-rated funds owned it by Dec '13. Repeating a point emphasized before in this FSU section - "Disciplined investors avoid chasing extended stocks more than +5% above their pivot point. Making sloppy buy decisions by chasing extended stocks invites a much greater chance that an ordinary consolidation might prompt investors to invoke the investment system's strict loss-limiting sell rule after a pullback of -7% or more from their purchase price."
|
|
|
Color Codes Explained :
Y - Better candidates highlighted by our
staff of experts.
G - Previously featured
in past reports as yellow but may no longer be buyable under the
guidelines.
***Last / Change / Volume data in this table is the closing quote data***
Symbol/Exchange
Company Name
Industry Group |
PRICE |
CHANGE
(%Change) |
Day High |
Volume
(% DAV)
(% 50 day avg vol) |
52 Wk Hi
% From Hi |
Featured
Date |
Price
Featured |
Pivot Featured |
|
Max Buy |
EQM
-
NYSE
E Q T Midstream Partners
ENERGY - Oil and Gas Pipelines
|
$71.22
|
+0.09
0.13% |
$71.75
|
81,941
71.25% of 50 DAV
50 DAV is 115,000
|
$73.43
-3.01%
|
12/12/2013
|
$53.17
|
PP = $56.51
|
|
MB = $59.34
|
 Most Recent Note - 4/8/2014 6:24:49 PM
G - Still holding its ground and making gradual progress since reporting earnings -2% on +22% sales revenues for the Dec '13 quarter, below the +25% minimum earnings guideline (C criteria), raising fundamental concerns. Its 50 DMA line defines near-term support where a violation may trigger a technical sell signal.
>>> FEATURED STOCK ARTICLE : Hit New Highs But Fundamental Concerns Remain - 3/21/2014
View all notes |
Set NEW NOTE alert |
CANSLIM.net Company Profile |
SEC
News |
Chart |
Request a new note
C
A N
S L
I M


|
GNRC
-
NYSE
Generac Hldgs Inc
Electrical-Power/Equipmt
|
$58.01
|
+1.63
2.89% |
$58.50
|
594,310
72.39% of 50 DAV
50 DAV is 821,000
|
$62.50
-7.18%
|
2/14/2014
|
$56.50
|
PP = $57.39
|
|
MB = $60.26
|
Most Recent Note - 4/8/2014 6:27:04 PM
Y - Finding support at its 50 DMA line and near prior highs in the $57 area. More damaging losses below its recent low ($56.38 on 3/27/14) would raise greater concerns.
>>> FEATURED STOCK ARTICLE : Perched Near Highs With Mostly Quiet Volume Totals - 3/31/2014
View all notes |
Set NEW NOTE alert |
CANSLIM.net Company Profile |
SEC
News |
Chart |
Request a new note
C
A N
S L
I M
|
ICON
-
NASDAQ
Iconix Brand Group Inc
CONSUMER NON-DURABLES - Textile - Apparel Footwear
|
$37.80
|
-0.01
-0.01% |
$38.12
|
293,883
47.24% of 50 DAV
50 DAV is 622,100
|
$42.47
-11.00%
|
3/7/2014
|
$41.46
|
PP = $40.88
|
|
MB = $42.92
|
Most Recent Note - 4/4/2014 7:16:06 PM
G - Color code is changed to green after a loss on near average volume violated its 50 DMA line and prior low. The deterioration raised greater concerns and triggered a technical sell signal. Only a prompt rebound above the 50 DMA line would help its outlook.
>>> FEATURED STOCK ARTICLE : Falling Back Under Prior Highs Raises Concerns - 3/25/2014
View all notes |
Set NEW NOTE alert |
CANSLIM.net Company Profile |
SEC
News |
Chart |
Request a new note
C
A N
S L
I M
|
PSIX
-
NASDAQ
Power Solutions Intl Inc
Machinery-Gen Industrial
|
$74.00
|
+2.63
3.69% |
$77.75
|
114,588
173.62% of 50 DAV
50 DAV is 66,000
|
$87.40
-15.33%
|
2/28/2014
|
$74.65
|
PP = $76.93
|
|
MB = $80.78
|
Most Recent Note - 4/8/2014 6:22:05 PM
Y - Rebounded above its 50 DMA line with today's volume-driven gain and its color code is changed to yellow. The prior session's low ($66.03) defines important near-term support where further deterioration would raise greater concerns.
>>> FEATURED STOCK ARTICLE : Found Prompt Support Near 50-Day Average After Dip Back Into Prior Base - 4/1/2014
View all notes |
Set NEW NOTE alert |
CANSLIM.net Company Profile |
SEC
News |
Chart |
Request a new note
C
A N
S L
I M
|
SILC
-
NASDAQ
Silicom Ltd
COMPUTER HARDWARE - Networking andamp; Communication Dev
|
$59.43
|
+0.23
0.39% |
$59.96
|
38,278
44.51% of 50 DAV
50 DAV is 86,000
|
$73.44
-19.08%
|
12/23/2013
|
$44.62
|
PP = $46.25
|
|
MB = $48.56
|
Most Recent Note - 4/4/2014 12:46:41 PM
G - Slumping today near a recent low ($58.12 on 3/26/14) where a violation may trigger a more worrisome technical sell signal. Halted its slide following a damaging 50 DMA line violation last week. A rebound above that important short-term average would help its outlook improve. See the latest FSU analysis for more details and a new annotated graph.
>>> FEATURED STOCK ARTICLE : Halted Slide Following 50-Day Moving Average Violation - 4/3/2014
View all notes |
Set NEW NOTE alert |
CANSLIM.net Company Profile |
SEC
News |
Chart |
Request a new note
C
A N
S L
I M
|
Symbol/Exchange
Company Name
Industry Group |
PRICE |
CHANGE
(%Change) |
Day High |
Volume
(% DAV)
(% 50 day avg vol) |
52 Wk Hi
% From Hi |
Featured
Date |
Price
Featured |
Pivot Featured |
|
Max Buy |
|
|
|
THESE ARE NOT BUY RECOMMENDATIONS!
Comments contained in the body of this report are technical
opinions only. The material herein has been obtained
from sources believed to be reliable and accurate, however,
its accuracy and completeness cannot be guaranteed.
This site is not an investment advisor, hence it does
not endorse or recommend any securities or other investments.
Any recommendation contained in this report may not
be suitable for all investors and it is not to be deemed
an offer or solicitation on our part with respect to
the purchase or sale of any securities. All trademarks,
service marks and trade names appearing in this report
are the property of their respective owners, and are
likewise used for identification purposes only.
This report is a service available
only to active Paid Premium Members.
You may opt-out of receiving report notifications
at any time. Questions or comments may be submitted
by writing to Premium Membership Services 665 S.E. 10 Street, Suite 201 Deerfield Beach, FL 33441-5634 or by calling 1-800-965-8307
or 954-785-1121.
|
|
|

