You are not logged in.
This means you
CAN ONLY VIEW reports that were published prior to Tuesday, April 15, 2025.
You
MUST UPGRADE YOUR MEMBERSHIP if you want to see any current reports.
AFTER MARKET UPDATE - MONDAY, APRIL 7TH, 2014
Previous After Market Report Next After Market Report >>>
|
|
|
|
DOW |
-166.84 |
16,245.87 |
-1.02% |
|
Volume |
818,795,510 |
+7% |
|
Volume |
2,374,944,460 |
-2% |
|
NASDAQ |
-47.97 |
4,079.75 |
-1.16% |
|
Advancers |
831 |
26% |
|
Advancers |
638 |
22% |
|
S&P 500 |
-20.05 |
1,845.04 |
-1.08% |
|
Decliners |
2,235 |
71% |
|
Decliners |
2,140 |
75% |
|
Russell 2000 |
-17.60 |
1,135.78 |
-1.53% |
|
52 Wk Highs |
27 |
|
|
52 Wk Highs |
23 |
|
|
S&P 600 |
-8.65 |
654.79 |
-1.30% |
|
52 Wk Lows |
20 |
|
|
52 Wk Lows |
83 |
|
|
 |
Waning Leadership and Abrupt Retreat Prompts a Shift in Market Stance
Kenneth J. Gruneisen - Passed the CAN SLIM® Master's Exam
The major averages extended their decline to a third day amid continued rotation out of momentum stocks. Behind Monday's losses the volume totals were reported mixed, higher on the NYSE and lower on the Nasdaq exchange, a clear sign of institutional selling termed "distribution". Decliners led advancers by an 8-3 margin on the NYSE and 3-1 on the Nasdaq exchange. Leadership contracted as there were only 6 high-ranked companies from the CANSLIM.net Leaders List that made new 52-week highs and appeared on the CANSLIM.net BreakOuts Page, down abruptly from the total of 36 stocks on the prior session. The list of stocks hitting new 52-week highs outnumbered new 52-week lows on the NYSE however new lows outnumbered new highs on the Nasdaq exchange. There were unanimous losses for the 7 high-ranked companies currently included on the Featured Stocks Page, a list that has grown shorter as numerous leaders have broken down in recent weeks. The Market (M criteria) pullback again earned the label of a "correction" as a result of the latest pressure on the indices, especially the tech-heavy Nasdaq Composite Index, coupled with waning leadership (fewer stocks hitting new 52-week highs). Investors are reminded to limit losses by always selling any stock that falls more than -7% from their purchase price. This is precisely how the fact-based investment system prompts investors to reduce their overall market exposure during weak periods.
On Monday the Dow fell 167 points to 16,245. The S&P 500 was off 20 points to 1,845. The NASDAQ retreated 48 points to 4,079. Nine of 10 sectors in the S&P 500 were down on the session with consumer discretionary the worst performing group as Amazon.com (AMZN -1.62%) and TripAdvisor (TRIP -2.72%) fell. Tech also weighed on the market as Apple (AAPL -1.57%) and Yahoo! (YHOO -3.47%) sank. The defensive telecom and utility sectors were the best performing groups with small gains from Verizon (VZ +0.17%) and Exelon (EXC +0.64%).
Investors also appeared cautious ahead of the start to first-quarter earnings season. Expectations are S&P 500 profits grew 1% for the three-month period, down from a previous forecast of 6.6% in January, according to Bloomberg. There was a small loss for Alcoa (AA -1.27%) which unofficially begins reporting season Tuesday.
On the economic front, a report showed consumer credit unexpectedly increased to $16.5 billion in February. In a speech, St. Louis Fed President James Bullard reiterated that he anticipates inflation picking up to the central bank's stated 2% target.
Treasuries rose with the 10-year note up 7/32 to yield 2.70%.
The CANSLIM.net Featured Stocks Page shows the most action-worthy candidates and their latest notes and a Headline Link directs members to the latest detailed analysis with data-packed graphs annotated by a Certified expert along with links to additional resources. The Premium Member Homepage includes "dynamic archives" to all prior pay reports published. Watch for an announcement via email concerning the next WEBCAST.
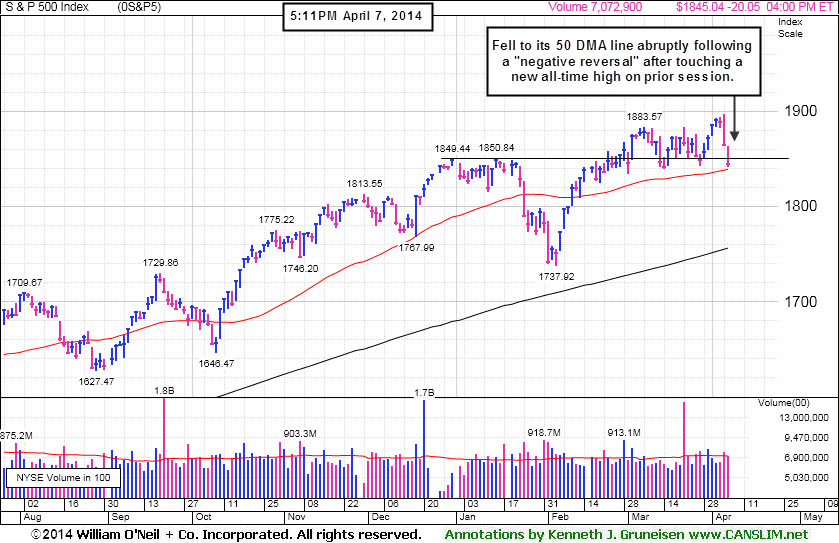
PICTURED: The S&P 500 Index sank near its 50-day moving average (DMA) line, abruptly retreating following a "negative reversal" on Friday after touching a new all-time high. A multi-month upward trendline defines the next important support area below its 50 DMA line. Further deterioration would add additional emphasis on the importance for investors to use caution and currently aim toward reducing market exposure.
|
 Kenneth J. Gruneisen started out as a licensed stockbroker in August 1987, a couple of months prior to the historic stock market crash that took the Dow Jones Industrial Average down -22.6% in a single day. He has published daily fact-based fundamental and technical analysis on high-ranked stocks online for two decades. Through FACTBASEDINVESTING.COM, Kenneth provides educational articles, news, market commentary, and other information regarding proven investment systems that work in good times and bad.
Comments contained in the body of this report are technical opinions only and are not necessarily those of Gruneisen Growth Corp. The material herein has been obtained from sources believed to be reliable and accurate, however, its accuracy and completeness cannot be guaranteed. Our firm, employees, and customers may effect transactions, including transactions contrary to any recommendation herein, or have positions in the securities mentioned herein or options with respect thereto. Any recommendation contained in this report may not be suitable for all investors and it is not to be deemed an offer or solicitation on our part with respect to the purchase or sale of any securities. |
|
 |
Financial, Retail, and Energy-Linked Indexes Fell Worst
Kenneth J. Gruneisen - Passed the CAN SLIM® Master's Exam
The Broker/Dealer Index ($XBD -2.14%) and the Bank Index ($BKX -1.56%) had a negative influence on the major averages and the weakness in the Retail Index ($RLX -1.86%) also weighed on the market. Energy-related shares were weak as the Oil Services Index ($OSX -2.19%) and the Integrated Oil Index ($XOI -1.54%) fell. The Networking Index ($NWX -1.67%) paced the tech sector's decline while the Semiconductor Index ($SOX -0.91%) also fell. The Biotechnology Index ($BTK +0.31%) eked out a small gain while the Gold & Silver Index ($XAU -0.39%) edged lower.
Charts courtesy www.stockcharts.com
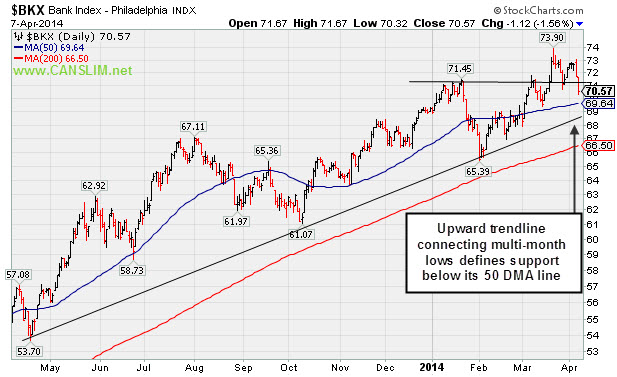
PICTURED: The Bank Index ($BKX -1.56%) undercut its recent low and sank below its January 2014 highs. The upward trendline connecting multi-month lows defines support below its 50-day moving average (DMA) line. Regular readers of this report were reminded on Friday - "Weak action in financial stocks does not bode well for the broader market outlook because the financial groups are usually reliable leading indicators. The major averages have been prone to large downdrafts in the past when financial groups were weak. Further deterioration in financial stocks would raise a caution flag and serve as a reminder for investors to reduce market exposure."
| Oil Services |
$OSX |
284.73 |
-6.39 |
-2.19% |
+1.32% |
| Integrated Oil |
$XOI |
1,522.33 |
-23.88 |
-1.54% |
+1.28% |
| Semiconductor |
$SOX |
573.91 |
-5.28 |
-0.91% |
+7.27% |
| Networking |
$NWX |
331.98 |
-5.65 |
-1.67% |
+2.48% |
| Broker/Dealer |
$XBD |
151.15 |
-3.30 |
-2.14% |
-5.86% |
| Retail |
$RLX |
866.25 |
-16.43 |
-1.86% |
-7.83% |
| Gold & Silver |
$XAU |
92.94 |
-0.36 |
-0.39% |
+10.45% |
| Bank |
$BKX |
70.57 |
-1.12 |
-1.56% |
+1.89% |
| Biotech |
$BTK |
2,507.25 |
+7.68 |
+0.31% |
+7.59% |
|
|
|
 |
Overhead Supply Likely to Hinder Any Subsequent Rally Effort
Kenneth J. Gruneisen - Passed the CAN SLIM® Master's Exam
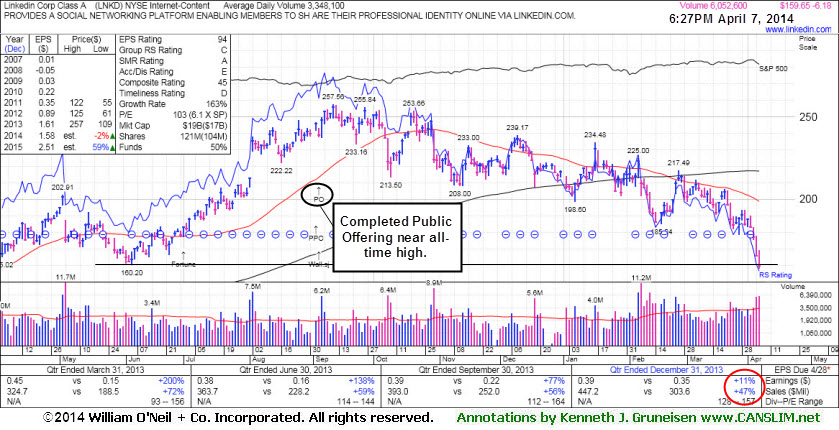
Market conditions (the M criteria) are challenging at times. There are few stocks included on the Featured Stocks list and none of the companies need additional review in detail with annotated graphs. At times like these we have an opportunity to look back and review previously featured stocks which were dropped, which can serve as an educational review of the investment system's tactics and a reminder that high-ranked leaders eventually fall out of favor. In this example, a company dropped from the Featured Stocks list in late May was later repeatedly noted with caution in 10 mid-day reports in August and September 2013, during which time it completed a new Public Offering. Since then, trouble has mounted.
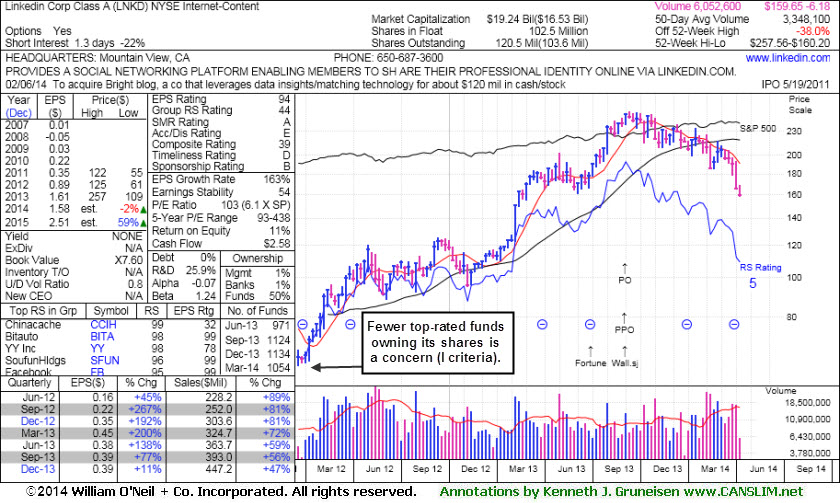
Linkedin Corp (LNKD +$2.00 or +1.10% to $184.31) is not currently Featured Stocks list. It slumped badly with today's 4th consecutive loss, its 2nd consecutive loss marked by heavy volume. It is in poor technical shape, trading well below both its 50-day and its 200-day moving average (DMA) lines which recently converged and crossed over, an ominously bearish signal. Fundamental concerns have also been raised after the latest quarter ended December 31, 2013 versus the year ago period as it reported earnings +11% on +47% sales revenues, below the +25% minimum earnings guideline (C criteria).
It was dropped from the Featured Stocks list on 5/28/13. Weak action of late has LNKD trading near the lows hit after its last appearance in this FSU section long ago on 5/21/13 with annotated graphs under the headline, "Found Encouraging Support at 50-Day Moving Average With Volume-Driven Gains". Subsequent violations raised greater concerns and triggered more worrisome technical sell signals. Some investors may have been frustrated by its rebound and the impressive rally into new high territory that followed. Anyone who held on for the long-term may be in trouble now, as it faces a tremendous amount of overhead supply which is likely to hinder any upward price progress.
The high-ranked leader from the Internet - Content group's Return On Equity of 11% is still below the 17% guideline, which is a minor concern. Ownership by top-rated funds has been on the decline recently, falling from 1,124 in Sep '13 to 1,054 in Mar '14, not an encouraging sign concerning the I criteria. Its current Up/Down Volume Ratio of 0.8 is also an unbiased indication that its shares have been under distributional pressure over the past 50 days.
|
|
|
Color Codes Explained :
Y - Better candidates highlighted by our
staff of experts.
G - Previously featured
in past reports as yellow but may no longer be buyable under the
guidelines.
***Last / Change / Volume data in this table is the closing quote data***
Symbol/Exchange
Company Name
Industry Group |
PRICE |
CHANGE
(%Change) |
Day High |
Volume
(% DAV)
(% 50 day avg vol) |
52 Wk Hi
% From Hi |
Featured
Date |
Price
Featured |
Pivot Featured |
|
Max Buy |
EQM
-
NYSE
E Q T Midstream Partners
ENERGY - Oil and Gas Pipelines
|
$71.13
|
-0.86
-1.19% |
$72.04
|
91,970
79.97% of 50 DAV
50 DAV is 115,000
|
$73.43
-3.13%
|
12/12/2013
|
$53.17
|
PP = $56.51
|
|
MB = $59.34
|
Most Recent Note - 4/2/2014 12:48:26 PM
G - Hitting yet another new high with today's 4th consecutive gain. Held its ground since reporting earnings -2% on +22% sales revenues for the Dec '13 quarter, below the +25% minimum earnings guideline (C criteria), raising fundamental concerns. Its 50 DMA line defines near-term support where a violation may trigger a technical sell signal.
>>> FEATURED STOCK ARTICLE : Hit New Highs But Fundamental Concerns Remain - 3/21/2014
View all notes |
Set NEW NOTE alert |
CANSLIM.net Company Profile |
SEC
News |
Chart |
Request a new note
C
A N
S L
I M


|
FLT
-
NYSE
Fleetcor Technologies
DIVERSIFIED SERVICES - Business/Management Services
|
$109.90
|
-3.12
-2.76% |
$112.47
|
1,689,408
161.67% of 50 DAV
50 DAV is 1,045,000
|
$132.22
-16.88%
|
3/5/2014
|
$125.40
|
PP = $124.06
|
|
MB = $130.26
|
 Most Recent Note - 4/7/2014 7:01:06 PM
Testing its 200 DMA line today with another damaging volume-driven loss. It may find support near that long-term average, meanwhile its prior low ($101.48 on 1/27/14) defines the next important support level. Relative Strength rating has slumped to 70, below the 80+ minimum guideline for buy candidates. It will be dropped from the Featured Stocks list tonight.
>>> FEATURED STOCK ARTICLE : Negated Recent Breakout and Testing Support at 50-Day Average - 3/24/2014
View all notes |
Set NEW NOTE alert |
CANSLIM.net Company Profile |
SEC
News |
Chart |
Request a new note
C
A N
S L
I M
|
GNRC
-
NYSE
Generac Hldgs Inc
Electrical-Power/Equipmt
|
$56.38
|
-1.20
-2.08% |
$57.50
|
641,331
73.46% of 50 DAV
50 DAV is 873,000
|
$62.50
-9.79%
|
2/14/2014
|
$56.50
|
PP = $57.39
|
|
MB = $60.26
|
Most Recent Note - 4/4/2014 7:12:57 PM
Y - Sputtering above prior highs in the $57 area again with today's loss. More damaging losses below its recent low ($56.38 on 3/27/14) would raise greater concerns.
>>> FEATURED STOCK ARTICLE : Perched Near Highs With Mostly Quiet Volume Totals - 3/31/2014
View all notes |
Set NEW NOTE alert |
CANSLIM.net Company Profile |
SEC
News |
Chart |
Request a new note
C
A N
S L
I M
|
ICON
-
NASDAQ
Iconix Brand Group Inc
CONSUMER NON-DURABLES - Textile - Apparel Footwear
|
$37.80
|
-1.10
-2.83% |
$38.99
|
540,732
86.70% of 50 DAV
50 DAV is 623,700
|
$42.47
-10.99%
|
3/7/2014
|
$41.46
|
PP = $40.88
|
|
MB = $42.92
|
Most Recent Note - 4/4/2014 7:16:06 PM
G - Color code is changed to green after a loss on near average volume violated its 50 DMA line and prior low. The deterioration raised greater concerns and triggered a technical sell signal. Only a prompt rebound above the 50 DMA line would help its outlook.
>>> FEATURED STOCK ARTICLE : Falling Back Under Prior Highs Raises Concerns - 3/25/2014
View all notes |
Set NEW NOTE alert |
CANSLIM.net Company Profile |
SEC
News |
Chart |
Request a new note
C
A N
S L
I M
|
KORS
-
NYSE
Michael Kors Hldgs Ltd
RETAIL - Apparel Stores
|
$86.59
|
-2.95
-3.29% |
$89.32
|
5,435,037
175.15% of 50 DAV
50 DAV is 3,103,000
|
$101.04
-14.30%
|
3/12/2014
|
$98.03
|
PP = $101.14
|
|
MB = $106.20
|
Most Recent Note - 4/7/2014 6:57:24 PM
Sank further below its 50 DMA line and deeply undercut the recent low ($89.43 on 3/27/14) with today's damaging loss on higher volume. The deterioration raised greater concerns and triggered a more worrisome technical sell signal. It will be dropped from the Featured Stocks list tonight.
>>> FEATURED STOCK ARTICLE : Fell Below 50-Day Average Line With 6th Consecutive Loss - 3/27/2014
View all notes |
Set NEW NOTE alert |
CANSLIM.net Company Profile |
SEC
News |
Chart |
Request a new note
C
A N
S L
I M
|
Symbol/Exchange
Company Name
Industry Group |
PRICE |
CHANGE
(%Change) |
Day High |
Volume
(% DAV)
(% 50 day avg vol) |
52 Wk Hi
% From Hi |
Featured
Date |
Price
Featured |
Pivot Featured |
|
Max Buy |
PSIX
-
NASDAQ
Power Solutions Intl Inc
Machinery-Gen Industrial
|
$71.37
|
-3.31
-4.43% |
$73.95
|
103,589
154.61% of 50 DAV
50 DAV is 67,000
|
$87.40
-18.34%
|
2/28/2014
|
$74.65
|
PP = $76.93
|
|
MB = $80.78
|
Most Recent Note - 4/7/2014 6:55:45 PM
G - Violated its 50 DMA line with today's 3rd consecutive volume-driven loss raising concerns and its color code is changed to green. Undercut its recent low ($68.80 on 3/27/14) then rebounded to close in the upper third of its intra-day range.
>>> FEATURED STOCK ARTICLE : Found Prompt Support Near 50-Day Average After Dip Back Into Prior Base - 4/1/2014
View all notes |
Set NEW NOTE alert |
CANSLIM.net Company Profile |
SEC
News |
Chart |
Request a new note
C
A N
S L
I M
|
SILC
-
NASDAQ
Silicom Ltd
COMPUTER HARDWARE - Networking andamp; Communication Dev
|
$59.20
|
-0.89
-1.48% |
$60.30
|
80,182
89.09% of 50 DAV
50 DAV is 90,000
|
$73.44
-19.39%
|
12/23/2013
|
$44.62
|
PP = $46.25
|
|
MB = $48.56
|
Most Recent Note - 4/4/2014 12:46:41 PM
G - Slumping today near a recent low ($58.12 on 3/26/14) where a violation may trigger a more worrisome technical sell signal. Halted its slide following a damaging 50 DMA line violation last week. A rebound above that important short-term average would help its outlook improve. See the latest FSU analysis for more details and a new annotated graph.
>>> FEATURED STOCK ARTICLE : Halted Slide Following 50-Day Moving Average Violation - 4/3/2014
View all notes |
Set NEW NOTE alert |
CANSLIM.net Company Profile |
SEC
News |
Chart |
Request a new note
C
A N
S L
I M
|
|
|
|
THESE ARE NOT BUY RECOMMENDATIONS!
Comments contained in the body of this report are technical
opinions only. The material herein has been obtained
from sources believed to be reliable and accurate, however,
its accuracy and completeness cannot be guaranteed.
This site is not an investment advisor, hence it does
not endorse or recommend any securities or other investments.
Any recommendation contained in this report may not
be suitable for all investors and it is not to be deemed
an offer or solicitation on our part with respect to
the purchase or sale of any securities. All trademarks,
service marks and trade names appearing in this report
are the property of their respective owners, and are
likewise used for identification purposes only.
This report is a service available
only to active Paid Premium Members.
You may opt-out of receiving report notifications
at any time. Questions or comments may be submitted
by writing to Premium Membership Services 665 S.E. 10 Street, Suite 201 Deerfield Beach, FL 33441-5634 or by calling 1-800-965-8307
or 954-785-1121.
|
|
|

