You are not logged in.
This means you
CAN ONLY VIEW reports that were published prior to Tuesday, April 15, 2025.
You
MUST UPGRADE YOUR MEMBERSHIP if you want to see any current reports.
AFTER MARKET UPDATE - WEDNESDAY, APRIL 9TH, 2014
Previous After Market Report Next After Market Report >>>
|
|
|
|
DOW |
+181.04 |
16,437.18 |
+1.11% |
|
Volume |
688,238,680 |
-6% |
|
Volume |
1,822,219,210 |
-11% |
|
NASDAQ |
+70.91 |
4,183.90 |
+1.72% |
|
Advancers |
2,241 |
71% |
|
Advancers |
2,064 |
73% |
|
S&P 500 |
+20.22 |
1,872.18 |
+1.09% |
|
Decliners |
806 |
26% |
|
Decliners |
675 |
24% |
|
Russell 2000 |
+15.73 |
1,159.96 |
+1.37% |
|
52 Wk Highs |
78 |
|
|
52 Wk Highs |
38 |
|
|
S&P 600 |
+6.50 |
666.90 |
+0.98% |
|
52 Wk Lows |
10 |
|
|
52 Wk Lows |
23 |
|
|
 |
Major Averages Posted Big Gains With Less Volume Conviction
Kenneth J. Gruneisen - Passed the CAN SLIM® Master's Exam
The major averages posted big gains on Wednesday. However, the volume totals behind the gains were reported lighter on the NYSE and on the Nasdaq exchange, again a sign of lackluster buying demand coming from the institutional crowd. Advancers led decliners by nearly a 3-1 margin on the NYSE and on the Nasdaq exchange. There were 15 high-ranked companies from the CANSLIM.net Leaders List that made new 52-week highs and appeared on the CANSLIM.net BreakOuts Page, up from the total of 9 stocks on the prior session. The list of stocks hitting new 52-week highs outnumbered new 52-week lows on the NYSE and on the Nasdaq exchange. There were gains for 4 of the 5 high-ranked companies currently included on the Featured Stocks Page, a list that has grown shorter as numerous leaders have broken down in recent weeks. The Market (M criteria) pullback earned the label of a "correction" as a result of recent pressure on the indices, especially the tech-heavy Nasdaq Composite Index, coupled with waning leadership (fewer stocks hitting new 52-week highs). Investors are reminded to limit losses by always selling any stock that falls more than -7% from their purchase price. This is precisely how the fact-based investment system prompts investors to reduce their overall market exposure during weak periods.
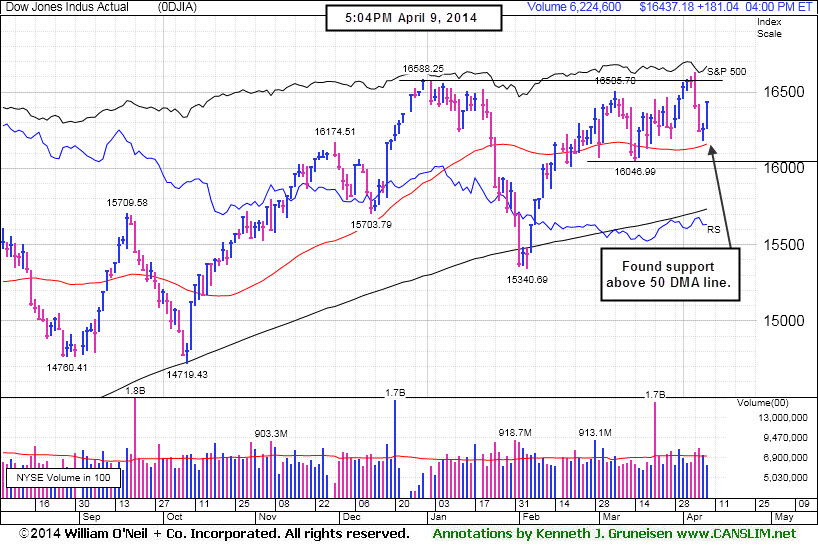
The major averages staged a rally on Wednesday. The Dow gained 181 points to 16,437. The S&P 500 increased 20 points to close at 1,872. The NASDAQ rose 70 points to 4,183.
A promising start to first-quarter earnings season and further insight into the Fed's monetary policy outlook helped stocks advance for a second day. The minutes from the March FOMC meeting revealed the central bank intends to keep its short-term rate near zero for an extended period of time.
Overall, eight of the 10 S&P 500 sectors finished in positive territory. Health care and materials were among the best performing groups. Celgene (CELG +6.4%). Alcoa (AA +3.4%) rose after posting a better-than-expected profit tally and the company delivered an encouraging forecast for global aluminum demand. Technology stocks also helped lift the market thanks to Facebook's (FB +7%) jump. The more defensive telecommunications and utilities groups declined including shares of AT&T (T -1.2%) and Duke Energy (DUK -1%).
Treasuries snapped a four-day winning streak and a government auction of 10-year debt attracted weaker-than-average demand. The 10-year note fell 3/32 to yield 2.69%. The 30-year bond declined by more than half of a point to yield 3.57%.
The CANSLIM.net Featured Stocks Page shows the most action-worthy candidates and their latest notes and a Headline Link directs members to the latest detailed analysis with data-packed graphs annotated by a Certified expert along with links to additional resources. The Premium Member Homepage includes "dynamic archives" to all prior pay reports published. Watch for an announcement via email concerning the next WEBCAST.
PICTURED: The Dow Jones Industrial Average tallied a gain while consolidating above its 50-day moving average (DMA) line. Deterioration below that important short-term average by the Blue Chip index would add emphasis on the importance for investors to use caution and currently aim toward reducing market exposure.
|
 Kenneth J. Gruneisen started out as a licensed stockbroker in August 1987, a couple of months prior to the historic stock market crash that took the Dow Jones Industrial Average down -22.6% in a single day. He has published daily fact-based fundamental and technical analysis on high-ranked stocks online for two decades. Through FACTBASEDINVESTING.COM, Kenneth provides educational articles, news, market commentary, and other information regarding proven investment systems that work in good times and bad.
Comments contained in the body of this report are technical opinions only and are not necessarily those of Gruneisen Growth Corp. The material herein has been obtained from sources believed to be reliable and accurate, however, its accuracy and completeness cannot be guaranteed. Our firm, employees, and customers may effect transactions, including transactions contrary to any recommendation herein, or have positions in the securities mentioned herein or options with respect thereto. Any recommendation contained in this report may not be suitable for all investors and it is not to be deemed an offer or solicitation on our part with respect to the purchase or sale of any securities. |
|
 |
Retail, Financial, Tech, and Commodity-Linked Groups Rose
Kenneth J. Gruneisen - Passed the CAN SLIM® Master's Exam
The Broker/Dealer Index ($XBD +1.39%) and Bank Index ($BKX +0.51%) posted gains on Wednesday along with the influential Retail Index ($RLX +1.13%). Tech shares had a positive bias as the Networking Index ($NWX +0.99%) and the Semiconductor Index ($SOX +1.13%) posted gains. The Gold & Silver Index ($XAU +0.61%) edged higher and the Integrated Oil Index ($XOI +1.13%) posted a solid gain while the Oil Services Index ($OSX +0.08%) finished flat.
Charts courtesy www.stockcharts.com
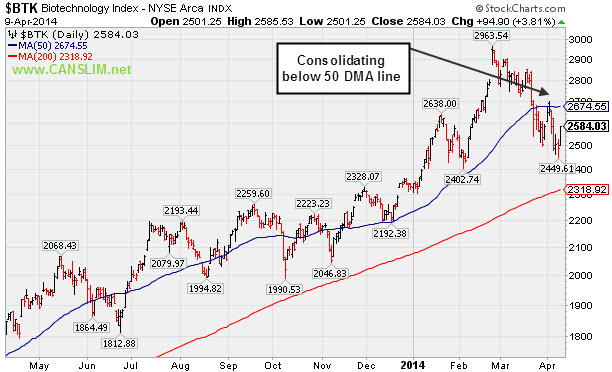
PICTURED: The Biotechnology Index ($BTK +3.82%) was a standout gainer on Wednesday, however it is still consolidating below its 50-day moving average (DMA) line.
| Oil Services |
$OSX |
288.65 |
+0.23 |
+0.08% |
+2.71% |
| Integrated Oil |
$XOI |
1,548.91 |
+17.29 |
+1.13% |
+3.05% |
| Semiconductor |
$SOX |
587.72 |
+6.54 |
+1.13% |
+9.85% |
| Networking |
$NWX |
337.69 |
+3.30 |
+0.99% |
+4.24% |
| Broker/Dealer |
$XBD |
154.11 |
+2.12 |
+1.39% |
-4.02% |
| Retail |
$RLX |
887.06 |
+9.94 |
+1.13% |
-5.61% |
| Gold & Silver |
$XAU |
95.78 |
+0.58 |
+0.61% |
+13.82% |
| Bank |
$BKX |
70.95 |
+0.36 |
+0.51% |
+2.44% |
| Biotech |
$BTK |
2,584.18 |
+95.05 |
+3.82% |
+10.89% |
|
|
|
 |
Technical Strength Continues Despite Fundamental Concerns
Kenneth J. Gruneisen - Passed the CAN SLIM® Master's Exam
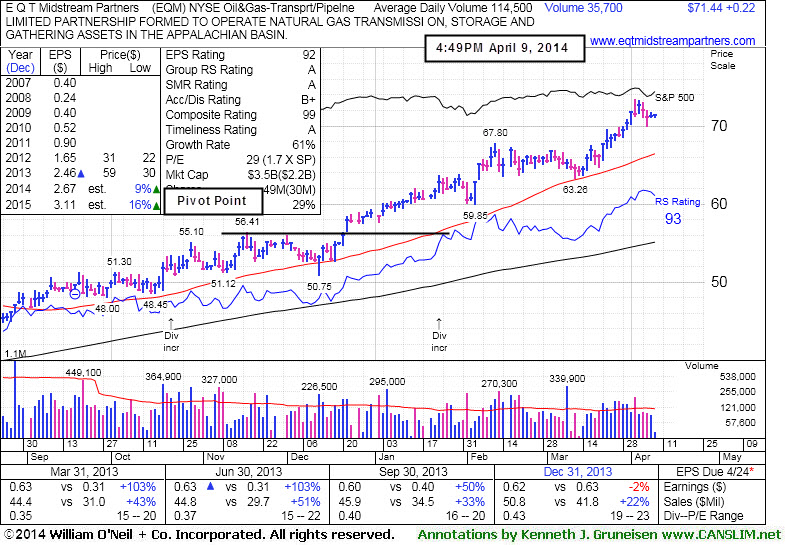
E Q T Midstream Partners (EQM +$0.22 or +0.31% to $71.44) has been stubbornly holding its ground and making gradual progress since reporting earnings -2% on +22% sales revenues for the Dec '13 quarter, below the +25% minimum earnings guideline (C criteria), raising fundamental concerns. Its 50-day moving average (DMA) line ($66.44 now) defines near-term support where a violation may trigger a technical sell signal. Its last appearance in this FSU section was on 3/21/14 under the headline, "Hit New Highs But Fundamental Concerns Remain".
It traded up as much as +38.1% since first highlighted in yellow in the 12/12/13 mid-day report (read here) with new pivot point cited based on its 11/18/13 high plus 10 cents. The fact-based system suggests watching for technical sell signals rather than selling purely on fundmentals, yet is wise to sometimes lock in gains at the +20% level. For those watching it and still giving it the benefit of the doubt, recent lows in the $63 area define near-term support below its 50 DMA line where subsequent violations may trigger more worrisome technical sell signals.
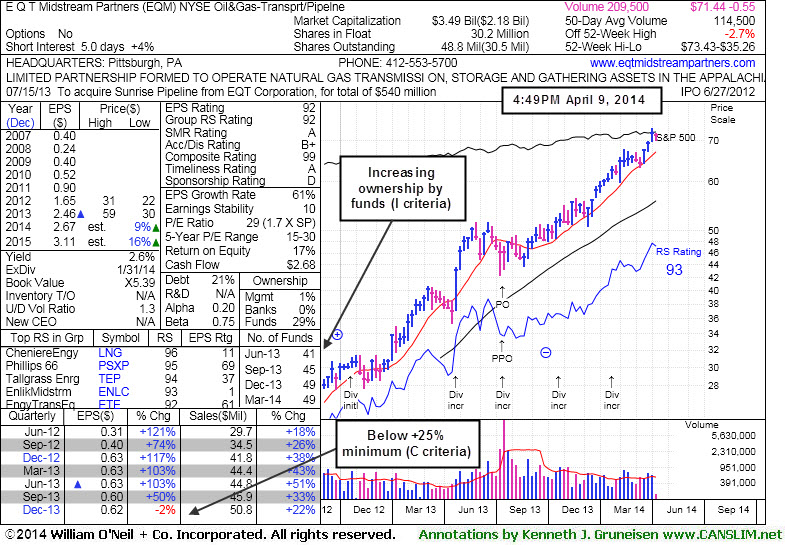
It completed a new Public Offering on 7/16/13, then made gradual progress afterward. This MLP in the Natural Gas business has seen the number of top-rated funds owning its shares rise from 20 in Jun '12 to 49 in Dec '13, a reassuring sign concerning the I criteria. Its Up/Down Volume Ratio of 1.3 is an unbiased indication its shares have been under accumulation over the past 50 days.
|
|
|
Color Codes Explained :
Y - Better candidates highlighted by our
staff of experts.
G - Previously featured
in past reports as yellow but may no longer be buyable under the
guidelines.
***Last / Change / Volume data in this table is the closing quote data***
Symbol/Exchange
Company Name
Industry Group |
PRICE |
CHANGE
(%Change) |
Day High |
Volume
(% DAV)
(% 50 day avg vol) |
52 Wk Hi
% From Hi |
Featured
Date |
Price
Featured |
Pivot Featured |
|
Max Buy |
EQM
-
NYSE
E Q T Midstream Partners
ENERGY - Oil and Gas Pipelines
|
$71.44
|
+0.22
0.31% |
$71.58
|
35,713
31.33% of 50 DAV
50 DAV is 114,000
|
$73.43
-2.71%
|
12/12/2013
|
$53.17
|
PP = $56.51
|
|
MB = $59.34
|
 Most Recent Note - 4/9/2014 5:23:14 PM
G - Still holding its ground and in strong shape, technically, despite fundamental concerns recently noted. Its 50 DMA line defines near-term support where a violation may trigger a technical sell signal. See the latest FSU analysis for more details and new annotated graphs.
>>> FEATURED STOCK ARTICLE : Technical Strength Continues Despite Fundamental Concerns - 4/9/2014
View all notes |
Set NEW NOTE alert |
CANSLIM.net Company Profile |
SEC
News |
Chart |
Request a new note
C
A N
S L
I M


|
GNRC
-
NYSE
Generac Hldgs Inc
Electrical-Power/Equipmt
|
$58.87
|
+0.86
1.48% |
$59.06
|
312,675
38.46% of 50 DAV
50 DAV is 813,000
|
$62.50
-5.81%
|
2/14/2014
|
$56.50
|
PP = $57.39
|
|
MB = $60.26
|
Most Recent Note - 4/8/2014 6:27:04 PM
Y - Finding support at its 50 DMA line and near prior highs in the $57 area. More damaging losses below its recent low ($56.38 on 3/27/14) would raise greater concerns.
>>> FEATURED STOCK ARTICLE : Perched Near Highs With Mostly Quiet Volume Totals - 3/31/2014
View all notes |
Set NEW NOTE alert |
CANSLIM.net Company Profile |
SEC
News |
Chart |
Request a new note
C
A N
S L
I M
|
ICON
-
NASDAQ
Iconix Brand Group Inc
CONSUMER NON-DURABLES - Textile - Apparel Footwear
|
$38.01
|
+0.22
0.57% |
$38.06
|
196,588
31.92% of 50 DAV
50 DAV is 615,900
|
$42.47
-10.49%
|
3/7/2014
|
$41.46
|
PP = $40.88
|
|
MB = $42.92
|
Most Recent Note - 4/4/2014 7:16:06 PM
G - Color code is changed to green after a loss on near average volume violated its 50 DMA line and prior low. The deterioration raised greater concerns and triggered a technical sell signal. Only a prompt rebound above the 50 DMA line would help its outlook.
>>> FEATURED STOCK ARTICLE : Falling Back Under Prior Highs Raises Concerns - 3/25/2014
View all notes |
Set NEW NOTE alert |
CANSLIM.net Company Profile |
SEC
News |
Chart |
Request a new note
C
A N
S L
I M
|
PSIX
-
NASDAQ
Power Solutions Intl Inc
Machinery-Gen Industrial
|
$73.99
|
-0.01
-0.01% |
$74.21
|
48,276
75.43% of 50 DAV
50 DAV is 64,000
|
$87.40
-15.34%
|
2/28/2014
|
$74.65
|
PP = $76.93
|
|
MB = $80.78
|
Most Recent Note - 4/8/2014 6:22:05 PM
Y - Rebounded above its 50 DMA line with today's volume-driven gain and its color code is changed to yellow. The prior session's low ($66.03) defines important near-term support where further deterioration would raise greater concerns.
>>> FEATURED STOCK ARTICLE : Found Prompt Support Near 50-Day Average After Dip Back Into Prior Base - 4/1/2014
View all notes |
Set NEW NOTE alert |
CANSLIM.net Company Profile |
SEC
News |
Chart |
Request a new note
C
A N
S L
I M
|
SILC
-
NASDAQ
Silicom Ltd
COMPUTER HARDWARE - Networking andamp; Communication Dev
|
$60.61
|
+1.18
1.99% |
$60.99
|
57,011
69.53% of 50 DAV
50 DAV is 82,000
|
$73.44
-17.47%
|
12/23/2013
|
$44.62
|
PP = $46.25
|
|
MB = $48.56
|
Most Recent Note - 4/4/2014 12:46:41 PM
G - Slumping today near a recent low ($58.12 on 3/26/14) where a violation may trigger a more worrisome technical sell signal. Halted its slide following a damaging 50 DMA line violation last week. A rebound above that important short-term average would help its outlook improve. See the latest FSU analysis for more details and a new annotated graph.
>>> FEATURED STOCK ARTICLE : Halted Slide Following 50-Day Moving Average Violation - 4/3/2014
View all notes |
Set NEW NOTE alert |
CANSLIM.net Company Profile |
SEC
News |
Chart |
Request a new note
C
A N
S L
I M
|
Symbol/Exchange
Company Name
Industry Group |
PRICE |
CHANGE
(%Change) |
Day High |
Volume
(% DAV)
(% 50 day avg vol) |
52 Wk Hi
% From Hi |
Featured
Date |
Price
Featured |
Pivot Featured |
|
Max Buy |
|
|
|
THESE ARE NOT BUY RECOMMENDATIONS!
Comments contained in the body of this report are technical
opinions only. The material herein has been obtained
from sources believed to be reliable and accurate, however,
its accuracy and completeness cannot be guaranteed.
This site is not an investment advisor, hence it does
not endorse or recommend any securities or other investments.
Any recommendation contained in this report may not
be suitable for all investors and it is not to be deemed
an offer or solicitation on our part with respect to
the purchase or sale of any securities. All trademarks,
service marks and trade names appearing in this report
are the property of their respective owners, and are
likewise used for identification purposes only.
This report is a service available
only to active Paid Premium Members.
You may opt-out of receiving report notifications
at any time. Questions or comments may be submitted
by writing to Premium Membership Services 665 S.E. 10 Street, Suite 201 Deerfield Beach, FL 33441-5634 or by calling 1-800-965-8307
or 954-785-1121.
|
|
|

