You are not logged in.
This means you
CAN ONLY VIEW reports that were published prior to Monday, April 14, 2025.
You
MUST UPGRADE YOUR MEMBERSHIP if you want to see any current reports.
AFTER MARKET UPDATE - THURSDAY, APRIL 7TH, 2011
Previous After Market Report Next After Market Report >>>
|
|
|
|
DOW |
-17.26 |
12,409.49 |
-0.14% |
|
Volume |
911,523,350 |
+3% |
|
Volume |
1,763,518,250 |
-10% |
|
NASDAQ |
-3.68 |
2,796.14 |
-0.13% |
|
Advancers |
1,101 |
35% |
|
Advancers |
938 |
35% |
|
S&P 500 |
-2.03 |
1,333.51 |
-0.15% |
|
Decliners |
1,917 |
61% |
|
Decliners |
1,669 |
61% |
|
Russell 2000 |
-4.73 |
849.44 |
-0.55% |
|
52 Wk Highs |
160 |
|
|
52 Wk Highs |
115 |
|
|
S&P 600 |
-2.67 |
449.75 |
-0.59% |
|
52 Wk Lows |
5 |
|
|
52 Wk Lows |
24 |
|
|
 |
Indices Finish Up From Earlier Lows With Small Losses
Kenneth J. Gruneisen - Passed the CAN SLIM® Master's Exam
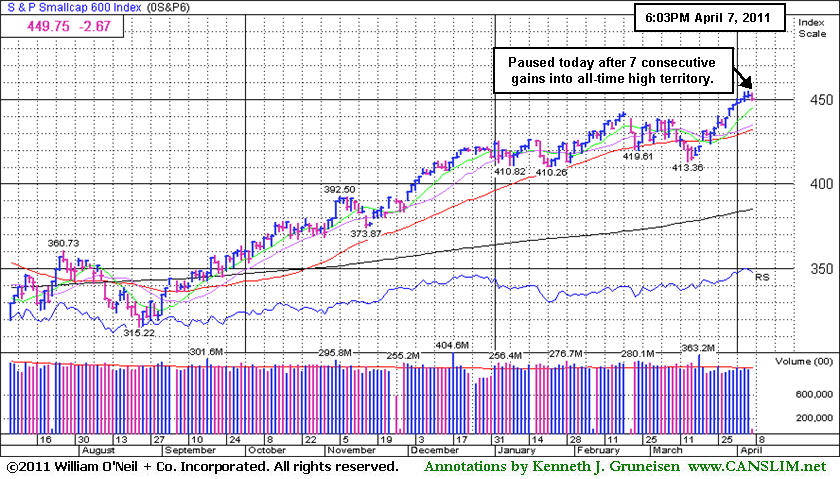
The major averages finished Thursday's session with small losses. Volume totals were mixed, slightly higher on the NYSE and slightly lower on the Nasdaq exchange versus the prior session. Declining issues beat advancers by more than 3-2 on the NYSE and by 7-4 on the Nasdaq New 52-week highs totals still significantly outnumbered new 52-week lows on the Nasdaq exchange and on the NYSE. On the NYSE the new lows total sank into the single digits again. There were 38 high-ranked companies from the CANSLIM.net Leaders List that made new 52-week highs and appeared on the CANSLIM.net BreakOuts Page, down from the total of 88 on the prior session. High-ranked leaders diverged, however, while on the Featured Stocks Page there were gains from 8 of the 21 high-ranked market leaders currently listed.
Commodity prices remained in the spotlight. Gold hit a new record for a third day and oil climbed to a 30-month high above $110 a barrel. The European Central Bank's decision to raise its benchmark interest rate by 25 basis points was widely expected. The move may be the first of several in a bid to keep inflation under control. In the US, news on jobs was good. Initial jobless claims totaled 382,000 last week, its lowest level since July 2008, and the eighth straight week that new claims have been below 400,000. Meanwhile, investor confidence was shaken by an earthquake in Japan, the threat of a U.S. government shutdown, and a further rise in the price of oil. A 7.1-magnitude earthquake in Japan rekindled concerns of supply disruptions. Stocks recovered from their worst levels of the day on word there was no new damage to Japanese nuclear reactors.
Semiconductor equipment stocks are weak, and Lam Research Corp (LRCX -4.97%) fell on concerns about slowing demand. Meanwhile, Bed Bath & Beyond (BBBY +10.5%) was a standout in the retail group after reporting better-than-expected earnings in the latest quarter. The company forecast full-year earnings ahead of expectations. Macy's Inc (M +0.83%), JC Penny Company Inc (JCP +1.62%), and Limited Brands Inc (LTD +1.62%) were additional retailers posting better-than-expected monthly sales. PNC Financial Services Group Inc. (PNC -0.4%) was down slightly as it outpaced other banks with the size of its dividend increase of 250%. Ingersoll Rand (IR +1.2%) hit a 40-month high after hiking its dividend by 71%. .
NOTICE: The CANSLIM.net Q1 2011 Webcast (click here) and April 2011 issue of CANSLIM.net News (read here) both include summaries of current market conditions, leading industry groups, and recent buy candidates while reviewing prior reports. All UPGRADED MEMBERS are currently entitled to access.
PICTURED: The S&P 600 Small-Cap Index paused after 7 consecutive gains into all-time high territory.
|
 Kenneth J. Gruneisen started out as a licensed stockbroker in August 1987, a couple of months prior to the historic stock market crash that took the Dow Jones Industrial Average down -22.6% in a single day. He has published daily fact-based fundamental and technical analysis on high-ranked stocks online for two decades. Through FACTBASEDINVESTING.COM, Kenneth provides educational articles, news, market commentary, and other information regarding proven investment systems that work in good times and bad.
Comments contained in the body of this report are technical opinions only and are not necessarily those of Gruneisen Growth Corp. The material herein has been obtained from sources believed to be reliable and accurate, however, its accuracy and completeness cannot be guaranteed. Our firm, employees, and customers may effect transactions, including transactions contrary to any recommendation herein, or have positions in the securities mentioned herein or options with respect thereto. Any recommendation contained in this report may not be suitable for all investors and it is not to be deemed an offer or solicitation on our part with respect to the purchase or sale of any securities. |
|
 |
Retail Group Finished At New Recovery High
Kenneth J. Gruneisen - Passed the CAN SLIM® Master's Exam
The Retail Index ($RLX +0.41%) had a positive bias and the Gold & Silver Index ($XAU +0.45%) also posted a gain on Thursday. Most other groups ended lower, and the financial group suffered modest losses as the Bank Index ($BKX -0.53%) and Broker/Dealer Index ($XBD -0.32%) edged lower. The tech sector also had a slightly negative bias as the Semiconductor Index ($SOX -0.51%), Biotechnology Index ($BTK -0.50%), Networking Index ($NWX -0.46%), and Internet Index ($IIX -0.34%) finished with unanimous small losses. The Healthcare Index ($HMO -0.27%) edged lower and the Oil Services Index ($OSX -0.17%) and Integrated Oil Index ($XOI -0.01%) also inched lower.
Charts courtesy www.stockcharts.com
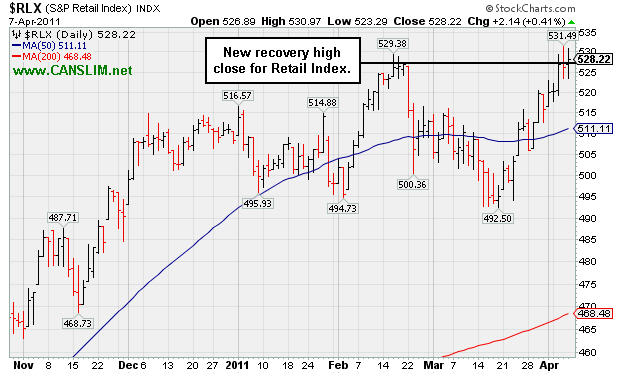
PICTURED: The Retail Index ($RLX +0.41%) rallied to a new recovery high close, helped by strength in numerous retail stores with encouraging sales reports.
| Oil Services |
$OSX |
291.50 |
-0.50 |
-0.17% |
+18.92% |
| Healthcare |
$HMO |
2,162.63 |
-5.89 |
-0.27% |
+27.82% |
| Integrated Oil |
$XOI |
1,384.84 |
-0.09 |
-0.01% |
+14.15% |
| Semiconductor |
$SOX |
443.25 |
-2.25 |
-0.51% |
+7.63% |
| Networking |
$NWX |
329.57 |
-1.51 |
-0.46% |
+17.47% |
| Internet |
$IIX |
318.07 |
-1.08 |
-0.34% |
+3.36% |
| Broker/Dealer |
$XBD |
121.47 |
-0.39 |
-0.32% |
-0.04% |
| Retail |
$RLX |
528.22 |
+2.14 |
+0.41% |
+3.90% |
| Gold & Silver |
$XAU |
226.00 |
+1.02 |
+0.45% |
-0.26% |
| Bank |
$BKX |
52.89 |
-0.28 |
-0.53% |
+1.30% |
| Biotech |
$BTK |
1,378.22 |
-6.97 |
-0.50% |
+6.21% |
|
|
|
 |
Reassuring Signs Still Bode Well After Latest Breakout
Kenneth J. Gruneisen - Passed the CAN SLIM® Master's Exam
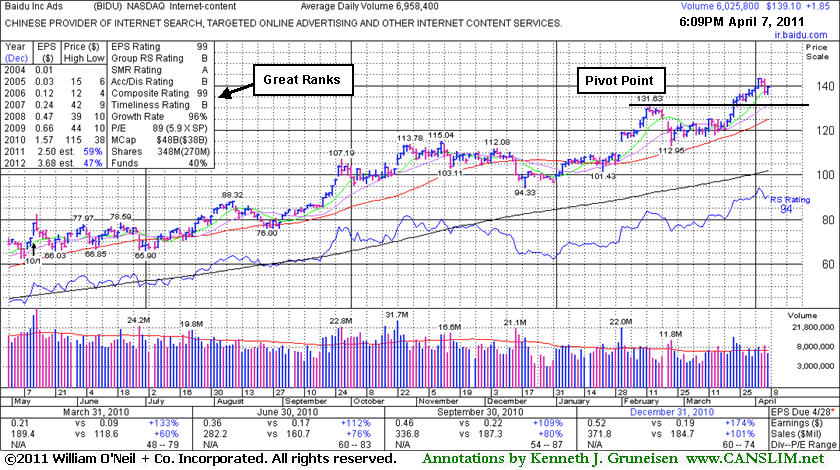
There are good reasons to remain optimistic when a company has maintained very strong quarterly and annual earnings (C and A criteria) history. Fundamentally, it is reassuring when its sales revenues and earnings increases have been impressive in the 4 most recent quarterly comparisons, solidly above the +25% guideline, and its latest quarter ended December 31, 2010 continued a streak of sequential comparisons showing impressive acceleration in its sales revenues growth. Return On Equity reported at 55% also helps, as that is well above the 17% minimum guideline. And when the number of top-rated funds owning its shares rose from 835 in Mar '10 to to 1,018 in Dec '10, investors have a reassuring sign concerning the I criteria.
Baidu Inc. (BIDU +$1.85 or +0.36% to $139.10) quietly rose back above its "max buy" level (+5% above its pivot point) with its gain today and its color code was changed to green again. There is no overhead supply to act as resistance, so it could then easily rise unhindered for more climactic gains. F ollowing its last appearance in this FSU section on 3/09/11 with an annotated graph under the headline, "Market Behavior Likely To Sway Leader's Direction", a new pivot point was cited on 3/17/11, then its gain with 2 times average volume on 3/23/11 triggered a technical buy signal after its latest set-up. After it was shown in the February 2011 issue of CANSLIM.net News under the headline, "Breakaway Gap After Impressive Acceleration In Latest Quarter", this high-ranked China-based firm in the Internet - Content industry endured distributional pressure, yet it found support above its earlier chart highs and stayed well above its 50-day moving average (DMA) line.
 |
|
|
Color Codes Explained :
Y - Better candidates highlighted by our
staff of experts.
G - Previously featured
in past reports as yellow but may no longer be buyable under the
guidelines.
***Last / Change / Volume data in this table is the closing quote data***
Symbol/Exchange
Company Name
Industry Group |
PRICE |
CHANGE
(%Change) |
Day High |
Volume
(% DAV)
(% 50 day avg vol) |
52 Wk Hi
% From Hi |
Featured
Date |
Price
Featured |
Pivot Featured |
|
Max Buy |
AIXG
-
NASDAQ
Aixtron Se
ELECTRONICS - Semiconductor Equipment andamp; Mate
|
$43.03
|
-0.95
-2.16% |
$43.36
|
150,166
60.16% of 50 DAV
50 DAV is 249,600
|
$44.96
-4.29%
|
4/5/2011
|
$44.14
|
PP = $44.64
|
|
MB = $46.87
|
 Most Recent Note - 4/7/2011 2:07:48 PM
Y - Small gap down today, pulling back -4.6% off its 52-week high now. Still working on the right side of its base above prior resistance in the $38 area. Color code was changed to yellow when featured in the 4/05/11 mid-day report with pivot point cited based on its 3/03/11 high after an 8-week double bottom base pattern. Volume driven gains above its pivot point may trigger a technical buy signal, but disciplined investors will watch for proof of institutional buying demand and avoid the urge to get in "early". See the latest FSU analysis for details and an annotated graph.
>>> The latest Featured Stock Update with an annotated graph appeared on 4/5/2011. Click here.
View all notes |
Alert me of new notes |
CANSLIM.net Company Profile |
SEC |
Zacks Reports |
StockTalk |
News |
Chart |
Request a new note
C
A N
S L
I M


|
BIDU
-
NASDAQ
Baidu Inc Ads
INTERNET - Internet Information Providers
|
$139.10
|
+1.85
1.35% |
$139.21
|
6,093,771
87.57% of 50 DAV
50 DAV is 6,958,400
|
$143.48
-3.05%
|
3/17/2011
|
$121.97
|
PP = $131.73
|
|
MB = $138.32
|
Most Recent Note - 4/7/2011 7:01:35 PM
G - Color code was changed to green again after quietly rising above its "max buy" level. Prior high near $131 defines initial chart support to watch. See the latest FSU analysis for details and a new annotated graph.
>>> The latest Featured Stock Update with an annotated graph appeared on 4/7/2011. Click here.
View all notes |
Alert me of new notes |
CANSLIM.net Company Profile |
SEC |
Zacks Reports |
StockTalk |
News |
Chart |
Request a new note
C
A N
S L
I M
|
CMG
-
NYSE
Chipotle Mexican Grill
LEISURE - Restaurants
|
$274.70
|
-1.06
-0.38% |
$277.88
|
565,970
51.01% of 50 DAV
50 DAV is 1,109,500
|
$282.00
-2.59%
|
4/1/2011
|
$274.00
|
PP = $275.10
|
|
MB = $288.86
|
Most Recent Note - 4/5/2011 2:02:36 PM
Y - Rising quietly to a new all-time high today without great volume conviction behind its gain above the new pivot point cited based on its prior high plus 10 cents after an orderly 7-week base pattern. Disciplined investors know to watch for confirming gains with well above average volume to trigger a new (or add-on) technical buy signal.
>>> The latest Featured Stock Update with an annotated graph appeared on 3/14/2011. Click here.
View all notes |
Alert me of new notes |
CANSLIM.net Company Profile |
SEC |
Zacks Reports |
StockTalk |
News |
Chart |
Request a new note
C
A N
S L
I M
|
CTCT
-
NASDAQ
Constant Contact Inc
MEDIA - Advertising Services
|
$35.04
|
-0.56
-1.57% |
$35.96
|
469,736
110.97% of 50 DAV
50 DAV is 423,300
|
$36.33
-3.55%
|
3/22/2011
|
$33.59
|
PP = $32.49
|
|
MB = $34.11
|
Most Recent Note - 4/5/2011 7:01:17 PM
G - Churned above average volume today and closed in the red, enduring distributional pressure. Prior highs in the $32 area define support to watch above its 50 DMA line.
>>> The latest Featured Stock Update with an annotated graph appeared on 3/22/2011. Click here.
View all notes |
Alert me of new notes |
CANSLIM.net Company Profile |
SEC |
Zacks Reports |
StockTalk |
News |
Chart |
Request a new note
C
A N
S L
I M
|
CTSH
-
NASDAQ
Cognizant Tech Sol Cl A
COMPUTER SOFTWARE and SERVICES - Business Software and Services
|
$80.81
|
-0.58
-0.71% |
$81.81
|
1,435,988
62.02% of 50 DAV
50 DAV is 2,315,300
|
$82.86
-2.47%
|
2/7/2011
|
$75.09
|
PP = $76.46
|
|
MB = $80.28
|
Most Recent Note - 4/5/2011 2:06:01 PM
G - Hovering at its 52-week high in a tight range since noted last week while wedging higher with gains on light volume. No resistance remains due to overhead supply. Prior highs in the $77-78 area define chart support to watch above its 50 DMA line.
>>> The latest Featured Stock Update with an annotated graph appeared on 3/17/2011. Click here.
View all notes |
Alert me of new notes |
CANSLIM.net Company Profile |
SEC |
Zacks Reports |
StockTalk |
News |
Chart |
Request a new note
C
A N
S L
I M
|
Symbol/Exchange
Company Name
Industry Group |
PRICE |
CHANGE
(%Change) |
Day High |
Volume
(% DAV)
(% 50 day avg vol) |
52 Wk Hi
% From Hi |
Featured
Date |
Price
Featured |
Pivot Featured |
|
Max Buy |
DECK
-
NASDAQ
Deckers Outdoor Corp
CONSUMER NON-DURABLES - Textile - Apparel Footwear
|
$90.22
|
+0.37
0.41% |
$91.48
|
897,374
67.10% of 50 DAV
50 DAV is 1,337,300
|
$94.70
-4.73%
|
2/3/2011
|
$79.61
|
PP = $82.67
|
|
MB = $86.80
|
Most Recent Note - 4/6/2011 6:49:47 PM
G - Its choppy consolidation in recent weeks is not recognized as a sound base pattern. Its 50 DMA line defines initial chart support to watch. See the latest FSU analysis for more details and a new annotated graph.
>>> The latest Featured Stock Update with an annotated graph appeared on 4/6/2011. Click here.
View all notes |
Alert me of new notes |
CANSLIM.net Company Profile |
SEC |
Zacks Reports |
StockTalk |
News |
Chart |
Request a new note
C
A N
S L
I M
|
EZPW
-
NASDAQ
Ezcorp Inc Cl A
SPECIALTY RETAIL - Specialty Retail, Other
|
$32.01
|
-0.02
-0.06% |
$32.50
|
253,712
77.02% of 50 DAV
50 DAV is 329,400
|
$33.08
-3.23%
|
2/18/2011
|
$27.94
|
PP = $30.04
|
|
MB = $31.54
|
Most Recent Note - 4/5/2011 1:47:33 PM
G - Up again today, hitting new all-time highs and getting extended from its latest base. Prior highs in the $29-30 area define support to watch on pullbacks.
>>> The latest Featured Stock Update with an annotated graph appeared on 3/10/2011. Click here.
View all notes |
Alert me of new notes |
CANSLIM.net Company Profile |
SEC |
Zacks Reports |
StockTalk |
News |
Chart |
Request a new note
C
A N
S L
I M
|
FOSL
-
NASDAQ
Fossil Inc
CONSUMER DURABLES - Recreational Goods, Other
|
$94.02
|
+2.42
2.64% |
$94.02
|
890,663
91.85% of 50 DAV
50 DAV is 969,700
|
$94.77
-0.79%
|
2/1/2011
|
$73.30
|
PP = $74.44
|
|
MB = $78.16
|
Most Recent Note - 4/7/2011 3:24:39 PM
G - Hovering at its all-time high today, it has rallied as much as +108% higher in 8 months since first featured in yellow in the 8/10/10 mid-day report (read here). It could produce more climactic gains, but recently it has been noted - "Extended from any sound base. Prior highs in the $83-85 area define chart support to watch above its 50 DMA line."
>>> The latest Featured Stock Update with an annotated graph appeared on 3/30/2011. Click here.
View all notes |
Alert me of new notes |
CANSLIM.net Company Profile |
SEC |
Zacks Reports |
StockTalk |
News |
Chart |
Request a new note
C
A N
S L
I M
|
HMSY
-
NASDAQ
H M S Holdings Corp
COMPUTER SOFTWARE and SERVICES - Healthcare Information Service
|
$82.16
|
-1.15
-1.38% |
$83.55
|
74,573
45.61% of 50 DAV
50 DAV is 163,500
|
$84.82
-3.14%
|
11/19/2010
|
$61.89
|
PP = $63.01
|
|
MB = $66.16
|
Most Recent Note - 4/7/2011 3:26:44 PM
G - Quietly perched at an all-time high, extended from any sound base pattern. Its 50 DMA line ($76.55 now) defines support to watch on pullbacks.
>>> The latest Featured Stock Update with an annotated graph appeared on 3/25/2011. Click here.
View all notes |
Alert me of new notes |
CANSLIM.net Company Profile |
SEC |
Zacks Reports |
StockTalk |
News |
Chart |
Request a new note
C
A N
S L
I M
|
HS
-
NYSE
Healthspring Inc
HEALTH SERVICES - Health Care Plans
|
$38.94
|
+0.15
0.39% |
$39.63
|
602,704
72.15% of 50 DAV
50 DAV is 835,400
|
$40.78
-4.51%
|
3/22/2011
|
$38.29
|
PP = $38.85
|
|
MB = $40.79
|
Most Recent Note - 4/7/2011 3:29:47 PM
Y - Hovering near its pivot point today after rallying to a new all-time high this week following a technical buy signal noted on 4/01/11. Prior highs define support above its 50 DMA line and recent lows in the $35.50 area. The Public Offering completed on 3/25/11 may hinder its upward progress for the near-term, however it has been attracting top-rated funds as owners (I criteria).
>>> The latest Featured Stock Update with an annotated graph appeared on 3/23/2011. Click here.
View all notes |
Alert me of new notes |
CANSLIM.net Company Profile |
SEC |
Zacks Reports |
StockTalk |
News |
Chart |
Request a new note
C
A N
S L
I M
|
Symbol/Exchange
Company Name
Industry Group |
PRICE |
CHANGE
(%Change) |
Day High |
Volume
(% DAV)
(% 50 day avg vol) |
52 Wk Hi
% From Hi |
Featured
Date |
Price
Featured |
Pivot Featured |
|
Max Buy |
INFA
-
NASDAQ
Informatica Corp
COMPUTER SOFTWARE and SERVICES - Business Software and Services
|
$51.26
|
-0.10
-0.19% |
$51.80
|
433,378
47.17% of 50 DAV
50 DAV is 918,700
|
$52.96
-3.21%
|
3/24/2011
|
$50.04
|
PP = $49.86
|
|
MB = $52.35
|
Most Recent Note - 4/7/2011 3:36:49 PM
Y - Volume totals have been cooling while holding its ground, consolidating within 5% of its pivot point. Triggered a technical buy signal on 3/24/11 with near minimum volume. Prior highs in the $49 area define initial support to watch above its 50 DMA line, where violations would raise concerns and may trigger technical sell signals.
>>> The latest Featured Stock Update with an annotated graph appeared on 3/28/2011. Click here.
View all notes |
Alert me of new notes |
CANSLIM.net Company Profile |
SEC |
Zacks Reports |
StockTalk |
News |
Chart |
Request a new note
C
A N
S L
I M
|
LULU
-
NASDAQ
Lululemon Athletica
MANUFACTURING - Textile Manufacturing
|
$91.51
|
-0.57
-0.62% |
$92.11
|
2,799,618
121.75% of 50 DAV
50 DAV is 2,299,400
|
$94.98
-3.65%
|
3/28/2011
|
$68.11
|
PP = $85.38
|
|
MB = $89.65
|
Most Recent Note - 4/5/2011 12:50:20 PM
G - Up again today with higher volume for a new all-time high, getting more extended from its latest sound base pattern. Prior highs in the $85 area define initial chart support to watch.
>>> The latest Featured Stock Update with an annotated graph appeared on 3/31/2011. Click here.
View all notes |
Alert me of new notes |
CANSLIM.net Company Profile |
SEC |
Zacks Reports |
StockTalk |
News |
Chart |
Request a new note
C
A N
S L
I M
|
MG
-
NYSE
Mistras Group Inc
DIVERSIFIED SERVICES - Bulding and Faci;ity Management Services
|
$16.65
|
-0.13
-0.77% |
$16.83
|
73,989
66.42% of 50 DAV
50 DAV is 111,400
|
$17.33
-3.92%
|
3/15/2011
|
$15.48
|
PP = $15.90
|
|
MB = $16.70
|
Most Recent Note - 4/7/2011 6:36:46 PM
Y - Its color code is changed to yellow after quietly dipping just under its "max buy" level. Prior highs and its 50 DMA line define important support to watch on pullbacks.
>>> The latest Featured Stock Update with an annotated graph appeared on 3/15/2011. Click here.
View all notes |
Alert me of new notes |
CANSLIM.net Company Profile |
SEC |
Zacks Reports |
StockTalk |
News |
Chart |
Request a new note
C
A N
S L
I M
|
MWIV
-
NASDAQ
M W I Veterinary Supply
HEALTH SERVICES - Medical Instruments and; Supplies
|
$78.46
|
-0.77
-0.97% |
$79.73
|
77,200
80.42% of 50 DAV
50 DAV is 96,000
|
$80.86
-2.97%
|
11/4/2010
|
$61.79
|
PP = $59.60
|
|
MB = $62.58
|
Most Recent Note - 4/7/2011 6:38:01 PM
G - Perched near all-time highs, still quietly consolidating. Its 50 DMA line defines important support to watch. It has been repeatedly noted - "Extended from any sound base pattern."
>>> The latest Featured Stock Update with an annotated graph appeared on 3/8/2011. Click here.
View all notes |
Alert me of new notes |
CANSLIM.net Company Profile |
SEC |
Zacks Reports |
StockTalk |
News |
Chart |
Request a new note
C
A N
S L
I M
|
OPEN
-
NASDAQ
Opentable Inc
INTERNET - Internet Software and Services
|
$108.58
|
+2.87
2.71% |
$108.74
|
1,386,275
110.96% of 50 DAV
50 DAV is 1,249,400
|
$112.78
-3.72%
|
3/17/2011
|
$90.71
|
PP = $96.07
|
|
MB = $100.87
|
Most Recent Note - 4/7/2011 6:16:41 PM
G - Up today, closing only -3.7% off its all-time high hit in the prior session before a negative reversal. It is extended from its latest base, and prior highs near $96 define initial support to watch on pullbacks.
>>> The latest Featured Stock Update with an annotated graph appeared on 3/24/2011. Click here.
View all notes |
Alert me of new notes |
CANSLIM.net Company Profile |
SEC |
Zacks Reports |
StockTalk |
News |
Chart |
Request a new note
C
A N
S L
I M
|
Symbol/Exchange
Company Name
Industry Group |
PRICE |
CHANGE
(%Change) |
Day High |
Volume
(% DAV)
(% 50 day avg vol) |
52 Wk Hi
% From Hi |
Featured
Date |
Price
Featured |
Pivot Featured |
|
Max Buy |
PAY
-
NYSE
Verifone Systems Inc
COMPUTER HARDWARE - Transaction Automation Systems
|
$53.35
|
-0.42
-0.78% |
$53.65
|
4,263,986
201.12% of 50 DAV
50 DAV is 2,120,100
|
$58.88
-9.39%
|
1/27/2011
|
$41.77
|
PP = $44.97
|
|
MB = $47.22
|
Most Recent Note - 4/7/2011 6:19:02 PM
G - Closed near the session high with a small loss after enduring more distributional pressure. Its 50 DMA line ($48.63 now) defines important chart support to watch.
>>> The latest Featured Stock Update with an annotated graph appeared on 4/4/2011. Click here.
View all notes |
Alert me of new notes |
CANSLIM.net Company Profile |
SEC |
Zacks Reports |
StockTalk |
News |
Chart |
Request a new note
C
A N
S L
I M
|
PCLN
-
NASDAQ
Priceline.Com Inc
INTERNET - Internet Software and Services
|
$508.86
|
+2.59
0.51% |
$511.85
|
956,420
79.88% of 50 DAV
50 DAV is 1,197,300
|
$522.00
-2.52%
|
1/3/2011
|
$399.55
|
PP = $428.20
|
|
MB = $449.61
|
Most Recent Note - 4/7/2011 3:39:46 PM
G - Hovering near its 52-week high, extended from any sound base pattern. Its 50 DMA line has defined support throughout its advance.
>>> The latest Featured Stock Update with an annotated graph appeared on 3/21/2011. Click here.
View all notes |
Alert me of new notes |
CANSLIM.net Company Profile |
SEC |
Zacks Reports |
StockTalk |
News |
Chart |
Request a new note
C
A N
S L
I M
|
RAX
-
NYSE
Rackspace Hosting Inc
INTERNET - Internet Software and; Services
|
$42.82
|
+0.75
1.78% |
$43.12
|
2,706,841
150.51% of 50 DAV
50 DAV is 1,798,500
|
$44.19
-3.10%
|
3/16/2011
|
$36.28
|
PP = $40.72
|
|
MB = $42.76
|
Most Recent Note - 4/7/2011 3:41:05 PM
G - Color code is changed to green after rising back above its "max buy" level. Approximately 40% of successful breakouts pullback and test support at prior resistance before continuing higher. As previously noted, "Prior high near $40 defines chart support to watch on pullbacks."
>>> The latest Featured Stock Update with an annotated graph appeared on 3/16/2011. Click here.
View all notes |
Alert me of new notes |
CANSLIM.net Company Profile |
SEC |
Zacks Reports |
StockTalk |
News |
Chart |
Request a new note
C
A N
S L
I M
|
TIBX
-
NASDAQ
Tibco Software Inc
COMPUTER SOFTWARE and SERVICES - Business Software and Services
|
$26.96
|
-0.59
-2.14% |
$27.79
|
2,601,092
106.55% of 50 DAV
50 DAV is 2,441,200
|
$28.31
-4.75%
|
3/18/2011
|
$23.88
|
PP = $26.04
|
|
MB = $27.34
|
Most Recent Note - 4/7/2011 3:43:54 PM
Y - Color code is changed to yellow after pulling back just under its "max buy" level. Volume totals have been cooling while it has been consolidating in a tight range, stubbornly holding its ground after a spurt of volume-driven gains. Prior highs in the $25-26 area define support to watch on pullbacks.
>>> The latest Featured Stock Update with an annotated graph appeared on 3/18/2011. Click here.
View all notes |
Alert me of new notes |
CANSLIM.net Company Profile |
SEC |
Zacks Reports |
StockTalk |
News |
Chart |
Request a new note
C
A N
S L
I M
|
UA
-
NYSE
Under Armour Inc Cl A
CONSUMER NON-DURABLES - Textile - Apparel Clothing
|
$73.10
|
-0.80
-1.08% |
$74.88
|
667,534
78.40% of 50 DAV
50 DAV is 851,500
|
$76.85
-4.88%
|
3/31/2011
|
$68.04
|
PP = $70.79
|
|
MB = $74.33
|
Most Recent Note - 4/6/2011 1:55:52 PM
Y - Color code is changed to yellow while consolidating back within 5% of its pivot point today following 3 consecutive volume-driven gains into new all-time high territory. Prior highs in the $70 area define support to watch.
>>> The latest Featured Stock Update with an annotated graph appeared on 4/1/2011. Click here.
View all notes |
Alert me of new notes |
CANSLIM.net Company Profile |
SEC |
Zacks Reports |
StockTalk |
News |
Chart |
Request a new note
C
A N
S L
I M
|
Symbol/Exchange
Company Name
Industry Group |
PRICE |
CHANGE
(%Change) |
Day High |
Volume
(% DAV)
(% 50 day avg vol) |
52 Wk Hi
% From Hi |
Featured
Date |
Price
Featured |
Pivot Featured |
|
Max Buy |
ULTA
-
NASDAQ
Ulta Salon Cosm & Frag
SPECIALTY RETAIL - Specialty Retail, Other
|
$51.10
|
+1.25
2.51% |
$51.46
|
996,741
162.02% of 50 DAV
50 DAV is 615,200
|
$50.15
1.89%
|
1/6/2011
|
$36.12
|
PP = $37.34
|
|
MB = $39.21
|
Most Recent Note - 4/7/2011 6:34:48 PM
G - Up today with above average volume for another new all-time high, getting more extended from any sound base. Prior highs and its 50 DMA line define chart support to watch near the $44 level on pullbacks.
>>> The latest Featured Stock Update with an annotated graph appeared on 3/29/2011. Click here.
View all notes |
Alert me of new notes |
CANSLIM.net Company Profile |
SEC |
Zacks Reports |
StockTalk |
News |
Chart |
Request a new note
C
A N
S L
I M
|
|
|
|
THESE ARE NOT BUY RECOMMENDATIONS!
Comments contained in the body of this report are technical
opinions only. The material herein has been obtained
from sources believed to be reliable and accurate, however,
its accuracy and completeness cannot be guaranteed.
This site is not an investment advisor, hence it does
not endorse or recommend any securities or other investments.
Any recommendation contained in this report may not
be suitable for all investors and it is not to be deemed
an offer or solicitation on our part with respect to
the purchase or sale of any securities. All trademarks,
service marks and trade names appearing in this report
are the property of their respective owners, and are
likewise used for identification purposes only.
This report is a service available
only to active Paid Premium Members.
You may opt-out of receiving report notifications
at any time. Questions or comments may be submitted
by writing to Premium Membership Services 665 S.E. 10 Street, Suite 201 Deerfield Beach, FL 33441-5634 or by calling 1-800-965-8307
or 954-785-1121.
|
|
|

