You are not logged in.
This means you
CAN ONLY VIEW reports that were published prior to Tuesday, July 9, 2024.
You
MUST UPGRADE YOUR MEMBERSHIP if you want to see any current reports.
AFTER MARKET UPDATE - THURSDAY, APRIL 4TH, 2024
Previous After Market Report Next After Market Report >>>
|
|
|
|
DOW |
-530.16 |
38,596.98 |
-1.35% |
|
Volume |
954,604,018 |
+2% |
|
Volume |
5,487,208,700 |
+4% |
|
NASDAQ |
-228.38 |
16,049.08 |
-1.40% |
|
Advancers |
953 |
35% |
|
Advancers |
1,656 |
39% |
|
S&P 500 |
-64.28 |
5,147.21 |
-1.23% |
|
Decliners |
1,791 |
65% |
|
Decliners |
2,601 |
61% |
|
Russell 2000 |
-22.38 |
2,053.83 |
-1.08% |
|
52 Wk Highs |
209 |
|
|
52 Wk Highs |
171 |
|
|
S&P 600 |
-11.46 |
1,303.19 |
-0.87% |
|
52 Wk Lows |
17 |
|
|
52 Wk Lows |
103 |
|
|
Based on distributional action the market uptrend (M criteria) is now considered to be under pressure. Use greater caution!!!
|
 |
Uptrend Under Pressure Raises Concerns as Major Indices Slump
Kenneth J. Gruneisen - Passed the CAN SLIM® Master's Exam
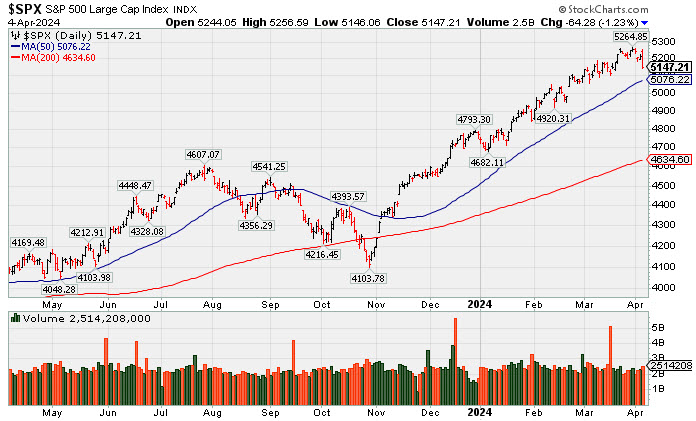
Stocks started Thursday in rally-mode, but finished the day with sharp losses. The Nasdaq Composite lost 1.4% and the Dow Jones Industrial Average fell more than 500 points. Volume reported was higher than the prior session total on the NYSE and on the Nasdaq exchange, indictive of distributional pressure. Breadth was negative as decliners led advancers by almost a 2-1 margin on the NYSE and by a 5-3 margin on the Nasdaq exchange. There were 85 high-ranked companies from the Leaders List that hit new 52-week highs and were listed on the BreakOuts Page, versus the total of 57 on the prior session. New 52-week highs outnumbered new 52-week lows on the NYSE, and on the Nasdaq exchange. The uptrend for the major indices has be coming under pressure (M criteria). Greater caution is important for all investors who should always stand ready to protect against losses.
PICTURED: The S&P 500 Index pulled back withn higher volume, encountering pressure, yet it remains well above its 50-day moving average line.
All 11 S&P 500 sectors closed with declines. Six of them fell more than 1.0%. Comments from Minneapolis Fed President Kashkari (not an FOMC voter) indicated that it is possible the Fed might not cut rates this year if progress on inflation stalls, as the reason for the afternoon deterioration. Others indicated increased geopolitical tensions in the Middle East related to potential retaliation by Iran against Israel as the key factor driving the afternoon sell-off.
The latter concern also drove afternoon gains in oil prices and defense-related stocks. WTI crude oil futures climbed 1.3% to $86.57/bbl. Lockheed Martin (LMT +1.4%) and RTX (RTX +1.8%) were winning standouts from the defense space.
The 10-yr note yield fell five basis points to 4.31% and the 2-yr note yield declined four basis points to 4.64%.
|
 Kenneth J. Gruneisen started out as a licensed stockbroker in August 1987, a couple of months prior to the historic stock market crash that took the Dow Jones Industrial Average down -22.6% in a single day. He has published daily fact-based fundamental and technical analysis on high-ranked stocks online for two decades. Through FACTBASEDINVESTING.COM, Kenneth provides educational articles, news, market commentary, and other information regarding proven investment systems that work in good times and bad.
Comments contained in the body of this report are technical opinions only and are not necessarily those of Gruneisen Growth Corp. The material herein has been obtained from sources believed to be reliable and accurate, however, its accuracy and completeness cannot be guaranteed. Our firm, employees, and customers may effect transactions, including transactions contrary to any recommendation herein, or have positions in the securities mentioned herein or options with respect thereto. Any recommendation contained in this report may not be suitable for all investors and it is not to be deemed an offer or solicitation on our part with respect to the purchase or sale of any securities. |
|
 |
Widespread Retreat Hits All Groups
Kenneth J. Gruneisen - Passed the CAN SLIM® Master's Exam
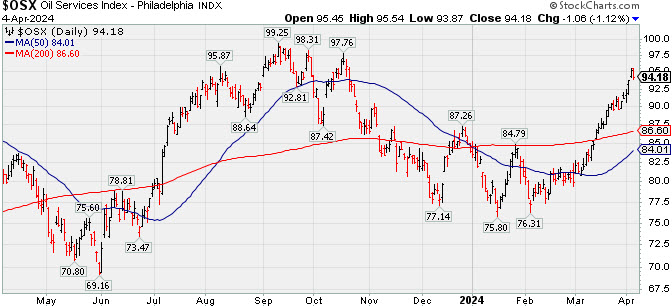
The Broker/Dealer Index ($XBD -1.36%), Bank Index ($BKX -1.12%) and the Retail Index ($RLX -1.24%) each fell. The tech sector had a negative bias as the Semiconductor Index ($SOX -3, 01%) outpaced the Networking Index ($NWX -1.31%) and the Biotech Index ($BTK -1.29%) to the downside. The Gold & Silver Index ($XAU -1.26%) and the Oil Services Index ($OSX -1.12%) both fell while Integrated Oil Index ($XOI -0.05%) finished flat.
![]() PICTURED: The Oil Services Index ($OSX -1.12%) has been rebounding toward its prior high.
| Oil Services |
$OSX |
94.18 |
-1.06 |
-1.12% |
+12.28% |
| Integrated Oil |
$XOI |
2,235.18 |
-1.01 |
-0.05% |
+20.01% |
| Semiconductor |
$SOX |
4,756.07 |
-147.43 |
-3.01% |
+13.90% |
| Networking |
$NWX |
781.58 |
-10.41 |
-1.31% |
-6.15% |
| Broker/Dealer |
$XBD |
600.31 |
-8.25 |
-1.36% |
+7.72% |
| Retail |
$RLX |
4,407.20 |
-55.38 |
-1.24% |
+13.33% |
| Gold & Silver |
$XAU |
132.64 |
-1.69 |
-1.26% |
+5.53% |
| Bank |
$BKX |
101.44 |
-1.15 |
-1.12% |
+5.64% |
| Biotech |
$BTK |
5,152.47 |
-67.31 |
-1.29% |
-4.91% |
|
|
|
 |
Encountered Distributional Pressure and Finished Below Pivot Point
Kenneth J. Gruneisen - Passed the CAN SLIM® Master's Exam
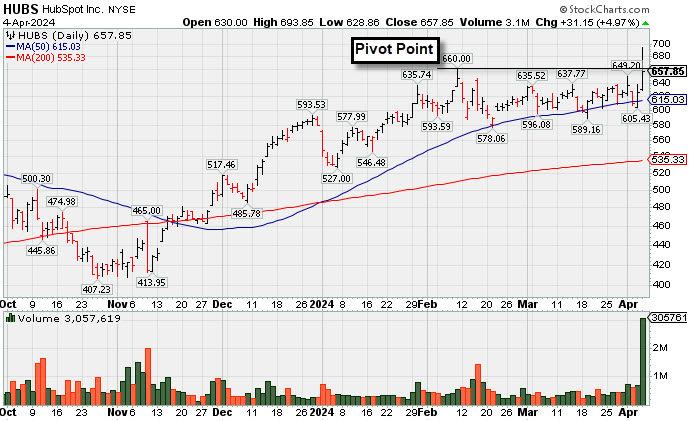
Hubspot Inc (HUBS +$31.15 or +4.97% to $657.85) finished in the middle of its intra-day range after highlighted in yellow with pivot point cited based on its 2/09/24 high plus 10 cents in the earlier mid-day report. It hit a new 52-week high with today's volume-driven gain triggering a technical buy signal, however the stock did not finish the session above the pivot point. It also failed to close in the upper third of its intra-day range, a sign of it encountering distributional pressure as it was also impacted by widespread market weakness. Confirming volume-driven gains would be a reassuring sign of lurking institutionaI buyers. It found prompt support at its 50-day moving average (DMA) line ($615.57) in recent weeks which defines important near-term support above the recent low ($589.16 on 3/19/24).
HUBS has a highest possible Earnings Per Share Rating of 99. Dec '23 quarterly earnings +59% on +24% sales revenues versus the year-ago period marked its 6th consecutive quarterly comparison well above the +25% minimum guideline (C criteria). Its annual earnings history (A criteria) has been strong. It faces some resistance due to old overhead supply up to the $866 level.
The number of top-rated funds owning its shares rose from 1,530 in Jun '23 to 1,783 in Dec '23, a reassuring sign concerning the I criteria. Its current Up/Down Volume Ratio of 1.5 is an unbiased indication its shares have been under accumulation over the past 50 days.
|
|
|
Color Codes Explained :
Y - Better candidates highlighted by our
staff of experts.
G - Previously featured
in past reports as yellow but may no longer be buyable under the
guidelines.
***Last / Change / Volume data in this table is the closing quote data***
Symbol/Exchange
Company Name
Industry Group |
PRICE |
CHANGE
(%Change) |
Day High |
Volume
(% DAV)
(% 50 day avg vol) |
52 Wk Hi
% From Hi |
Featured
Date |
Price
Featured |
Pivot Featured |
|
Max Buy |
 ANET
-
NYSE
ANET
-
NYSE
Arista Networks
Computer-Networking
|
$288.77
|
-10.02
-3.35% |
$303.50
|
1,877,532
68.85% of 50 DAV
50 DAV is 2,727,000
|
$307.74
-6.16%
|
3/18/2024
|
$188.84
|
PP = $292.76
|
|
MB = $307.40
|
 Most Recent Note - 4/4/2024 3:52:46 PM
Y - Reversed into the red today, pulling back after rebounding near its all-time high with gains lacking great volume conviction. Found support near prior highs in the $292 area and additional near-term support to watch is its 50 DMA line ($278) and an upward trendline connecting its October-March lows.
>>> FEATURED STOCK ARTICLE : Consolidating Abover Recent Highs and Above 50-Day Average - 3/26/2024 |
View all notes |
Set NEW NOTE alert |
Company Profile |
SEC
News |
Chart |
Request a new note
C
A
S
I |
NVO
-
NYSE
Novo Nordisk ADR
Medical-Ethical Drugs
|
$123.96
|
-3.03
-2.39% |
$127.48
|
4,006,827
72.89% of 50 DAV
50 DAV is 5,497,000
|
$138.28
-10.36%
|
3/1/2024
|
$124.23
|
PP = $124.97
|
|
MB = $131.22
|
Most Recent Note - 4/4/2024 3:57:27 PM
Y - Quietly pulling back below the pivot point of the previously noted "3-weeks tight" base and testing its 50 DMA line ($123.46) which defines important near-term support. See the latest FSU analysis for more details and an annotated graph.
>>> FEATURED STOCK ARTICLE : Volume Cools While Consolidating Above 50-Day Moving Average Line - 4/3/2024 |
View all notes |
Set NEW NOTE alert |
Company Profile |
SEC
News |
Chart |
Request a new note
C
A
S
I |
AXON
-
NASDAQ
Axon Enterprise
Security/Sfty
|
$307.01
|
-2.09
-0.68% |
$315.61
|
272,689
54.98% of 50 DAV
50 DAV is 496,000
|
$325.63
-5.72%
|
11/8/2023
|
$220.13
|
PP = $223.30
|
|
MB = $234.47
|
Most Recent Note - 4/1/2024 9:16:28 PM
G - Pulled back for a 3rd consecutive small loss, still hovering in a tight range near its all-time high. Its 50-day moving average (DMA) line ($285.44) defines near-term support to watch. Fundamentals remain strong.
>>> FEATURED STOCK ARTICLE : Hovering Near All-Time High; Spiked Higher Following Earnings - 3/14/2024 |
View all notes |
Set NEW NOTE alert |
Company Profile |
SEC
News |
Chart |
Request a new note
C
A
S
I |
TDG
-
NYSE
TransDigm Group
Aerospace/Defense
|
$1,204.36
|
-24.15
-1.97% |
$1,246.22
|
188,064
86.67% of 50 DAV
50 DAV is 217,000
|
$1,238.95
-2.79%
|
12/12/2023
|
$1,000.39
|
PP = $1,013.18
|
|
MB = $1,063.84
|
Most Recent Note - 4/4/2024 4:00:13 PM
G - There was a "negative reversal" today after touching a new all-time high. Volume totals have still been cooling while stubbornly holding its ground. Its 50 DMA line ($1,164) defines near-term support to watch.
>>> FEATURED STOCK ARTICLE : Perched in Tight Range Encountering Distribtion Near All-Time High - 3/15/2024 |
View all notes |
Set NEW NOTE alert |
Company Profile |
SEC
News |
Chart |
Request a new note
C
A
S
I |
CRWD
-
NASDAQ
CrowdStrike Holdings
Computer Sftwr-Security
|
$309.11
|
-10.93
-3.42% |
$325.99
|
2,667,043
66.63% of 50 DAV
50 DAV is 4,003,000
|
$365.00
-15.31%
|
1/2/2024
|
$246.42
|
PP = $261.91
|
|
MB = $275.01
|
Most Recent Note - 4/4/2024 3:54:49 PM
G - Slumping below its 50 DMA ($317) today with light volume amid widespread market weakness. Only a prompt rebound above the 50 DMA line would help its outlook improve. It has not formed a sound base of sufficient length. Fundamentals remain strong after it reported Jan '24 quarterly earnings +102% on +33% sales revenues versus the year-ago period.
>>> FEATURED STOCK ARTICLE : 50-Day Moving Average Line Support Being Tested - 4/1/2024 |
View all notes |
Set NEW NOTE alert |
Company Profile |
SEC
News |
Chart |
Request a new note
C
A
S
I |
Symbol/Exchange
Company Name
Industry Group |
PRICE |
CHANGE
(%Change) |
Day High |
Volume
(% DAV)
(% 50 day avg vol) |
52 Wk Hi
% From Hi |
Featured
Date |
Price
Featured |
Pivot Featured |
|
Max Buy |
PCAR
-
NASDAQ
Paccar
Trucks and Parts-Hvy Duty
|
$120.53
|
+0.11
0.09% |
$122.38
|
1,896,131
82.44% of 50 DAV
50 DAV is 2,300,000
|
$125.50
-3.96%
|
1/23/2024
|
$100.35
|
PP = $98.57
|
|
MB = $103.50
|
Most Recent Note - 4/3/2024 12:36:20 PM
G - Pulling back from its all-time high with today's 7th loss in the span of 8 sessions after getting very extended from any sound base. Its 50 DMA line ($111.80) defines near-term support to watch. Fundamentals remain strong.
>>> FEATURED STOCK ARTICLE : Hit New High With 5th Consecutive Gain - 3/21/2024 |
View all notes |
Set NEW NOTE alert |
Company Profile |
SEC
News |
Chart |
Request a new note
C
A
S
I |
HUBB
-
NYSE
Hubbell
Electrical-Power/Equipmt
|
$412.56
|
-11.84
-2.79% |
$429.61
|
369,897
84.26% of 50 DAV
50 DAV is 439,000
|
$426.72
-3.32%
|
1/30/2024
|
$343.26
|
PP = $336.83
|
|
MB = $353.67
|
Most Recent Note - 4/4/2024 3:55:51 PM
G - Reversed into the red today after hitting another new all-time high. It is very extended from the previously noted base. Its 50 DMA line ($377) defines important support to watch.
>>> FEATURED STOCK ARTICLE : Hubbell Perched at All-Time High After 5 Weekly Gains - 3/22/2024 |
View all notes |
Set NEW NOTE alert |
Company Profile |
SEC
News |
Chart |
Request a new note
C
A
S
I |
MANH
-
NASDAQ
Manhattan Associates
Computer Sftwr-Enterprse
|
$242.03
|
+0.33
0.14% |
$246.80
|
360,668
94.42% of 50 DAV
50 DAV is 382,000
|
$266.94
-9.33%
|
1/31/2024
|
$240.57
|
PP = $230.71
|
|
MB = $242.25
|
Most Recent Note - 4/1/2024 9:18:56 PM
G - Down today and volume totals have been cooling while consolidating above its 50 DMA line ($245.59) which defines near-term support.
>>> FEATURED STOCK ARTICLE : Manhattan Associates Consolidating Above 50-Day Moving Average - 3/25/2024 |
View all notes |
Set NEW NOTE alert |
Company Profile |
SEC
News |
Chart |
Request a new note
C
A
S
I |
USLM
-
NASDAQ
U.S. Lime & Minerals
Bldg-Cement/Concrt/Ag
|
$298.74
|
-1.99
-0.66% |
$305.63
|
33,040
132.16% of 50 DAV
50 DAV is 25,000
|
$307.48
-2.84%
|
2/9/2024
|
$254.68
|
PP = $265.09
|
|
MB = $278.34
|
Most Recent Note - 4/3/2024 12:41:57 PM
G - Posting a gain today while still hovering near its all-time high, extended from the previously noted base. Its 50 DMA line ($270) defines near-term support to watch above prior highs in the $265-266 area.
>>> FEATURED STOCK ARTICLE : Hit New All Time High With Light Volume Behind 5th Straight Gain - 3/13/2024 |
View all notes |
Set NEW NOTE alert |
Company Profile |
SEC
News |
Chart |
Request a new note
C
A
S
I |
NOW
-
NYSE
ServiceNow
Computer Sftwr-Enterprse
|
$757.55
|
-1.61
-0.21% |
$782.25
|
1,022,246
81.65% of 50 DAV
50 DAV is 1,252,000
|
$815.32
-7.09%
|
2/22/2024
|
$771.75
|
PP = $815.32
|
|
MB = $856.09
|
Most Recent Note - 4/1/2024 9:20:33 PM
Y - Posted another small gain today with lighter volume, quietly consolidating near its 50 DMA line ($770). Prior lows in the $730 area define the next important near-term support to watch.
>>> FEATURED STOCK ARTICLE : NOW Quietly Rebounded Above 50-Day Moving Average Line - 3/20/2024 |
View all notes |
Set NEW NOTE alert |
Company Profile |
SEC
News |
Chart |
Request a new note
C
A
S
I |
Symbol/Exchange
Company Name
Industry Group |
PRICE |
CHANGE
(%Change) |
Day High |
Volume
(% DAV)
(% 50 day avg vol) |
52 Wk Hi
% From Hi |
Featured
Date |
Price
Featured |
Pivot Featured |
|
Max Buy |
SNPS
-
NASDAQ
Synopsys
Computer Sftwr-Design
|
$567.11
|
-11.76
-2.03% |
$592.71
|
982,951
87.92% of 50 DAV
50 DAV is 1,118,000
|
$629.38
-9.89%
|
2/22/2024
|
$600.65
|
PP = $582.85
|
|
MB = $611.99
|
Most Recent Note - 4/2/2024 11:51:34 AM
Y - Consolidating just above near-term support to watch at its 50 DMA line ($564.48). More damaging losses would raise concerns and trigger a technical sell signal. Previously noted - " A strong volume-driven gain and close above the pivot point is needed to clinch a proper technical buy signal."
>>> FEATURED STOCK ARTICLE : Rallying From Support at 50-Day Moving Average Line - 3/19/2024 |
View all notes |
Set NEW NOTE alert |
Company Profile |
SEC
News |
Chart |
Request a new note
C
A
S
I |
PAY
-
NYSE
Paymentus Holdings
Finance-CrdtCard/PmtPr
|
$20.55
|
-0.73
-3.43% |
$21.63
|
538,554
152.13% of 50 DAV
50 DAV is 354,000
|
$25.21
-18.48%
|
3/5/2024
|
$19.97
|
PP = $18.89
|
|
MB = $19.83
|
Most Recent Note - 4/4/2024 3:58:14 PM
G - Suffering a 4th consecutive loss today with above-average volume. It is extended from the previously noted base. Its 50 DMA line ($18.60) coincides with prior highs in the $18 range defining important support to watch on pullbacks.
>>> FEATURED STOCK ARTICLE : Consolidating After Powerful Breakout and Volume-Driven Gains - 3/27/2024 |
View all notes |
Set NEW NOTE alert |
Company Profile |
SEC
News |
Chart |
Request a new note
C
A
S
I |
HUBS
-
NYSE
HubSpot
Comp Sftwr-Spec Enterprs
|
$657.85
|
+31.15
4.97% |
$693.85
|
3,057,740
673.51% of 50 DAV
50 DAV is 454,000
|
$660.00
-0.33%
|
4/4/2024
|
$686.66
|
PP = $660.10
|
|
MB = $693.11
|
Most Recent Note - 4/4/2024 11:54:20 PM
Y - Finished in middle of intra-day range after highlighted yellow with pivot point cited based on its 2/09/24 high plus 10 cents. Hit a new 52-week high with today's volume-driven gain triggering a technical buy signal after finding prompt support at its 50 DMA line ($615.57) in recent weeks. Reported Dec '23 quarterly earnings +59% on +24% sales revenues versus the year-ago period, its 6th consecutive quarterly comparison well above the +25% minimum guideline (C criteria). Annual earnings history (A criteria) has been strong. Faces some resistance due to old overhead supply up to the $866 level. See the latest FSU analysis for more details and a new annotated graph.
>>> FEATURED STOCK ARTICLE : Encountered Distributional Pressure and Finished Below Pivot Point - 4/4/2024 |
View all notes |
Set NEW NOTE alert |
Company Profile |
SEC
News |
Chart |
Request a new note
C
A
S
I |
|
|
|
THESE ARE NOT BUY RECOMMENDATIONS!
Comments contained in the body of this report are technical
opinions only. The material herein has been obtained
from sources believed to be reliable and accurate, however,
its accuracy and completeness cannot be guaranteed.
This site is not an investment advisor, hence it does
not endorse or recommend any securities or other investments.
Any recommendation contained in this report may not
be suitable for all investors and it is not to be deemed
an offer or solicitation on our part with respect to
the purchase or sale of any securities. All trademarks,
service marks and trade names appearing in this report
are the property of their respective owners, and are
likewise used for identification purposes only.
This report is a service available
only to active Paid Premium Members.
You may opt-out of receiving report notifications
at any time. Questions or comments may be submitted
by writing to Premium Membership Services 665 S.E. 10 Street, Suite 201 Deerfield Beach, FL 33441-5634 or by calling 1-800-965-8307
or 954-785-1121.
|
|
|