You are not logged in.
This means you
CAN ONLY VIEW reports that were published prior to Monday, April 14, 2025.
You
MUST UPGRADE YOUR MEMBERSHIP if you want to see any current reports.
AFTER MARKET UPDATE - FRIDAY, APRIL 1ST, 2011
Previous After Market Report Next After Market Report >>>
|
|
|
|
DOW |
+56.99 |
12,376.72 |
+0.46% |
|
Volume |
911,651,460 |
-15% |
|
Volume |
2,025,018,690 |
+10% |
|
NASDAQ |
+8.53 |
2,789.60 |
+0.31% |
|
Advancers |
2,079 |
66% |
|
Advancers |
1,455 |
53% |
|
S&P 500 |
+6.58 |
1,332.41 |
+0.50% |
|
Decliners |
951 |
30% |
|
Decliners |
1,163 |
43% |
|
Russell 2000 |
+3.22 |
846.77 |
+0.38% |
|
52 Wk Highs |
383 |
|
|
52 Wk Highs |
250 |
|
|
S&P 600 |
+1.40 |
448.03 |
+0.31% |
|
52 Wk Lows |
12 |
|
|
52 Wk Lows |
27 |
|
|
 |
Major Averages Begin 2nd Quarter With Positive Bias
Kenneth J. Gruneisen - Passed the CAN SLIM® Master's Exam
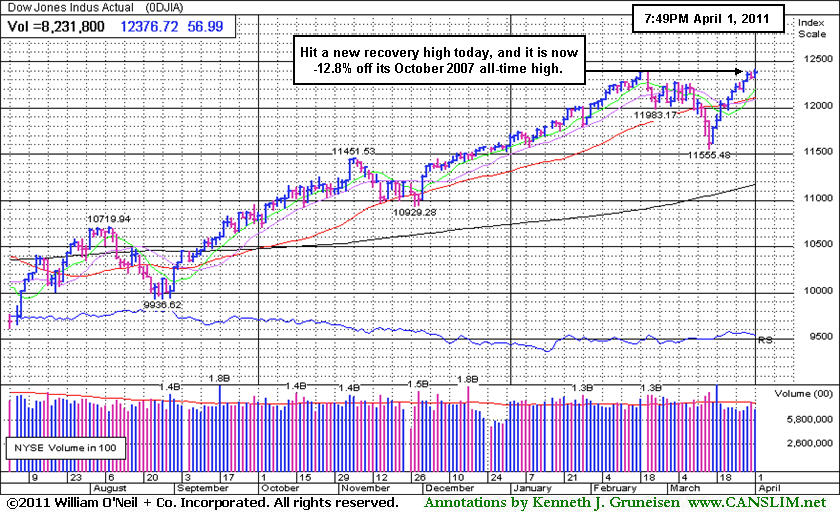
For the week, the Dow Jones Industrial Average rose +1.3%, the S&P 500 Index gained +1.4%, and the Nasdaq Composite Index was up +1.7%. With the market back in a "confirmed uptrend", the Dow reached a new recovery high. Volume totals were reported mixed, lighter than the prior session on the NYSE, yet higher on the Nasdaq exchange versus the prior session. Advancing issues beat decliners by 9-4 on the NYSE and by 6-5 on the Nasdaq. New 52-week highs totals swelled significantly while new 52-week lows lists shriveled on the Nasdaq exchange and on the NYSE. There were 142 high-ranked companies from the CANSLIM.net Leaders List that made new 52-week highs and appeared on the CANSLIM.net BreakOuts Page, up from the total of 94 on the prior session. On the Featured Stocks Page there were gains from 13 of the 20 high-ranked market leaders currently listed.
April opened with a positive bias, although some of Friday's early gains dissipated by the close. Economic reports and auto sales gave the market an early boost. The March unemployment rate fell to a two-year low of 8.8%. Hiring by private businesses has topped 200,000 in back-to-back months for the first time since 2006, more than a year before the recession started. A report on factory activity also suggested better times ahead for the U.S. economy. Manufacturing expanded in March at close to the fastest pace in almost seven years.
Most automakers reported March sales above analyst forecasts. The new General Motors Company (GM +4.45%) was an exception, but shares rose anyway as GM cited lower discounts. One report said a round of selling late in the day might have been initiated by fund managers raising cash to buy shares of Blackrock, Inc (BLK +0.7%) which was added to the S&P 500 Index after the close.
The benchmark S&P 500 Index finished the week -0.08% off its 2011 high, and -15.5% off its October 2007 all-time high. The tech-heavy Nasdaq Composite Index finished the week -1.8% off its 2011 high, and -2.5% off its October 2007 peak. CANSLIM.net commentaries have cited recent signs of new leadership (increase in new 52-week highs) considered to be critical proof that the market (M criteria) has a healthy crop of strong leaders underpinning the latest rally effort. Odds are considered to be favorable for disciplined investors who may buy high-ranked leaders when all key criteria of the fact-based investment system are met and powerful technical breakouts occur. The usual discipline applies, and losses should always be limited if a stock falls -7% or more from your purchase price.
NOTICE: The CANSLIM.net Q1 2011 Webcast aired on March 30th and is available "on demand" now (click here). It includes a summary of current market conditions, leading industry groups, and recent buy candidates while reviewing prior reports. All UPGRADED MEMBERS are currently entitled to access these webcasts at no additional cost. You will find the link to the Webcast highlighted near the top of the Premium Membership Homepage. The April 2011 issue of CANSLIM.net News will also be published very soon! Be sure to read it!
PICTURED: The Dow Jones Industrial Average has shown leadership after the major averages' latest correction. On Friday it made it to a new recovery high, meanwhile the Blue Chip index is -12.8% off its October 2007 all-time high.
|
 Kenneth J. Gruneisen started out as a licensed stockbroker in August 1987, a couple of months prior to the historic stock market crash that took the Dow Jones Industrial Average down -22.6% in a single day. He has published daily fact-based fundamental and technical analysis on high-ranked stocks online for two decades. Through FACTBASEDINVESTING.COM, Kenneth provides educational articles, news, market commentary, and other information regarding proven investment systems that work in good times and bad.
Comments contained in the body of this report are technical opinions only and are not necessarily those of Gruneisen Growth Corp. The material herein has been obtained from sources believed to be reliable and accurate, however, its accuracy and completeness cannot be guaranteed. Our firm, employees, and customers may effect transactions, including transactions contrary to any recommendation herein, or have positions in the securities mentioned herein or options with respect thereto. Any recommendation contained in this report may not be suitable for all investors and it is not to be deemed an offer or solicitation on our part with respect to the purchase or sale of any securities. |
|
 |
Financial Groups Post Gains, But Not Showing Leadership
Kenneth J. Gruneisen - Passed the CAN SLIM® Master's Exam
The Retail Index ($RLX +0.81%) posted a gain and the financial group also added some important positive influences to Friday's rally as the Bank Index ($BKX +0.98%) and Broker/Dealer Index ($XBD +1.26%) tallied gains. The Healthcare Index ($HMO +1.29%) posted a gain as it continued with the great strength it has shown since the start of the year, and the Biotechnology Index ($BTK +0.62%) has a positive bias. Other tech ares were weaker as the Networking Index ($NWX -1.27%) and Semiconductor Index ($SOX -1.03%) lost ground and the Internet Index ($IIX +0.01%) ended flat. Commodity-linked groups were mixed as the Gold & Silver Index ($XAU -0.84%) fell and the Integrated Oil Index ($XOI +0.93%) and Oil Services Index ($OSX +0.19%) were up for the day.
Charts courtesy www.stockcharts.com
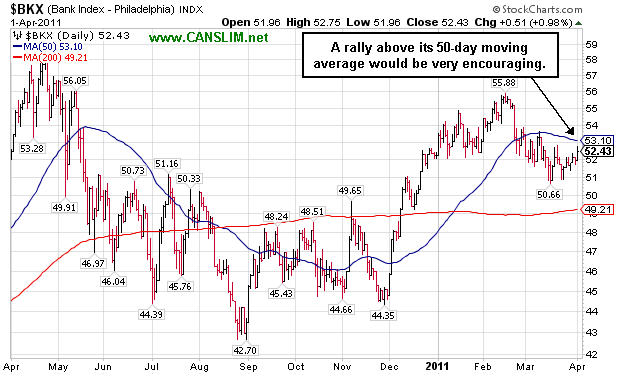
PICTURED: The Bank Index ($BKX +0.98%) has been sputtering under its 50-day moving average (DMA) line for the past month. The Broker/Dealer Index (not shown) is also below its 50 DMA line, as neither group has been the source of market leadership. Since the financial groups are important leading indicators, further weakness could hurt the rally's chances of continuing much higher, meanwhile, any rally(s) above their 50 DMA lines might help the market gain greater upward momentum.
| Oil Services |
$OSX |
296.13 |
+0.55 |
+0.19% |
+20.81% |
| Healthcare |
$HMO |
2,209.83 |
+28.05 |
+1.29% |
+30.61% |
| Integrated Oil |
$XOI |
1,391.62 |
+12.79 |
+0.93% |
+14.71% |
| Semiconductor |
$SOX |
432.85 |
-4.51 |
-1.03% |
+5.11% |
| Networking |
$NWX |
327.38 |
-4.21 |
-1.27% |
+16.69% |
| Internet |
$IIX |
318.11 |
+0.03 |
+0.01% |
+3.38% |
| Broker/Dealer |
$XBD |
122.00 |
+1.52 |
+1.26% |
+0.40% |
| Retail |
$RLX |
519.92 |
+4.17 |
+0.81% |
+2.27% |
| Gold & Silver |
$XAU |
214.93 |
-1.81 |
-0.84% |
-5.14% |
| Bank |
$BKX |
52.43 |
+0.51 |
+0.98% |
+0.42% |
| Biotech |
$BTK |
1,378.35 |
+8.56 |
+0.62% |
+6.22% |
|
|
|
 |
Under Accumulation
Kenneth J. Gruneisen - Passed the CAN SLIM® Master's Exam
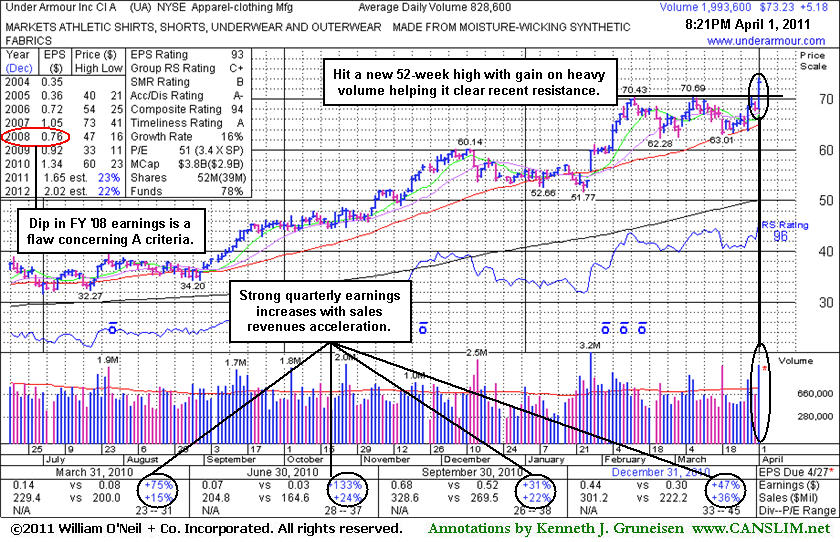
Prior quarters have shown strong earnings increases and strong sales revenues increases with acceleration which is very encouraging. Earnings were up +47% on +36% better sales revenues for the quarter ended December 31, 2010 versus the year ago period. Fundamentally, that improvement was a big help with respect to the C criteria. Earlier notes had acknowledged the downward turn in annual earnings (A criteria) in FY '08, a concern with respect to the fact-based investment system. The number of top-rated funds owning its shares rose from 308 in Mar '10 to 392 in Dec '10, a very reassuring sign concerning the I criteria.
Under Armour Inc (UA +$5.18 or +7.61% to $73.23) was previously noted, "Volume-driven gains for a strong close above its pivot point may trigger a new (or add-on) technical buy signal" as its color code was changed to yellow and a new pivot point was cited on 3/31/11. Its considerable gain today with more than 2 times average volume helped it rise from a base-on-base type pattern for a new 52-week high. It is clear of all resistance due to overhead supply. During the session it also traded above its 2007 all-time high ($73.40), and its ability to reach new all-time high territory could help it build even more upward momentum.
Following its last appearance in this FSU section on 3/07/11 with an annotated graph under the headline, "High-Ranked Apparel Firm Bucking Broader Weakness", it found support above its 50-day moving average (DMA) line. That is where institutional owners often accumulate more shares and add to current holdings when they view a company's outlook as still favorable. Whenever a stock slices below the 50 DMA line and volume swells behind damaging losses, concerns increase because it is clear some institutional holders are headed for the exits, rather than accumulating near that important short-term average.
|
|
|
Color Codes Explained :
Y - Better candidates highlighted by our
staff of experts.
G - Previously featured
in past reports as yellow but may no longer be buyable under the
guidelines.
***Last / Change / Volume data in this table is the closing quote data***
Symbol/Exchange
Company Name
Industry Group |
PRICE |
CHANGE
(%Change) |
Day High |
Volume
(% DAV)
(% 50 day avg vol) |
52 Wk Hi
% From Hi |
Featured
Date |
Price
Featured |
Pivot Featured |
|
Max Buy |
BIDU
-
NASDAQ
Baidu Inc Ads
INTERNET - Internet Information Providers
|
$138.83
|
+1.02
0.74% |
$139.44
|
7,247,588
103.88% of 50 DAV
50 DAV is 6,976,800
|
$138.53
0.22%
|
3/17/2011
|
$121.97
|
PP = $131.73
|
|
MB = $138.32
|
 Most Recent Note - 4/1/2011 8:49:46 PM
G - Wedged higher with gains this week to new highs on lighter or average volume, and its color code was changed to green after getting extended from its prior base, rising above its "max buy" level. Market conditions (M criteria) have recognizably improved in terms of leadership (new 52-week highs) in recent weeks without a strictly defined follow-through day. Prior high near $131 defines initial chart support to watch.
>>> The latest Featured Stock Update with an annotated graph appeared on 3/9/2011. Click here.
View all notes |
Alert me of new notes |
CANSLIM.net Company Profile |
SEC |
Zacks Reports |
StockTalk |
News |
Chart |
Request a new note
C
A N
S L
I M


|
CMG
-
NYSE
Chipotle Mexican Grill
LEISURE - Restaurants
|
$274.00
|
+1.63
0.60% |
$278.00
|
1,073,909
99.31% of 50 DAV
50 DAV is 1,081,400
|
$275.00
-0.36%
|
4/1/2011
|
$274.00
|
PP = $275.10
|
|
MB = $288.86
|
Most Recent Note - 4/1/2011 9:07:55 PM
Y - Touched a new all-time high today with average volume behind its 8th consecutive gain, steadily rising from support at its 50 DMA line. Color code is changed to yellow with new pivot point cited based on its prior high plus 10 cents after an orderly 7-week base pattern. Disciplined investors know to watch for confirming gains with above average volume to trigger a new (or add-on) technical buy signal.
>>> The latest Featured Stock Update with an annotated graph appeared on 3/14/2011. Click here.
View all notes |
Alert me of new notes |
CANSLIM.net Company Profile |
SEC |
Zacks Reports |
StockTalk |
News |
Chart |
Request a new note
C
A N
S L
I M
|
CTCT
-
NASDAQ
Constant Contact Inc
MEDIA - Advertising Services
|
$35.37
|
+0.47
1.35% |
$35.95
|
606,057
144.85% of 50 DAV
50 DAV is 418,400
|
$36.13
-2.10%
|
3/22/2011
|
$33.59
|
PP = $32.49
|
|
MB = $34.11
|
Most Recent Note - 3/30/2011 11:41:04 AM
G - Rising again today, its color code is changed to green while getting extended from its prior base. Prior highs in the $32 area define support to watch above its 50 DMA line. Approximately 40% of successful winners pull back and test support at their prior resistance level before continuing higher. Disciplined investors always limit losses if a stock falls more than -7% from their purchase price.
>>> The latest Featured Stock Update with an annotated graph appeared on 3/22/2011. Click here.
View all notes |
Alert me of new notes |
CANSLIM.net Company Profile |
SEC |
Zacks Reports |
StockTalk |
News |
Chart |
Request a new note
C
A N
S L
I M
|
CTSH
-
NASDAQ
Cognizant Tech Sol Cl A
COMPUTER SOFTWARE and SERVICES - Business Software and Services
|
$82.41
|
+1.01
1.24% |
$82.86
|
1,741,307
74.35% of 50 DAV
50 DAV is 2,342,000
|
$81.85
0.68%
|
2/7/2011
|
$75.09
|
PP = $76.46
|
|
MB = $80.28
|
Most Recent Note - 4/1/2011 2:19:47 PM
G - Hit new 52-week highs (N criteria) this week, wedging higher with gains on light volume. No resistance remains due to overhead supply. Color code was changed to green after gains above its "max buy" level without heavy enough volume to trigger a proper technical buy signal. Market conditions (M criteria) have recognizably improved in terms of leadership (new 52-week highs) in recent weeks without a strictly defined follow-through day.
>>> The latest Featured Stock Update with an annotated graph appeared on 3/17/2011. Click here.
View all notes |
Alert me of new notes |
CANSLIM.net Company Profile |
SEC |
Zacks Reports |
StockTalk |
News |
Chart |
Request a new note
C
A N
S L
I M
|
DECK
-
NASDAQ
Deckers Outdoor Corp
CONSUMER NON-DURABLES - Textile - Apparel Footwear
|
$87.34
|
+1.19
1.38% |
$88.29
|
781,480
55.49% of 50 DAV
50 DAV is 1,408,200
|
$94.70
-7.77%
|
2/3/2011
|
$79.61
|
PP = $82.67
|
|
MB = $86.80
|
Most Recent Note - 3/30/2011 5:52:30 PM
G - Today's 6th consecutive gain with light volume has it continuing to rebound toward prior highs. Color code is changed to green after rallying back above the previously cited "max buy" level after an earlier double bottom pattern noted. Its recent low ($77.71 on 3/21/11) defines the next important chart support level.
>>> The latest Featured Stock Update with an annotated graph appeared on 3/3/2011. Click here.
View all notes |
Alert me of new notes |
CANSLIM.net Company Profile |
SEC |
Zacks Reports |
StockTalk |
News |
Chart |
Request a new note
C
A N
S L
I M
|
Symbol/Exchange
Company Name
Industry Group |
PRICE |
CHANGE
(%Change) |
Day High |
Volume
(% DAV)
(% 50 day avg vol) |
52 Wk Hi
% From Hi |
Featured
Date |
Price
Featured |
Pivot Featured |
|
Max Buy |
EZPW
-
NASDAQ
Ezcorp Inc Cl A
SPECIALTY RETAIL - Specialty Retail, Other
|
$31.09
|
-0.31
-0.97% |
$31.75
|
277,508
75.72% of 50 DAV
50 DAV is 366,500
|
$31.80
-2.25%
|
2/18/2011
|
$27.94
|
PP = $30.04
|
|
MB = $31.54
|
Most Recent Note - 3/30/2011 7:22:13 PM
Y - Volume was below average behind its gain today while approaching its "max buy" level. Market conditions (M criteria) have recognizably improved in terms of leadership (new 52-week highs) in recent weeks without a strictly defined follow-through day.
>>> The latest Featured Stock Update with an annotated graph appeared on 3/10/2011. Click here.
View all notes |
Alert me of new notes |
CANSLIM.net Company Profile |
SEC |
Zacks Reports |
StockTalk |
News |
Chart |
Request a new note
C
A N
S L
I M
|
FOSL
-
NASDAQ
Fossil Inc
CONSUMER DURABLES - Recreational Goods, Other
|
$93.61
|
-0.04
-0.04% |
$94.77
|
760,223
78.47% of 50 DAV
50 DAV is 968,800
|
$93.65
-0.04%
|
2/1/2011
|
$73.30
|
PP = $74.44
|
|
MB = $78.16
|
Most Recent Note - 3/30/2011 7:19:41 PM
G - Wedging up today with lighter than average volume for another new all-time high, getting more extended from any sound base. See the latest FSU analysis for more details and a new annotated graph.
>>> The latest Featured Stock Update with an annotated graph appeared on 3/30/2011. Click here.
View all notes |
Alert me of new notes |
CANSLIM.net Company Profile |
SEC |
Zacks Reports |
StockTalk |
News |
Chart |
Request a new note
C
A N
S L
I M
|
HMSY
-
NASDAQ
H M S Holdings Corp
COMPUTER SOFTWARE and SERVICES - Healthcare Information Service
|
$82.69
|
+0.84
1.03% |
$82.98
|
145,787
87.56% of 50 DAV
50 DAV is 166,500
|
$83.98
-1.54%
|
11/19/2010
|
$61.89
|
PP = $63.01
|
|
MB = $66.16
|
Most Recent Note - 4/1/2011 9:09:15 PM
G - Gain today with light volume for its best close ever. It is extended from any sound base pattern and its 50 DMA line defines support to watch on pullbacks.
>>> The latest Featured Stock Update with an annotated graph appeared on 3/25/2011. Click here.
View all notes |
Alert me of new notes |
CANSLIM.net Company Profile |
SEC |
Zacks Reports |
StockTalk |
News |
Chart |
Request a new note
C
A N
S L
I M
|
HS
-
NYSE
Healthspring Inc
HEALTH SERVICES - Health Care Plans
|
$39.02
|
+1.65
4.42% |
$39.58
|
1,666,284
217.90% of 50 DAV
50 DAV is 764,700
|
$39.19
-0.43%
|
3/22/2011
|
$38.29
|
PP = $38.85
|
|
MB = $40.79
|
Most Recent Note - 4/1/2011 9:01:31 PM
Y - Today's 5th consecutive gain came with +117% above average volume and cleared the previously cited pivot point triggering a new (or add-on) technical buy signal . The new Public Offering completed on 3/25/11 may hinder its upward progress for the near-term, however it has been attracting top-rated funds as owners (I criteria).
>>> The latest Featured Stock Update with an annotated graph appeared on 3/23/2011. Click here.
View all notes |
Alert me of new notes |
CANSLIM.net Company Profile |
SEC |
Zacks Reports |
StockTalk |
News |
Chart |
Request a new note
C
A N
S L
I M
|
INFA
-
NASDAQ
Informatica Corp
COMPUTER SOFTWARE and SERVICES - Business Software and Services
|
$52.19
|
+0.00
0.00% |
$52.96
|
806,780
83.86% of 50 DAV
50 DAV is 962,000
|
$52.37
-0.34%
|
3/24/2011
|
$50.04
|
PP = $49.86
|
|
MB = $52.35
|
Most Recent Note - 3/31/2011 4:08:41 PM
Y - Up again today with near average volume, trading near its "max buy" level. Prior highs in the $49 area define initial support to watch. See the latest FSU analysis for more details and a new annotated graph.
>>> The latest Featured Stock Update with an annotated graph appeared on 3/28/2011. Click here.
View all notes |
Alert me of new notes |
CANSLIM.net Company Profile |
SEC |
Zacks Reports |
StockTalk |
News |
Chart |
Request a new note
C
A N
S L
I M
|
Symbol/Exchange
Company Name
Industry Group |
PRICE |
CHANGE
(%Change) |
Day High |
Volume
(% DAV)
(% 50 day avg vol) |
52 Wk Hi
% From Hi |
Featured
Date |
Price
Featured |
Pivot Featured |
|
Max Buy |
LULU
-
NASDAQ
Lululemon Athletica
MANUFACTURING - Textile Manufacturing
|
$89.13
|
+0.08
0.09% |
$90.93
|
1,899,499
84.64% of 50 DAV
50 DAV is 2,244,300
|
$90.97
-2.02%
|
3/28/2011
|
$68.11
|
PP = $85.38
|
|
MB = $89.65
|
Most Recent Note - 3/31/2011 4:51:26 PM
Y - Pulled back today on lighter volume, closing just below its "max buy" level, and its color code is changed to yellow. Technically it broke out this week with considerable volume-driven gains from a new base-on-base pattern. See the latest FSU analysis for additional details and a new annotated graph.
>>> The latest Featured Stock Update with an annotated graph appeared on 3/31/2011. Click here.
View all notes |
Alert me of new notes |
CANSLIM.net Company Profile |
SEC |
Zacks Reports |
StockTalk |
News |
Chart |
Request a new note
C
A N
S L
I M
|
MG
-
NYSE
Mistras Group Inc
DIVERSIFIED SERVICES - Bulding and Faci;ity Management Services
|
$17.10
|
-0.11
-0.64% |
$17.25
|
106,504
99.44% of 50 DAV
50 DAV is 107,100
|
$17.33
-1.33%
|
3/15/2011
|
$15.48
|
PP = $15.90
|
|
MB = $16.70
|
Most Recent Note - 3/31/2011 12:39:02 PM
G - Stubbornly holding its ground and inching higher, but it is extended from a sound base pattern now. Prior highs and its 50 DMA line define important support to watch on pullbacks.
>>> The latest Featured Stock Update with an annotated graph appeared on 3/15/2011. Click here.
View all notes |
Alert me of new notes |
CANSLIM.net Company Profile |
SEC |
Zacks Reports |
StockTalk |
News |
Chart |
Request a new note
C
A N
S L
I M
|
MWIV
-
NASDAQ
M W I Veterinary Supply
HEALTH SERVICES - Medical Instruments and; Supplies
|
$78.97
|
-1.71
-2.12% |
$80.75
|
125,646
133.24% of 50 DAV
50 DAV is 94,300
|
$80.86
-2.34%
|
11/4/2010
|
$61.79
|
PP = $59.60
|
|
MB = $62.58
|
Most Recent Note - 4/1/2011 9:13:26 PM
G - Pulled back on slightly higher volume today from the new all-time high hit on the prior session (without great volume conviction) following a consolidation in a tight range. It has been repeatedly noted as "extended from any sound base pattern."
>>> The latest Featured Stock Update with an annotated graph appeared on 3/8/2011. Click here.
View all notes |
Alert me of new notes |
CANSLIM.net Company Profile |
SEC |
Zacks Reports |
StockTalk |
News |
Chart |
Request a new note
C
A N
S L
I M
|
OPEN
-
NASDAQ
Opentable Inc
INTERNET - Internet Software and Services
|
$106.22
|
-0.13
-0.12% |
$107.44
|
1,532,421
128.43% of 50 DAV
50 DAV is 1,193,200
|
$107.47
-1.16%
|
3/17/2011
|
$90.71
|
PP = $96.07
|
|
MB = $100.87
|
Most Recent Note - 3/31/2011 12:54:44 PM
G - Perched at its all-time high, extended from its recently noted base. Its prior high near $96 defines initial support to watch on pullbacks following its latest technical breakout.
>>> The latest Featured Stock Update with an annotated graph appeared on 3/24/2011. Click here.
View all notes |
Alert me of new notes |
CANSLIM.net Company Profile |
SEC |
Zacks Reports |
StockTalk |
News |
Chart |
Request a new note
C
A N
S L
I M
|
PAY
-
NYSE
Verifone Systems Inc
COMPUTER HARDWARE - Transaction Automation Systems
|
$54.55
|
-0.40
-0.73% |
$55.32
|
2,860,500
147.40% of 50 DAV
50 DAV is 1,940,600
|
$58.88
-7.35%
|
1/27/2011
|
$41.77
|
PP = $44.97
|
|
MB = $47.22
|
Most Recent Note - 3/31/2011 12:56:00 PM
G - Pulling back today after a weak finish on the prior session after hitting another new all-time high. Repeatedly noted - "No resistance remains due to overhead supply, but it is extended from a sound base pattern. Its 50 DMA line defines chart support to watch."
>>> The latest Featured Stock Update with an annotated graph appeared on 3/2/2011. Click here.
View all notes |
Alert me of new notes |
CANSLIM.net Company Profile |
SEC |
Zacks Reports |
StockTalk |
News |
Chart |
Request a new note
C
A N
S L
I M
|
Symbol/Exchange
Company Name
Industry Group |
PRICE |
CHANGE
(%Change) |
Day High |
Volume
(% DAV)
(% 50 day avg vol) |
52 Wk Hi
% From Hi |
Featured
Date |
Price
Featured |
Pivot Featured |
|
Max Buy |
PCLN
-
NASDAQ
Priceline.Com Inc
INTERNET - Internet Software and Services
|
$513.85
|
+7.41
1.46% |
$515.64
|
1,393,791
117.00% of 50 DAV
50 DAV is 1,191,300
|
$509.00
0.95%
|
1/3/2011
|
$399.55
|
PP = $428.20
|
|
MB = $449.61
|
Most Recent Note - 3/30/2011 5:56:54 PM
G - Rose to a new 52-week high today with near average volume behind its gain, getting extended from any sound base pattern. Its 50 DMA line has defined support throughout its advance.
>>> The latest Featured Stock Update with an annotated graph appeared on 3/21/2011. Click here.
View all notes |
Alert me of new notes |
CANSLIM.net Company Profile |
SEC |
Zacks Reports |
StockTalk |
News |
Chart |
Request a new note
C
A N
S L
I M
|
RAX
-
NYSE
Rackspace Hosting Inc
INTERNET - Internet Software and; Services
|
$43.14
|
+0.29
0.68% |
$44.19
|
2,991,478
160.77% of 50 DAV
50 DAV is 1,860,700
|
$43.40
-0.60%
|
3/16/2011
|
$36.28
|
PP = $40.72
|
|
MB = $42.76
|
Most Recent Note - 4/1/2011 1:24:07 PM
G - Gain today has it getting more extended from its orderly 7-week flat base. Prior high near $40 defines chart support to watch on pullbacks. Disciplined investors avoid chasing extended stocks.
>>> The latest Featured Stock Update with an annotated graph appeared on 3/16/2011. Click here.
View all notes |
Alert me of new notes |
CANSLIM.net Company Profile |
SEC |
Zacks Reports |
StockTalk |
News |
Chart |
Request a new note
C
A N
S L
I M
|
TIBX
-
NASDAQ
Tibco Software Inc
COMPUTER SOFTWARE and SERVICES - Business Software and Services
|
$27.60
|
+0.35
1.28% |
$28.31
|
3,441,061
137.12% of 50 DAV
50 DAV is 2,509,500
|
$27.36
0.88%
|
3/18/2011
|
$23.88
|
PP = $26.04
|
|
MB = $27.34
|
Most Recent Note - 4/1/2011 11:14:35 AM
G - Gapped up today, hitting another new 52-week high. Extended from its prior base after a spurt of gains this week with above average volume, its color code is changed to green. Prior highs in the $25-26 area define support to watch on pullbacks.
>>> The latest Featured Stock Update with an annotated graph appeared on 3/18/2011. Click here.
View all notes |
Alert me of new notes |
CANSLIM.net Company Profile |
SEC |
Zacks Reports |
StockTalk |
News |
Chart |
Request a new note
C
A N
S L
I M
|
UA
-
NYSE
Under Armour Inc Cl A
CONSUMER NON-DURABLES - Textile - Apparel Clothing
|
$73.23
|
+5.18
7.61% |
$74.12
|
1,999,656
241.33% of 50 DAV
50 DAV is 828,600
|
$70.69
3.59%
|
3/31/2011
|
$68.04
|
PP = $70.79
|
|
MB = $74.33
|
Most Recent Note - 4/1/2011 8:57:34 PM
Y - Volume-driven gains for a strong close above its pivot point triggered a new (or add-on) technical buy signal today. It rose from a base-on-base type pattern and even traded above its 2007 all-time high ($73.40) intra-day. See the latest FSU analysis for more details and a new annotated graph.
>>> The latest Featured Stock Update with an annotated graph appeared on 4/1/2011. Click here.
View all notes |
Alert me of new notes |
CANSLIM.net Company Profile |
SEC |
Zacks Reports |
StockTalk |
News |
Chart |
Request a new note
C
A N
S L
I M
|
ULTA
-
NASDAQ
Ulta Salon Cosm & Frag
SPECIALTY RETAIL - Specialty Retail, Other
|
$48.45
|
+0.32
0.66% |
$48.87
|
548,923
90.34% of 50 DAV
50 DAV is 607,600
|
$48.88
-0.88%
|
1/6/2011
|
$36.12
|
PP = $37.34
|
|
MB = $39.21
|
Most Recent Note - 4/1/2011 9:11:14 PM
G - Perched at its all-time high, stubbornly holding its ground after a spurt of volume-driven gains. Prior highs and its 50 DMA line define chart support near the $44 level.
>>> The latest Featured Stock Update with an annotated graph appeared on 3/29/2011. Click here.
View all notes |
Alert me of new notes |
CANSLIM.net Company Profile |
SEC |
Zacks Reports |
StockTalk |
News |
Chart |
Request a new note
C
A N
S L
I M
|
Symbol/Exchange
Company Name
Industry Group |
PRICE |
CHANGE
(%Change) |
Day High |
Volume
(% DAV)
(% 50 day avg vol) |
52 Wk Hi
% From Hi |
Featured
Date |
Price
Featured |
Pivot Featured |
|
Max Buy |
|
|
|
THESE ARE NOT BUY RECOMMENDATIONS!
Comments contained in the body of this report are technical
opinions only. The material herein has been obtained
from sources believed to be reliable and accurate, however,
its accuracy and completeness cannot be guaranteed.
This site is not an investment advisor, hence it does
not endorse or recommend any securities or other investments.
Any recommendation contained in this report may not
be suitable for all investors and it is not to be deemed
an offer or solicitation on our part with respect to
the purchase or sale of any securities. All trademarks,
service marks and trade names appearing in this report
are the property of their respective owners, and are
likewise used for identification purposes only.
This report is a service available
only to active Paid Premium Members.
You may opt-out of receiving report notifications
at any time. Questions or comments may be submitted
by writing to Premium Membership Services 665 S.E. 10 Street, Suite 201 Deerfield Beach, FL 33441-5634 or by calling 1-800-965-8307
or 954-785-1121.
|
|
|

