You are not logged in.
This means you
CAN ONLY VIEW reports that were published prior to Wednesday, March 5, 2025.
You
MUST UPGRADE YOUR MEMBERSHIP if you want to see any current reports.
AFTER MARKET UPDATE - THURSDAY, MARCH 31ST, 2011
Previous After Market Report Next After Market Report >>>
|
|
|
|
DOW |
-30.88 |
12,319.73 |
-0.25% |
|
Volume |
1,077,232,330 |
+17% |
|
Volume |
1,834,564,400 |
+4% |
|
NASDAQ |
+4.28 |
2,781.07 |
+0.15% |
|
Advancers |
1,761 |
57% |
|
Advancers |
1,503 |
55% |
|
S&P 500 |
-2.43 |
1,325.83 |
-0.18% |
|
Decliners |
1,246 |
40% |
|
Decliners |
1,131 |
41% |
|
Russell 2000 |
+3.18 |
843.55 |
+0.38% |
|
52 Wk Highs |
236 |
|
|
52 Wk Highs |
195 |
|
|
S&P 600 |
+2.37 |
446.63 |
+0.53% |
|
52 Wk Lows |
15 |
|
|
52 Wk Lows |
33 |
|
|
The CANSLIM.net Q1 2011 Webcast aired on March 30th and is available "on demand" now (click here). It includes a summary of current market conditions, leading industry groups, and recent buy candidates while reviewing prior reports. All UPGRADED MEMBERS are currently entitled to access these webcasts at no additional cost. You will find the link to the Webcast highlighted near the top of the Premium Membership Homepage (and prior webcast links are lower on the page).
|
 |
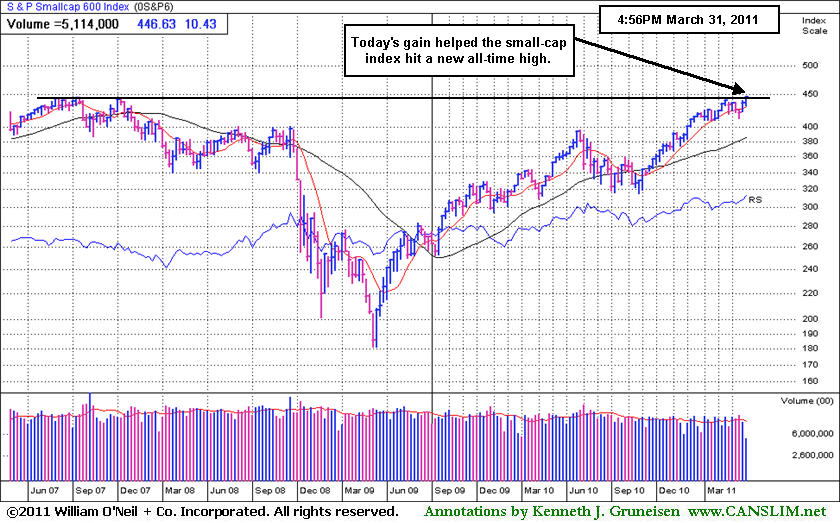
S&P Small-Cap Index Reaches New All-Time High
Kenneth J. Gruneisen - Passed the CAN SLIM® Master's Exam
The major averages were mixed on Thursday, yet with the market back in a "confirmed uptrend", the S&P Small-Cap 600 Index managed to reach a new all-time high. Volume totals on the NYSE and the Nasdaq exchange were higher than on the prior session. Advancers led decliners by about a 3-2 ratio on the NYSE and on the Nasdaq exchange. New 52-week highs outnumbered new 52-week lows on the Nasdaq exchange and on the NYSE. There were 94 high-ranked companies from the CANSLIM.net Leaders List that made new 52-week highs and appeared on the CANSLIM.net BreakOuts Page, down from the total of 119 on the prior session. On the Featured Stocks Page there were gains from 10 of the 20 high-ranked market leaders currently listed.
Today’s economic reports failed to inspire. Orders to U.S. factories fell 0.1% in February after rising for three straight months. The report from the Commerce Department said businesses bought fewer computers, turbines and power generators. First-time unemployment claims totaled 388,000, more than expected, although still below the key threshold of 400,000. The price of oil rose above $106 per barrel and the market waited for Friday's March employment report from the Labor Department.
Energy stocks rose while the conflict in Libya clouded the outlook for global supplies. Commodity producers were the best performers. Oil settled above $106 in New York, the highest close in two and a half years, and gold advanced to a record. Agriculture and farm machinery shares gained after revised crop forecasts from the U.S. Department of Agriculture suggested higher prices are ahead. Hershey Co (HSY -0.62%) edged lower after announcing it will boost wholesale prices nearly 10% because of rising costs for fuel, raw materials and transportation. This paves the way for similar increases by competitors.
Regular readers of this commentary know that we said, "The bullish action in the past week or more did not meet the strict definition of a follow-through day (FTD)", however, last Thursday's gain of +1.4% from the Nasdaq Composite Index has been recognized, albeit days later, by the newspaper as a follow-though day. CANSLIM.net commentaries have cited recent signs of new leadership (increase in new 52-week highs) that have suggested that the market has a healthy crop of strong leaders underpinning the latest rally effort. Additionally, we observed that the Dow Jones Industrial Average, S&P 500 Index, and the tech-heavy Nasdaq Composite Index, collectively, rallied back above their respective 50-day moving average (DMA) lines helping their technical stance improve. Barring any more damaging distribution days in the near term, investors may be wise to keep a close eye on a watchlist of high-ranked leaders and have a bias toward making new buys whenever all key criteria are met and powerful technical breakouts occur. The usual discipline applies, and losses should always be limited if a stock falls -7% or more from your purchase price.
NOTICE: The CANSLIM.net Q1 2011 Webcast aired on March 30th and is available "on demand" now (click here). It includes a summary of current market conditions, leading industry groups, and recent buy candidates while reviewing prior reports. All UPGRADED MEMBERS are currently entitled to access these webcasts at no additional cost. You will find the link to the Webcast highlighted near the top of the Premium Membership Homepage. A separate email announcement was also sent, directing you to where you may access this informative webcast.
PICTURED: The S&P Small-Cap Index hit a new all-time high, having fully recovered all that was lost in the 2007-09 Bear Market.
|
 Kenneth J. Gruneisen started out as a licensed stockbroker in August 1987, a couple of months prior to the historic stock market crash that took the Dow Jones Industrial Average down -22.6% in a single day. He has published daily fact-based fundamental and technical analysis on high-ranked stocks online for two decades. Through FACTBASEDINVESTING.COM, Kenneth provides educational articles, news, market commentary, and other information regarding proven investment systems that work in good times and bad.
Comments contained in the body of this report are technical opinions only and are not necessarily those of Gruneisen Growth Corp. The material herein has been obtained from sources believed to be reliable and accurate, however, its accuracy and completeness cannot be guaranteed. Our firm, employees, and customers may effect transactions, including transactions contrary to any recommendation herein, or have positions in the securities mentioned herein or options with respect thereto. Any recommendation contained in this report may not be suitable for all investors and it is not to be deemed an offer or solicitation on our part with respect to the purchase or sale of any securities. |
|
 |
Defensive Groups Led Gainers Again
Kenneth J. Gruneisen - Passed the CAN SLIM® Master's Exam
The Gold & Silver Index ($XAU +0.73%) and Healthcare Index ($HMO +0.43%) were among Thursday's best gainers as defensive groups took the lead for a second consecutive session. The Retail Index ($RLX -0.76%) and Bank Index ($BKX -0.40%) had a negative bias, dragging on the major averages, meanwhile the Broker/Dealer Index ($XBD +0.14%) inched higher. Energy-related shares were quiet as the Integrated Oil Index ($XOI -0.15%) and Oil Services Index ($OSX +0.06%) finished practically unchanged. The Semiconductor Index ($SOX -0.91%) weighed negatively on the tech sector while the Internet Index ($IIX +0.07%), Networking Index ($NWX +0.38%), and Biotechnology Index ($BTK +0.43%) posted small gains.
Charts courtesy www.stockcharts.com
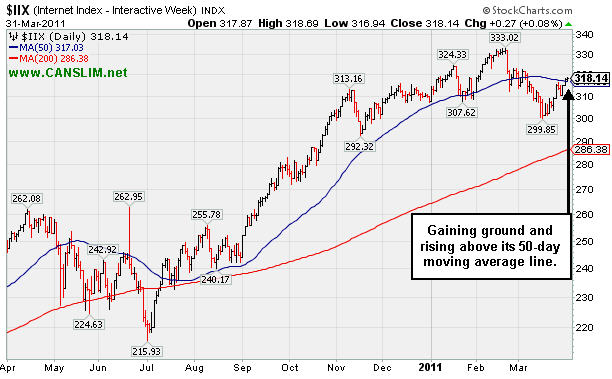
PICTURED: The Internet Index ($IIX +0.07%) closed back above its 50-day moving average line.
| Oil Services |
$OSX |
295.58 |
+0.17 |
+0.06% |
+20.59% |
| Healthcare |
$HMO |
2,181.78 |
+9.33 |
+0.43% |
+28.95% |
| Integrated Oil |
$XOI |
1,378.83 |
-2.08 |
-0.15% |
+13.66% |
| Semiconductor |
$SOX |
437.36 |
-4.02 |
-0.91% |
+6.20% |
| Networking |
$NWX |
331.59 |
+1.25 |
+0.38% |
+18.19% |
| Internet |
$IIX |
318.08 |
+0.22 |
+0.07% |
+3.36% |
| Broker/Dealer |
$XBD |
120.47 |
+0.17 |
+0.14% |
-0.86% |
| Retail |
$RLX |
515.75 |
-3.96 |
-0.76% |
+1.45% |
| Gold & Silver |
$XAU |
216.74 |
+1.58 |
+0.73% |
-4.34% |
| Bank |
$BKX |
51.92 |
-0.21 |
-0.40% |
-0.56% |
| Biotech |
$BTK |
1,369.80 |
+5.90 |
+0.43% |
+5.56% |
|
|
|
 |
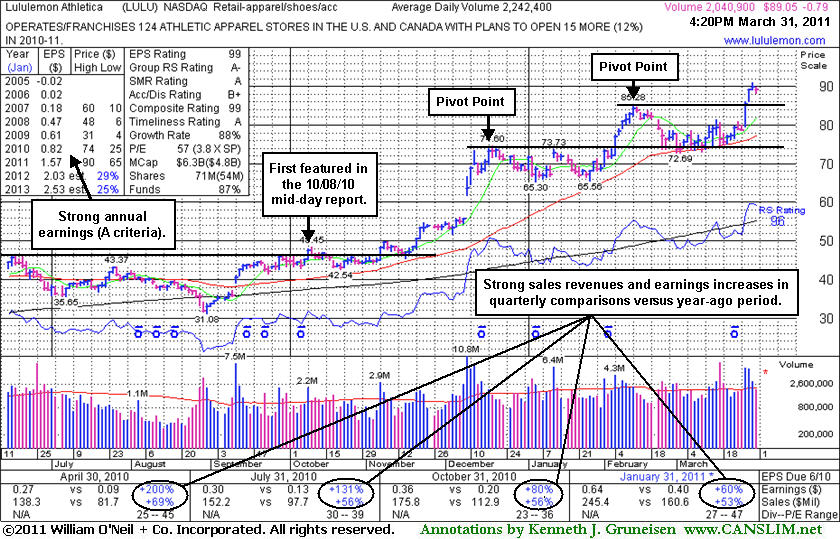
Consolidating After Breakout Above New Pivot Point
Kenneth J. Gruneisen - Passed the CAN SLIM® Master's Exam
Lululemon Athletica (LULU -$0.79 or -0.88% to $89.05) hit new all-time highs this week as considerable volume-driven gains above its latest pivot point triggered a new (or add-on) technical buy signal. It pulled back on lighter volume today and finished just under its "max buy" level. Prior highs that were a resistance level now define chart support after its breakout from a new base-on-base pattern. Following its last appearance in this FSU section on 2/25/11 with an annotated graph under the headline, "Consolidating Above Support After Bout Of Distribution", it found support at its 50-day moving average (DMA) line. Eventually, a new pivot point was cited on 3/28/11, and it broke out again.
The number of top-rated fund owning its shares rose from 278 in Mar '10 to 300 in Dec '10, which is a reassuring sign concerning the I criteria. Its board of directors recently approved a 2-for-1 stock split (pending). Since this high-ranked Retail - Apparel/Shoes/Accessories firm was first featured in yellow at $47.66 in the October 8, 2010 mid-day report report (read here) and in that evening's Featured Stock Update section with an annotated graph (read here) it has traded up as much as +90.8% in less than 6 months. The 5 latest quarterly comparisons showed strong sales revenues and impressive earnings increases (C criteria), and it maintained a good annual earnings history (A criteria) despite a patch of negative comparisons in early '09.
|
|
|
Color Codes Explained :
Y - Better candidates highlighted by our
staff of experts.
G - Previously featured
in past reports as yellow but may no longer be buyable under the
guidelines.
***Last / Change / Volume data in this table is the closing quote data***
Symbol/Exchange
Company Name
Industry Group |
PRICE |
CHANGE
(%Change) |
Day High |
Volume
(% DAV)
(% 50 day avg vol) |
52 Wk Hi
% From Hi |
Featured
Date |
Price
Featured |
Pivot Featured |
|
Max Buy |
BIDU
-
NASDAQ
Baidu Inc Ads
INTERNET - Internet Information Providers
|
$137.81
|
+1.43
1.05% |
$137.89
|
4,942,875
70.53% of 50 DAV
50 DAV is 7,008,400
|
$138.53
-0.52%
|
3/17/2011
|
$121.97
|
PP = $131.73
|
|
MB = $138.32
|
Most Recent Note - 3/29/2011 5:49:04 PM
Y - Up today with lighter than average volume for its best-ever close. Its gain with 2 times average volume on 3/23/11 triggered a technical buy signal after a riskier "late stage" set-up. The M criteria remains a concern until a follow-through day confirms the new rally and justifies new buying efforts under the system's strict guidelines. Prior high near $131 defines initial chart support to watch.
>>> The latest Featured Stock Update with an annotated graph appeared on 3/9/2011. Click here.
View all notes |
Alert me of new notes |
CANSLIM.net Company Profile |
SEC |
Zacks Reports |
StockTalk |
News |
Chart |
Request a new note
C
A N
S L
I M


|
CMG
-
NYSE
Chipotle Mexican Grill
LEISURE - Restaurants
|
$272.37
|
+0.17
0.06% |
$273.92
|
642,163
59.39% of 50 DAV
50 DAV is 1,081,200
|
$275.00
-0.96%
|
2/11/2011
|
$271.15
|
PP = $262.87
|
|
MB = $276.01
|
Most Recent Note - 3/29/2011 5:31:43 PM
G - Closed near the session high with a 5th consecutive gain, rising from support at its 50 DMA line for its third highest close with gains this week backed by light or near average volume. Its recent low ($234.48 on 3/02/11) defines another important nearby level for chart readers to watch closely. Subsequent violations and damaging losses would raise greater concerns and trigger technical sell signals.
>>> The latest Featured Stock Update with an annotated graph appeared on 3/14/2011. Click here.
View all notes |
Alert me of new notes |
CANSLIM.net Company Profile |
SEC |
Zacks Reports |
StockTalk |
News |
Chart |
Request a new note
C
A N
S L
I M
|
CTCT
-
NASDAQ
Constant Contact Inc
MEDIA - Advertising Services
|
$34.90
|
+0.36
1.04% |
$35.02
|
553,468
134.17% of 50 DAV
50 DAV is 412,500
|
$36.13
-3.40%
|
3/22/2011
|
$33.59
|
PP = $32.49
|
|
MB = $34.11
|
Most Recent Note - 3/30/2011 11:41:04 AM
G - Rising again today, its color code is changed to green while getting extended from its prior base. Prior highs in the $32 area define support to watch above its 50 DMA line. Approximately 40% of successful winners pull back and test support at their prior resistance level before continuing higher. Disciplined investors always limit losses if a stock falls more than -7% from their purchase price.
>>> The latest Featured Stock Update with an annotated graph appeared on 3/22/2011. Click here.
View all notes |
Alert me of new notes |
CANSLIM.net Company Profile |
SEC |
Zacks Reports |
StockTalk |
News |
Chart |
Request a new note
C
A N
S L
I M
|
CTSH
-
NASDAQ
Cognizant Tech Sol Cl A
COMPUTER SOFTWARE and SERVICES - Business Software and Services
|
$81.40
|
-0.25
-0.31% |
$81.85
|
1,602,509
68.10% of 50 DAV
50 DAV is 2,353,000
|
$81.78
-0.46%
|
2/7/2011
|
$75.09
|
PP = $76.46
|
|
MB = $80.28
|
Most Recent Note - 3/29/2011 5:54:35 PM
G - Held its ground and finished at a best-ever close today. Recent gains helped it hit a new 52-week high (N criteria) , with no resistance remaining due to overhead supply. Color code is changed to green after gains above its "max buy" level without heavy enough volume to trigger a proper technical buy signal. Disciplined investors also know that a follow-through day (FTD) is needed to confirm the market direction (M criteria) is again favorable for new buying efforts.
>>> The latest Featured Stock Update with an annotated graph appeared on 3/17/2011. Click here.
View all notes |
Alert me of new notes |
CANSLIM.net Company Profile |
SEC |
Zacks Reports |
StockTalk |
News |
Chart |
Request a new note
C
A N
S L
I M
|
DECK
-
NASDAQ
Deckers Outdoor Corp
CONSUMER NON-DURABLES - Textile - Apparel Footwear
|
$86.15
|
-1.24
-1.42% |
$87.60
|
639,739
44.92% of 50 DAV
50 DAV is 1,424,200
|
$94.70
-9.03%
|
2/3/2011
|
$79.61
|
PP = $82.67
|
|
MB = $86.80
|
Most Recent Note - 3/30/2011 5:52:30 PM
G - Today's 6th consecutive gain with light volume has it continuing to rebound toward prior highs. Color code is changed to green after rallying back above the previously cited "max buy" level after an earlier double bottom pattern noted. Its recent low ($77.71 on 3/21/11) defines the next important chart support level.
>>> The latest Featured Stock Update with an annotated graph appeared on 3/3/2011. Click here.
View all notes |
Alert me of new notes |
CANSLIM.net Company Profile |
SEC |
Zacks Reports |
StockTalk |
News |
Chart |
Request a new note
C
A N
S L
I M
|
Symbol/Exchange
Company Name
Industry Group |
PRICE |
CHANGE
(%Change) |
Day High |
Volume
(% DAV)
(% 50 day avg vol) |
52 Wk Hi
% From Hi |
Featured
Date |
Price
Featured |
Pivot Featured |
|
Max Buy |
EZPW
-
NASDAQ
Ezcorp Inc Cl A
SPECIALTY RETAIL - Specialty Retail, Other
|
$31.39
|
-0.11
-0.35% |
$31.60
|
252,148
67.46% of 50 DAV
50 DAV is 373,800
|
$31.80
-1.29%
|
2/18/2011
|
$27.94
|
PP = $30.04
|
|
MB = $31.54
|
Most Recent Note - 3/30/2011 7:22:13 PM
Y - Volume was below average behind its gain today while approaching its "max buy" level. Market conditions (M criteria) have recognizably improved in terms of leadership (new 52-week highs) in recent weeks without a strictly defined follow-through day.
>>> The latest Featured Stock Update with an annotated graph appeared on 3/10/2011. Click here.
View all notes |
Alert me of new notes |
CANSLIM.net Company Profile |
SEC |
Zacks Reports |
StockTalk |
News |
Chart |
Request a new note
C
A N
S L
I M
|
FOSL
-
NASDAQ
Fossil Inc
CONSUMER DURABLES - Recreational Goods, Other
|
$93.65
|
+1.96
2.14% |
$93.65
|
1,065,334
110.76% of 50 DAV
50 DAV is 961,800
|
$91.95
1.85%
|
2/1/2011
|
$73.30
|
PP = $74.44
|
|
MB = $78.16
|
Most Recent Note - 3/30/2011 7:19:41 PM
G - Wedging up today with lighter than average volume for another new all-time high, getting more extended from any sound base. See the latest FSU analysis for more details and a new annotated graph.
>>> The latest Featured Stock Update with an annotated graph appeared on 3/30/2011. Click here.
View all notes |
Alert me of new notes |
CANSLIM.net Company Profile |
SEC |
Zacks Reports |
StockTalk |
News |
Chart |
Request a new note
C
A N
S L
I M
|
HMSY
-
NASDAQ
H M S Holdings Corp
COMPUTER SOFTWARE and SERVICES - Healthcare Information Service
|
$81.85
|
-0.61
-0.74% |
$82.87
|
201,091
121.21% of 50 DAV
50 DAV is 165,900
|
$83.98
-2.54%
|
11/19/2010
|
$61.89
|
PP = $63.01
|
|
MB = $66.16
|
Most Recent Note - 3/29/2011 5:47:18 PM
G - Gain today with slightly above average volume for its best close ever. It is extended from any sound base pattern. See the latest FSU analysis for additional details and a new annotated graph.
>>> The latest Featured Stock Update with an annotated graph appeared on 3/25/2011. Click here.
View all notes |
Alert me of new notes |
CANSLIM.net Company Profile |
SEC |
Zacks Reports |
StockTalk |
News |
Chart |
Request a new note
C
A N
S L
I M
|
HS
-
NYSE
Healthspring Inc
HEALTH SERVICES - Health Care Plans
|
$37.37
|
+0.14
0.38% |
$37.46
|
887,153
117.64% of 50 DAV
50 DAV is 754,100
|
$39.19
-4.64%
|
3/22/2011
|
$38.29
|
PP = $38.85
|
|
MB = $40.79
|
Most Recent Note - 3/28/2011 7:17:04 PM
G - Held its ground today. Gapped down on 3/25/11 after pricing a new Public Offering of 7.5 million shares, holding its ground near recent lows and well above its 50 DMA line. It failed to convincingly rally for a close above its pivot point after touching a new 52-week high on 3/22/11, and its color code was changed to green after slumping more than -7% below its pivot point.
>>> The latest Featured Stock Update with an annotated graph appeared on 3/23/2011. Click here.
View all notes |
Alert me of new notes |
CANSLIM.net Company Profile |
SEC |
Zacks Reports |
StockTalk |
News |
Chart |
Request a new note
C
A N
S L
I M
|
INFA
-
NASDAQ
Informatica Corp
COMPUTER SOFTWARE and SERVICES - Business Software and Services
|
$52.19
|
+0.94
1.83% |
$52.37
|
960,879
99.24% of 50 DAV
50 DAV is 968,200
|
$51.97
0.42%
|
3/24/2011
|
$50.04
|
PP = $49.86
|
|
MB = $52.35
|
 Most Recent Note - 3/31/2011 4:08:41 PM
Y - Up again today with near average volume, trading near its "max buy" level. Prior highs in the $49 area define initial support to watch. See the latest FSU analysis for more details and a new annotated graph.
>>> The latest Featured Stock Update with an annotated graph appeared on 3/28/2011. Click here.
View all notes |
Alert me of new notes |
CANSLIM.net Company Profile |
SEC |
Zacks Reports |
StockTalk |
News |
Chart |
Request a new note
C
A N
S L
I M
|
Symbol/Exchange
Company Name
Industry Group |
PRICE |
CHANGE
(%Change) |
Day High |
Volume
(% DAV)
(% 50 day avg vol) |
52 Wk Hi
% From Hi |
Featured
Date |
Price
Featured |
Pivot Featured |
|
Max Buy |
LULU
-
NASDAQ
Lululemon Athletica
MANUFACTURING - Textile Manufacturing
|
$89.05
|
-0.79
-0.88% |
$89.71
|
2,043,375
91.12% of 50 DAV
50 DAV is 2,242,400
|
$90.97
-2.11%
|
3/28/2011
|
$68.11
|
PP = $85.38
|
|
MB = $89.65
|
Most Recent Note - 3/31/2011 4:51:26 PM
Y - Pulled back today on lighter volume, closing just below its "max buy" level, and its color code is changed to yellow. Technically it broke out this week with considerable volume-driven gains from a new base-on-base pattern. See the latest FSU analysis for additional details and a new annotated graph.
>>> The latest Featured Stock Update with an annotated graph appeared on 3/31/2011. Click here.
View all notes |
Alert me of new notes |
CANSLIM.net Company Profile |
SEC |
Zacks Reports |
StockTalk |
News |
Chart |
Request a new note
C
A N
S L
I M
|
MG
-
NYSE
Mistras Group Inc
DIVERSIFIED SERVICES - Bulding and Faci;ity Management Services
|
$17.21
|
+0.01
0.06% |
$17.33
|
154,516
146.88% of 50 DAV
50 DAV is 105,200
|
$17.29
-0.46%
|
3/15/2011
|
$15.48
|
PP = $15.90
|
|
MB = $16.70
|
Most Recent Note - 3/31/2011 12:39:02 PM
G - Stubbornly holding its ground and inching higher, but it is extended from a sound base pattern now. Prior highs and its 50 DMA line define important support to watch on pullbacks.
>>> The latest Featured Stock Update with an annotated graph appeared on 3/15/2011. Click here.
View all notes |
Alert me of new notes |
CANSLIM.net Company Profile |
SEC |
Zacks Reports |
StockTalk |
News |
Chart |
Request a new note
C
A N
S L
I M
|
MWIV
-
NASDAQ
M W I Veterinary Supply
HEALTH SERVICES - Medical Instruments and; Supplies
|
$80.68
|
+2.59
3.32% |
$80.86
|
101,225
107.57% of 50 DAV
50 DAV is 94,100
|
$78.48
2.80%
|
11/4/2010
|
$61.79
|
PP = $59.60
|
|
MB = $62.58
|
Most Recent Note - 3/31/2011 3:09:03 PM
G - Up today for a new all-time high without great volume conviction after consolidating in a tight range for the past 3 weeks. It has been repeatedly noted as "extended from any sound base pattern."
>>> The latest Featured Stock Update with an annotated graph appeared on 3/8/2011. Click here.
View all notes |
Alert me of new notes |
CANSLIM.net Company Profile |
SEC |
Zacks Reports |
StockTalk |
News |
Chart |
Request a new note
C
A N
S L
I M
|
OPEN
-
NASDAQ
Opentable Inc
INTERNET - Internet Software and Services
|
$106.35
|
-0.57
-0.53% |
$106.94
|
1,496,016
126.87% of 50 DAV
50 DAV is 1,179,200
|
$107.47
-1.04%
|
3/17/2011
|
$90.71
|
PP = $96.07
|
|
MB = $100.87
|
Most Recent Note - 3/31/2011 12:54:44 PM
G - Perched at its all-time high, extended from its recently noted base. Its prior high near $96 defines initial support to watch on pullbacks following its latest technical breakout.
>>> The latest Featured Stock Update with an annotated graph appeared on 3/24/2011. Click here.
View all notes |
Alert me of new notes |
CANSLIM.net Company Profile |
SEC |
Zacks Reports |
StockTalk |
News |
Chart |
Request a new note
C
A N
S L
I M
|
PAY
-
NYSE
Verifone Systems Inc
COMPUTER HARDWARE - Transaction Automation Systems
|
$54.95
|
-1.89
-3.33% |
$56.84
|
3,309,453
173.65% of 50 DAV
50 DAV is 1,905,800
|
$58.88
-6.67%
|
1/27/2011
|
$41.77
|
PP = $44.97
|
|
MB = $47.22
|
Most Recent Note - 3/31/2011 12:56:00 PM
G - Pulling back today after a weak finish on the prior session after hitting another new all-time high. Repeatedly noted - "No resistance remains due to overhead supply, but it is extended from a sound base pattern. Its 50 DMA line defines chart support to watch."
>>> The latest Featured Stock Update with an annotated graph appeared on 3/2/2011. Click here.
View all notes |
Alert me of new notes |
CANSLIM.net Company Profile |
SEC |
Zacks Reports |
StockTalk |
News |
Chart |
Request a new note
C
A N
S L
I M
|
Symbol/Exchange
Company Name
Industry Group |
PRICE |
CHANGE
(%Change) |
Day High |
Volume
(% DAV)
(% 50 day avg vol) |
52 Wk Hi
% From Hi |
Featured
Date |
Price
Featured |
Pivot Featured |
|
Max Buy |
PCLN
-
NASDAQ
Priceline.Com Inc
INTERNET - Internet Software and Services
|
$506.44
|
+2.44
0.48% |
$509.00
|
1,087,734
91.71% of 50 DAV
50 DAV is 1,186,100
|
$506.69
-0.05%
|
1/3/2011
|
$399.55
|
PP = $428.20
|
|
MB = $449.61
|
Most Recent Note - 3/30/2011 5:56:54 PM
G - Rose to a new 52-week high today with near average volume behind its gain, getting extended from any sound base pattern. Its 50 DMA line has defined support throughout its advance.
>>> The latest Featured Stock Update with an annotated graph appeared on 3/21/2011. Click here.
View all notes |
Alert me of new notes |
CANSLIM.net Company Profile |
SEC |
Zacks Reports |
StockTalk |
News |
Chart |
Request a new note
C
A N
S L
I M
|
RAX
-
NYSE
Rackspace Hosting Inc
INTERNET - Internet Software and; Services
|
$42.85
|
-0.16
-0.37% |
$43.40
|
2,003,205
108.31% of 50 DAV
50 DAV is 1,849,500
|
$43.32
-1.08%
|
3/16/2011
|
$36.28
|
PP = $40.72
|
|
MB = $42.76
|
Most Recent Note - 3/30/2011 5:26:12 PM
G - Spiked above its "max buy" level with a considerable gain today backed by 2 times average volume for a new all-time high, triggering a technical buy signal. Its color code is changed to green after quickly getting extended from its orderly 7-week flat base. Market conditions (M criteria) have recognizably improved in terms of leadership (new 52-week highs) in recent weeks without a strictly defined follow-through day.
>>> The latest Featured Stock Update with an annotated graph appeared on 3/16/2011. Click here.
View all notes |
Alert me of new notes |
CANSLIM.net Company Profile |
SEC |
Zacks Reports |
StockTalk |
News |
Chart |
Request a new note
C
A N
S L
I M
|
TIBX
-
NASDAQ
Tibco Software Inc
COMPUTER SOFTWARE and SERVICES - Business Software and Services
|
$27.25
|
+0.51
1.91% |
$27.36
|
3,224,210
127.23% of 50 DAV
50 DAV is 2,534,200
|
$27.00
0.93%
|
3/18/2011
|
$23.88
|
PP = $26.04
|
|
MB = $27.34
|
Most Recent Note - 3/31/2011 4:06:44 PM
Y - Gains this week with above average volume have it rising to new 52-week highs making gradual progress toward its "max buy" level. It is free of all resistance due to overhead supply.
>>> The latest Featured Stock Update with an annotated graph appeared on 3/18/2011. Click here.
View all notes |
Alert me of new notes |
CANSLIM.net Company Profile |
SEC |
Zacks Reports |
StockTalk |
News |
Chart |
Request a new note
C
A N
S L
I M
|
UA
-
NYSE
Under Armour Inc Cl A
CONSUMER NON-DURABLES - Textile - Apparel Clothing
|
$68.05
|
-0.98
-1.42% |
$69.50
|
651,389
78.79% of 50 DAV
50 DAV is 826,700
|
$70.69
-3.73%
|
3/31/2011
|
$68.04
|
PP = $70.79
|
|
MB = $74.33
|
Most Recent Note - 3/31/2011 4:02:30 PM
Y - Consolidating in an orderly fashion above its 50 DMA line forming a base-on-base type pattern. Color code is changed to yellow with a new pivot point based on its 52-week high plus 10 cents. Volume-driven gains for a strong close above its pivot point may trigger a new (or add-on) technical buy signal.
>>> The latest Featured Stock Update with an annotated graph appeared on 3/7/2011. Click here.
View all notes |
Alert me of new notes |
CANSLIM.net Company Profile |
SEC |
Zacks Reports |
StockTalk |
News |
Chart |
Request a new note
C
A N
S L
I M
|
ULTA
-
NASDAQ
Ulta Salon Cosm & Frag
SPECIALTY RETAIL - Specialty Retail, Other
|
$48.13
|
-0.58
-1.19% |
$48.84
|
266,881
43.42% of 50 DAV
50 DAV is 614,600
|
$48.88
-1.53%
|
1/6/2011
|
$36.12
|
PP = $37.34
|
|
MB = $39.21
|
Most Recent Note - 3/29/2011 7:21:00 PM
G - Quietly touched a new all-time high on the prior session and pulled back today. It has been stubbornly holding its ground after a spurt of volume-driven gains. See the latest FSU analysis for more details and a new annotated graph.
>>> The latest Featured Stock Update with an annotated graph appeared on 3/29/2011. Click here.
View all notes |
Alert me of new notes |
CANSLIM.net Company Profile |
SEC |
Zacks Reports |
StockTalk |
News |
Chart |
Request a new note
C
A N
S L
I M
|
Symbol/Exchange
Company Name
Industry Group |
PRICE |
CHANGE
(%Change) |
Day High |
Volume
(% DAV)
(% 50 day avg vol) |
52 Wk Hi
% From Hi |
Featured
Date |
Price
Featured |
Pivot Featured |
|
Max Buy |
|
|
|
THESE ARE NOT BUY RECOMMENDATIONS!
Comments contained in the body of this report are technical
opinions only. The material herein has been obtained
from sources believed to be reliable and accurate, however,
its accuracy and completeness cannot be guaranteed.
This site is not an investment advisor, hence it does
not endorse or recommend any securities or other investments.
Any recommendation contained in this report may not
be suitable for all investors and it is not to be deemed
an offer or solicitation on our part with respect to
the purchase or sale of any securities. All trademarks,
service marks and trade names appearing in this report
are the property of their respective owners, and are
likewise used for identification purposes only.
This report is a service available
only to active Paid Premium Members.
You may opt-out of receiving report notifications
at any time. Questions or comments may be submitted
by writing to Premium Membership Services 665 S.E. 10 Street, Suite 201 Deerfield Beach, FL 33441-5634 or by calling 1-800-965-8307
or 954-785-1121.
|
|
|

