You are not logged in.
This means you
CAN ONLY VIEW reports that were published prior to Monday, April 14, 2025.
You
MUST UPGRADE YOUR MEMBERSHIP if you want to see any current reports.
AFTER MARKET UPDATE - TUESDAY, MARCH 30TH, 2010
Previous After Market Report Next After Market Report >>>
|
|
|
|
DOW |
+11.56 |
10,907.42 |
+0.11% |
|
Volume |
906,712,850 |
-4% |
|
Volume |
2,074,100,110 |
+9% |
|
NASDAQ |
+6.33 |
2,410.69 |
+0.26% |
|
Advancers |
1,550 |
49% |
|
Advancers |
1,460 |
51% |
|
S&P 500 |
+0.05 |
1,173.27 |
+0.00% |
|
Decliners |
1,460 |
46% |
|
Decliners |
1,260 |
44% |
|
Russell 2000 |
+1.69 |
683.94 |
+0.25% |
|
52 Wk Highs |
222 |
|
|
52 Wk Highs |
109 |
|
|
S&P 600 |
+1.09 |
363.62 |
+0.30% |
|
52 Wk Lows |
7 |
|
|
52 Wk Lows |
11 |
|
|
 |
Recent Small Cap Strength Is Encouraging News For Growth Investors
Adam Sarhan, Contributing Writer,
The major averages traded between positive and negative territory after consumer confidence and home prices topped estimates. Volume totals on the NYSE and on the Nasdaq exchange were reported mixed; higher on the Nasdaq and lower on the NYSE while advancers narrowly led decliners on the NYSE and on the Nasdaq exchanges. There were 44 high-ranked companies from the CANSLIM.net Leaders List that made a new 52-week high and appeared on the CANSLIM.net BreakOuts Page, higher than the 31 issues that appeared on the prior session. New 52-week highs outnumbered new lows on both exchanges yet again.
Housing stocks sold off after the S&P/Case-Shiller index of home prices was released. The 20-city home-price index unexpectedly rose +0.3% in January. The closely watched index tracks monthly changes of home prices in 20 metropolitan regions across the country and is used as a good proxy for the underlying health of the residential real estate market. Elsewhere, the Conference Board released its consumer sentiment index which rose to +52.5 in March, up from +46.4 in February. Overseas, Standard & Poor’s cut Iceland’s currency's credit rating as the small country continues to make its way out of the worst economic crisis in several generations. In Europe, it was a bit disconcerting to see Greece fail to sell half the 12-year bonds needed to raise additional funds.
The fact that there have only been two distribution days since the follow-though-day (FTD) bodes well for the current rally. It is also a welcome sign to see the market continue to improve as investors digest the latest round of stronger than expected economic and earnings data. Remember that now that a new rally has been confirmed, the window is open to proactively be buying high quality breakouts meeting the investment system guidelines. Trade accordingly.
First Quarter 2010 Webcast airs at 8PM Tuesday, MARCH 30, 2010 (TONIGHT, and ON DEMAND afterward)
Don't miss your opportunity to view CANSLIM.net's Q1 2010 Webcast - Available free of charge now to all active StockNews (pay premium) members! The link to access the webcast has already been posted at the top of the white portion of the Premium Membership Homepage (click here). We recommend checking your system by logging in 15 minutes early to confirm that your web browser is properly equipped to view the presentation. You may take advantage of the SPRING SPECIAL to reactivate an expired membership, start a new membership, or upgrade from your free membership level so you can access this informative webcast.
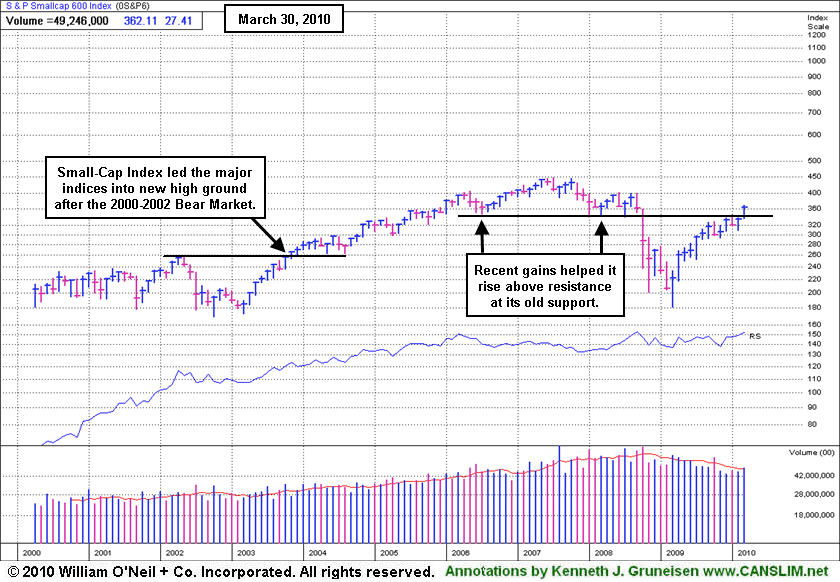
PICTURED: The S&P 600 Small Cap Index has recently been rallying up through resistance at an old floor of support, which is an encouraging sign of ongoing strength in the area of the market where we are most focused on new buy candidates under this investment system's guidelines. The monthly chart above illustrates how the Small-Cap Index also led the major averages in the recovery following the 2000-2002 Bear Market. It actually made it into new high ground before the end of 2003, and rallied into new high ground for 4 more years. In contrast, the benchmark S&P 500 Index (not shown) barely made it above its 2000 high in October 2007, then another Bear Market began.
|
|
|
 |
Mixed Group Action Limits Major Averages' Progress
Kenneth J. Gruneisen - Passed the CAN SLIM® Master's Exam
The Healthcare Index ($HMO +0.70%) was among Tuesday's best gainers, but mixed action limited the major averages' progress. Energy-related shares posted small gains and lifted the Integrated Oil Index ($XOI +0.28%) and Oil Services Index ($OSX +0.32%) for modest gains. The tech sector showed mixed action and was mostly indecisive as the Internet Index ($IIX +0.37%) and Semiconductor Index ($SOX +0.69%) posted small gains while the Networking Index ($NWX -0.10%) and Biotechnology Index ($BTK -0.14%) edged lower. The Broker/Dealer Index ($XBD +0.03%) and Retail Index ($RLX +0.10%) eked out tiny gains. Meanwhile, the Bank Index ($BKX -0.81%) and Gold & Silver Index ($XAU -0.50%) were among the session's laggard groups.
Charts courtesy www.stockcharts.com
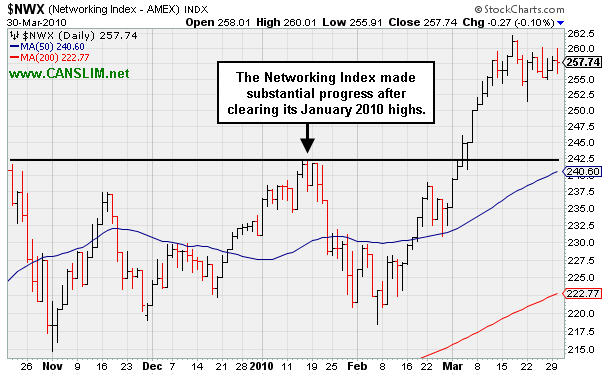
PICTURED: The Networking Index made substantial progress after clearing its January 2010 highs.
| Oil Services |
$OSX |
203.75 |
+0.65 |
+0.32% |
+4.53% |
| Healthcare |
$HMO |
1,586.20 |
+10.98 |
+0.70% |
+7.69% |
| Integrated Oil |
$XOI |
1,076.26 |
+3.04 |
+0.28% |
+0.75% |
| Semiconductor |
$SOX |
368.90 |
+2.53 |
+0.69% |
+2.50% |
| Networking |
$NWX |
257.73 |
-0.27 |
-0.10% |
+11.54% |
| Internet |
$IIX |
249.29 |
+0.93 |
+0.37% |
+6.60% |
| Broker/Dealer |
$XBD |
117.77 |
+0.04 |
+0.03% |
+2.36% |
| Retail |
$RLX |
453.52 |
+0.46 |
+0.10% |
+10.31% |
| Gold & Silver |
$XAU |
163.72 |
-0.82 |
-0.50% |
-2.69% |
| Bank |
$BKX |
51.75 |
-0.42 |
-0.81% |
+21.17% |
| Biotech |
$BTK |
1,241.20 |
-1.78 |
-0.14% |
+31.74% |
|
|
|
 |
New High Close With Today's Gain On Light Volume
Kenneth J. Gruneisen - Passed the CAN SLIM® Master's Exam
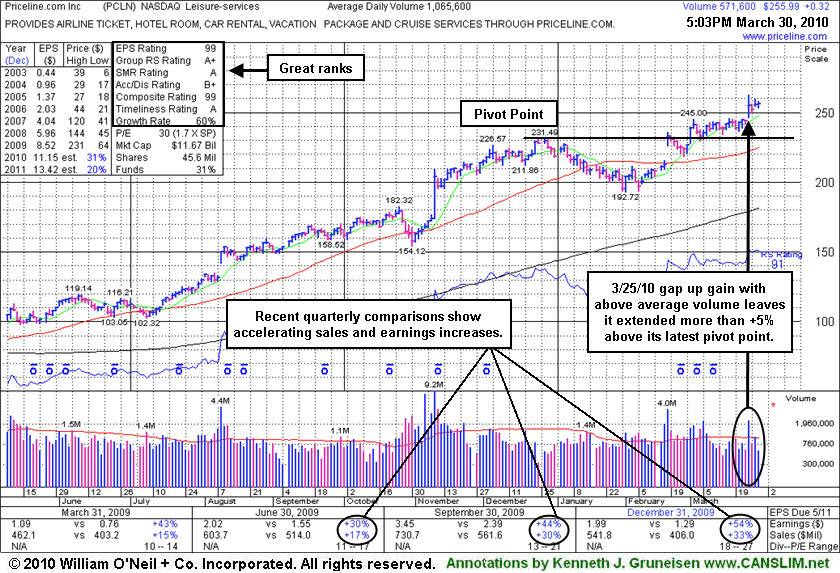
Priceline.com Inc. (PCLN +$0.32 or +0.13% to $255.99) posted a small gain today on light volume for a new high close. Its considerable gap up on 3/25/10 for a solid gain was backed by more than 2 times average volume, leaving this high-ranked Leisure-Services firm extended more than +5% above its latest pivot point. It has no resistance remaining due to overhead supply and can easily rise unhindered, but disciplined investors avoid chasing stocks outside of the investment system's guidelines. Its color code was changed to green after getting extended from its latest sound base pattern. Meanwhile, prior chart highs in the $245-246 area define an initial support level to watch above its earlier highs and its 50-day moving average (DMA) line.
PCLN previously appeared in this FSU section on 2/18/10 under the headline "Big Gap Up Gain On 4 Times Average Volume" when triggering a technical buy signal while rising from a 9-week base. It was still color coded yellow on 3/10/10 when it made a subsequent FSU section appearance under the headline "Priceline Remains Perched Near All-Time Highs Following Latest Breakout", but its color code was changed to green after blasting above its "max buy" level.
In the most current (C criteria) quarter ended December 31, 2009 its sales revenues and earnings showed impressive acceleration yet again with increases well above the +25% minimum guideline. A summary of CANSLIM.net's past coverage and the stock's subsequent action was published on 11/07/08 under the headline "Multiple Sell Signals Preceded Big Price Decline." That write-up explained the stock's weak action after it had been dropped from the Featured Stocks list after its 200 DMA violation on July 2, 2008. PCLN was first featured on Friday, November 09, 2007 in the CANSLIM.net Mid Day Breakouts Report after gapping up over the $100 threshold (read here).
|
|
|
Color Codes Explained :
Y - Better candidates highlighted by our
staff of experts.
G - Previously featured
in past reports as yellow but may no longer be buyable under the
guidelines.
***Last / Change / Volume quote data in this table corresponds with the timestamp on the note***
Symbol/Exchange
Company Name
Industry Group |
Last |
Chg. |
Vol
% DAV |
Date Featured |
Price Featured |
Latest Pivot Point
Featured |
Status |
| Latest Max Buy Price |
ARUN
- NASDAQ
Aruba Networks Inc
COMPUTER HARDWARE - Networking & Communication Dev
|
$13.57
|
+0.26
|
1,252,604
80% DAV
1,556,100
|
2/19/2010
(Date
Featured) |
$12.71
(Price
Featured) |
PP = $11.94 |
G |
| MB = $12.54 |
Most Recent Note - 3/30/2010 4:12:08 PM
G - Rallied today on light volume for its 4th consecutive gain and a new 52-week high. Support to watch is defined by prior chart highs and its 50 DMA line in the upper $11 area.
>>> The latest Featured Stock Update with an annotated graph appeared on 3/11/2010. click here.
|
|
C
A
S
I |
News |
Chart |
SEC
View all notes Alert
me of new notes
Company
Profile
|
BIDU
- NASDAQ
Baidu Inc Ads
INTERNET - Internet Information Providers
|
$598.20
|
-5.30
|
938,357
48% DAV
1,969,300
|
1/13/2010
(Date
Featured) |
$431.25
(Price
Featured) |
PP = $426.75 |
G |
| MB = $448.09 |
Most Recent Note - 3/30/2010 4:12:58 PM
G - It is still quietly hovering near all-time highs. As recently noted, "It is extended from any sound base now. An upward trendline connecting its January-March lows is an initial chart support level to watch, where a subsequent violation may prompt investors to lock in gains."
>>> The latest Featured Stock Update with an annotated graph appeared on 3/24/2010. click here.
|
|
C
A
S
I |
News |
Chart |
SEC
View all notes Alert
me of new notes
Company
Profile
|
BRLI
- NASDAQ
Bio Reference Labs Inc
HEALTH SERVICES - Medical Laboratories & Researc
|
$44.16
|
+0.23
|
55,845
57% DAV
98,200
|
2/12/2010
(Date
Featured) |
$39.02
(Price
Featured) |
PP = $40.97 |
G |
| MB = $43.02 |
Most Recent Note - 3/30/2010 4:20:54 PM
G - Posted a 3rd consecutive gain today while consolidating above its "max buy" level, its color code was changed to green. Prior chart highs and its 50 DMA line coincide in the $40 area, defining important support to watch.
>>> The latest Featured Stock Update with an annotated graph appeared on 3/22/2010. click here.
|
|
C
A
S
I |
News |
Chart |
SEC
View all notes Alert
me of new notes
Company
Profile
|
CISG
- NASDAQ
Cninsure Inc Ads
INSURANCE - Insurance Brokers
|
$26.93
|
+0.29
|
172,129
75% DAV
229,100
|
3/3/2010
(Date
Featured) |
$24.38
(Price
Featured) |
PP = $23.10 |
G |
| MB = $24.26 |
Most Recent Note - 3/30/2010 4:21:56 PM
G - Holding its ground in a tight trading range perched near its 52-week high since its considerable gain on 3/23/10 with 3 times average volume. Extended from a sound base, yet no overhead supply remains to act as resistance. It rose from a 20-week double bottom base with 8 times average volume as it was featured in the 3/03/10 mid-day report (read here).
>>> The latest Featured Stock Update with an annotated graph appeared on 3/23/2010. click here.
|
|
C
A
S
I |
News |
Chart |
SEC
View all notes Alert
me of new notes
Company
Profile
|
CRM
- NYSE
Salesforce.com Inc
INTERNET - Internet Software & Services
|
$75.41
|
+0.64
|
1,945,802
105% DAV
1,851,400
|
3/5/2010
(Date
Featured) |
$72.28
(Price
Featured) |
PP = $75.53 |
Y |
| MB = $79.31 |
Most Recent Note - 3/30/2010 4:24:08 PM
Y - Gain today with average volume ended a streak of 5 consecutive small losses on lighter volume, closing -3.3% from its all-time high. A solid gain above its pivot point with at least +50% above average volume is required to trigger a technical buy signal.
>>> The latest Featured Stock Update with an annotated graph appeared on 3/25/2010. click here.
|
|
C
A
S
I |
News |
Chart |
SEC
View all notes Alert
me of new notes
Company
Profile
|
CTRP
- NASDAQ
Ctrip.com Intl Ltd Adr
LEISURE - Resorts & Casinos
|
$40.68
|
+0.29
|
1,897,326
86% DAV
2,211,500
|
3/25/2010
(Date
Featured) |
$40.74
(Price
Featured) |
PP = $39.40 |
Y |
| MB = $41.37 |
Most Recent Note - 3/30/2010 4:25:32 PM
Y - Gain today on near average volume for its best close ever. Its 3/25/10 gain for a new 52-week high with +81% above average volume triggered a technical buy signal. Recently found prompt support near its 50 DMA line. A detailed new Stock Bulletin with annotated graphs and expert analysis was published on 3/25/10 (read here).
>>> The latest Featured Stock Update with an annotated graph appeared on 3/25/2010. click here.
|
|
C
A
S
I |
News |
Chart |
SEC
View all notes Alert
me of new notes
Company
Profile
|
EZPW
- NASDAQ
Ezcorp Inc Cl A
SPECIALTY RETAIL - Specialty Retail, Other
|
$20.79
|
-0.43
|
381,321
70% DAV
544,500
|
2/19/2010
(Date
Featured) |
$19.03
(Price
Featured) |
PP = $18.80 |
G |
| MB = $19.74 |
Most Recent Note - 3/30/2010 4:34:07 PM
G - High-ranked Finance - Consumer/Commercial Loans firm is still quietly consolidating above its 50 DMA line and its recent chart low ($19.73 on 3/16/10) which define near-term support.
>>> The latest Featured Stock Update with an annotated graph appeared on 3/29/2010. click here.
|
|
C
A
S
I |
News |
Chart |
SEC
View all notes Alert
me of new notes
Company
Profile
|
GMCR
- NASDAQ
Green Mtn Coffee Roastrs
FOOD & BEVERAGE - Processed & Packaged Goods
|
$93.86
|
-0.15
|
475,560
38% DAV
1,246,700
|
2/26/2010
(Date
Featured) |
$84.39
(Price
Featured) |
PP = $88.75 |
G |
| MB = $93.19 |
Most Recent Note - 3/30/2010 4:36:00 PM
G - Quietly consolidating less than -5% from its all-time high. Color code was changed to green after rising above the previously cited "max buy" level. Its high volume gain on 3/08/10 triggered the latest technical buy signal. Initial support to watch is at prior chart highs and its 50 DMA line in the $86-88 area.
>>> The latest Featured Stock Update with an annotated graph appeared on 3/12/2010. click here.
|
|
C
A
S
I |
News |
Chart |
SEC
View all notes Alert
me of new notes
Company
Profile
|
ISRG
- NASDAQ
Intuitive Surgical Inc
HEALTH SERVICES - Medical Appliances & Equipment
|
$348.91
|
+1.12
|
369,341
69% DAV
532,300
|
1/22/2010
(Date
Featured) |
$340.40
(Price
Featured) |
PP = $314.00 |
G |
| MB = $329.70 |
Most Recent Note - 3/30/2010 4:37:09 PM
G - Posted a small gain today, making a stand near prior chart highs ($346) and its 50 DMA line - important support levels to watch. As previously repeated in notes, it did not trigger a technical buy signal in recent weeks.
>>> The latest Featured Stock Update with an annotated graph appeared on 3/16/2010. click here.
|
|
C
A
S
I |
News |
Chart |
SEC
View all notes Alert
me of new notes
Company
Profile
|
PCLN
- NASDAQ
Priceline.com Inc
INTERNET - Internet Software & Services
|
$399.55
|
-4.72
|
584,812
N/A
|
11/1/2002
(Date
Featured) |
$399.55
(Price
Featured) |
PP = $428.20 |
Y |
| MB = $449.61 |
Most Recent Note - 1/2/2011
Y - Returns to Featured Stocks list with its appearance in the January 2011 CANSLIM.net News including detailed analysis and annotated daily and weekly graphs.
>>> The latest Featured Stock Update with an annotated graph appeared on 3/30/2010. click here.
|
|
C
A
S
I |
News |
Chart |
SEC
View all notes Alert
me of new notes
Company
Profile
|
PEGA
- NASDAQ
Pegasystems Inc
COMPUTER SOFTWARE & SERVICES - Business Software & Services
|
$37.31
|
-0.30
|
160,219
75% DAV
213,400
|
2/26/2010
(Date
Featured) |
$36.00
(Price
Featured) |
PP = $38.55 |
Y |
| MB = $40.48 |
Most Recent Note - 3/30/2010 4:39:16 PM
Y - Today marked its 5th consecutive small loss with below average volume. Volume totals have cooled while it has hovered in a tight range near all-time highs, but it has failed to follow through with confirming gains since its considerable gap up gain on 3/15/10 triggered a technical buy signal. Prior chart highs near $37-38 are initial chart support above its 50 DMA line.
>>> The latest Featured Stock Update with an annotated graph appeared on 3/15/2010. click here.
|
|
C
A
S
I |
News |
Chart |
SEC
View all notes Alert
me of new notes
Company
Profile
|
ROVI
- NASDAQ
Rovi Corp
COMPUTER SOFTWARE & SERVICES - Security Software & Services
|
$37.26
|
-0.02
|
781,017
57% DAV
1,379,100
|
2/25/2010
(Date
Featured) |
$33.54
(Price
Featured) |
PP = $34.87 |
G |
| MB = $36.61 |
Most Recent Note - 3/30/2010 4:40:15 PM
G - Posted a 5th consecutive small loss today on light volume, perched -3.2% from its all-time high. It is slightly extended from its latest base, while prior chart highs in the $34 area define an important support level to watch on pullbacks.
>>> The latest Featured Stock Update with an annotated graph appeared on 3/17/2010. click here.
|
|
C
A
S
I |
News |
Chart |
SEC
View all notes Alert
me of new notes
Company
Profile
|
SIRO
- NASDAQ
Sirona Dental Systems
HEALTH SERVICES - Medical Instruments & Supplies
|
$37.96
|
-0.19
|
360,419
61% DAV
588,400
|
2/16/2010
(Date
Featured) |
$36.43
(Price
Featured) |
PP = $36.15 |
G |
| MB = $37.96 |
Most Recent Note - 3/30/2010 4:42:12 PM
G - Hit a new 52-week high then reversed its early gain for a small loss today on light volume, closing at its "max buy" level. Color code was changed to green. Prior chart highs and its 50 DMA line in the $35-36 area define important support to watch.
>>> The latest Featured Stock Update with an annotated graph appeared on 3/26/2010. click here.
|
|
C
A
S
I |
News |
Chart |
SEC
View all notes Alert
me of new notes
Company
Profile
|
ULTA
- NASDAQ
Ulta Salon Cosm & Frag
SPECIALTY RETAIL - Specialty Retail, Other
|
$23.21
|
+0.40
|
333,472
90% DAV
370,500
|
3/12/2010
(Date
Featured) |
$22.81
(Price
Featured) |
PP = $21.72 |
G |
| MB = $22.81 |
Most Recent Note - 3/30/2010 4:42:57 PM
G - Gain today with average volume, wedging further above its "max buy" level. Color code was changed to green. A detailed Stock Bulletin with annotated graph was published soon after it was featured in the 3/12/10 mid-day report.
>>> The latest Featured Stock Update with an annotated graph appeared on 3/12/2010. click here.
|
|
C
A
S
I |
News |
Chart |
SEC
View all notes Alert
me of new notes
Company
Profile
|
VPRT
- NASDAQ
Vistaprint Nv
DIVERSIFIED SERVICES - Business/Management Services
|
$57.22
|
+0.06
|
969,022
225% DAV
431,300
|
3/1/2010
(Date
Featured) |
$57.72
(Price
Featured) |
PP = $59.70 |
G |
| MB = $62.69 |
Most Recent Note - 3/30/2010 4:46:31 PM
G - Found support and rebounded from early losses today for a positive reversal, closing near the session high and near its 50 DMA line. Weak action recently raised concerns and its color code was changed to green. It did not trigger a technical buy signal since it was featured in the March 2010 CANSLIM.net News monthly newsletter (read here). As previously noted, "Its gain on 3/02/10 was below the volume guidelines for buyable breakouts under the investment system."
>>> The latest Featured Stock Update with an annotated graph appeared on 3/19/2010. click here.
|
|
C
A
S
I |
News |
Chart |
SEC
View all notes Alert
me of new notes
Company
Profile
|
|
 |
|
| Subscriber Questions: |
March 24, 2010 |
Ken,
I would like to complement Ken on a great job with his presentation last night to the San Diego Investor Meetup group. Due to time restrictions I was unable to ask the following questions: Do all your yellow featured stocks meet the C & A CANSLIM investment guidelines? Is this why Atheros is not a featured stock? How would you best use the month end Market Groups breakout list? What stocks do you include in the Biotech, Banking, etc industry groups? I am an existing subscriber and plan on renewing my membership. Thanks again for providing an excellent product/service adhering to the CANSLIM guidelines.
Gil |
| Ken's Response: |
March 29, 2010 |
Dear Gil,
Thanks for the positive feedback on my 3/23/10 presentation in San Diego, and thanks for some great questions! Please accept my apology for the delay in responding. Here are the answers you have been awaiting.
1. Do all your yellow featured stocks meet the C & A CANSLIM investment guidelines?
As a general rule you should find this to be so for stocks on the Featured Stocks page, however in any instances where there may be any shortcomings, we typically do add notes to shed sufficient light on the companies' earnings history. Along with the notes from our experts, annotated graphs should also allow you to see the critical information concerning the companies' sales and earnings track record to adequately assess the facts.
2. Why is Atheros (ATHR) not a featured stock?
It has made 3 Mid-Day Breakouts Report appearances in 2010. Hopefully the most recent note from its 3/03/2010 appearance will help to answer well enough. "It has reversed today's early gain into new all-time high territory following its 3/02/10 breakout from a cup-with-handle pattern with heavy volume. Quarterly sales and earnings comparisons in prior quarters have been negative and below guidelines, yet it showed a dramatic turnaround and huge increases for the period ended Dec 31, 2009. It has a good annual earnings (A criteria) history."
3. How would you best use the month end Market Groups breakout list?
The Market's Leading Groups section in each monthly issue of CANSLIM.net News summarizes the total appearances of stocks that hit new 52-week highs and appeared on the Breakouts Page. You can use this to get a view of the industry groups that have produced the greatest preponderance of stocks hitting new highs in the past month. Industry groups should be weighed into the mix when it comes to your buying decisions on individual stocks, since investors' odds are considered most favorable when choosing leading stocks in leading industry groups (the L criteria).
4. What stocks do you include in the Biotech, Banking, etc industry groups?
The updated version of the Leaders List, which is now sortable but clicking on the column headings, does not currently allow members to sort the entire leaders list by industry groups. The Leaders List Screening Tool is also undergoing a redesign at present. However, your question is a VERY good reason for me to work with the programming team to get that feature (sort Leaders List by Industry Groups) reincorporated in the very near term. Please be patient, and my hope is that with a few days we can roll out a solution which will make this easier for you and everyone else.
Thanks again for your patronage. This response will be published in the "Mail Bag - Q&A" section which is occasionally inserted into the daily After Market Update.
Please let me know if you have any other feedback by filling out the inquiry form.

Kenneth J. Gruneisen
Founder & Contributing Writer for CANSLIM.net
www.canslim.net |
|
|
|
THESE ARE NOT BUY RECOMMENDATIONS!
Comments contained in the body of this report are technical
opinions only. The material herein has been obtained
from sources believed to be reliable and accurate, however,
its accuracy and completeness cannot be guaranteed.
This site is not an investment advisor, hence it does
not endorse or recommend any securities or other investments.
Any recommendation contained in this report may not
be suitable for all investors and it is not to be deemed
an offer or solicitation on our part with respect to
the purchase or sale of any securities. All trademarks,
service marks and trade names appearing in this report
are the property of their respective owners, and are
likewise used for identification purposes only.
This report is a service available
only to active Paid Premium Members.
You may opt-out of receiving report notifications
at any time. Questions or comments may be submitted
by writing to Premium Membership Services 665 S.E. 10 Street, Suite 201 Deerfield Beach, FL 33441-5634 or by calling 1-800-965-8307
or 954-785-1121.
|
|
|


