***Last / Change / Volume data in this table is the closing quote data***
Symbol/Exchange
Company Name
Industry Group |
PRICE |
CHANGE
(%Change) |
Day High |
Volume
(% DAV)
(% 50 day avg vol) |
52 Wk Hi
% From Hi |
Featured
Date |
Price
Featured |
Pivot Featured |
|
Max Buy |
ACN
-
NYSE
Accenture Plc
DIVERSIFIED SERVICES - Business/Management Services
|
$64.50
|
+0.00
0.00% |
$64.61
|
2,427,933
69.47% of 50 DAV
50 DAV is 3,494,700
|
$65.89
-2.11%
|
3/23/2012
|
$64.13
|
PP = $63.76
|
|
MB = $66.95
|
Most Recent Note - 3/28/2012 6:01:25 PM
Y - Pulled back today on lighter (near average) volume. Featured in yellow in the 3/23/12 mid-day report (read here) with a pivot point cited based on its 7/07/11 high plus 10 cents, and its convincing volume-driven gain above the pivot point was backed by +88% above average volume as it triggered a new (or add-on) technical buy signal.
>>> The latest Featured Stock Update with an annotated graph appeared on 3/23/2012. Click here.
View all notes |
Alert me of new notes |
CANSLIM.net Company Profile |
SEC |
Zacks Reports |
StockTalk |
News |
Chart |
Request a new note
C
A N
S L
I M


|
ADS
-
NYSE
Alliance Data Sys Corp
COMPUTER SOFTWARE and SERVICES - Information and Delivery Service
|
$125.94
|
+1.31
1.05% |
$126.98
|
696,864
111.43% of 50 DAV
50 DAV is 625,400
|
$127.09
-0.90%
|
1/17/2012
|
$108.24
|
PP = $107.43
|
|
MB = $112.80
|
Most Recent Note - 3/28/2012 11:18:18 AM
G - Holding its ground stubbornly near its all-time high, still extended from any sound base pattern. Fundamental concerns were raised by earnings reported +9%, well below the +25% minimum guideline in the latest quarter ended December 31, 2011.
>>> The latest Featured Stock Update with an annotated graph appeared on 2/29/2012. Click here.
View all notes |
Alert me of new notes |
CANSLIM.net Company Profile |
SEC |
Zacks Reports |
StockTalk |
News |
Chart |
Request a new note
C
A N
S L
I M
|
ALLT
-
NASDAQ
Allot Communications Ltd
COMPUTER SOFTWARE andamp; SERVICES - Technical andamp; System Software
|
$22.93
|
+0.77
3.47% |
$23.05
|
586,715
152.95% of 50 DAV
50 DAV is 383,600
|
$23.30
-1.59%
|
3/13/2012
|
$19.72
|
PP = $18.91
|
|
MB = $19.86
|
 Most Recent Note - 3/29/2012 12:20:11 PM
G - Holding its ground today following an outside "negative reversal" on the prior session for a loss on above average volume after touching a new 52-week high. Prior highs near $18-19 define initial support to watch on pullbacks.
>>> The latest Featured Stock Update with an annotated graph appeared on 3/19/2012. Click here.
View all notes |
Alert me of new notes |
CANSLIM.net Company Profile |
SEC |
Zacks Reports |
StockTalk |
News |
Chart |
Request a new note
C
A N
S L
I M
|
ALXN
-
NASDAQ
Alexion Pharmaceuticals
DRUGS - Drug Manufacturers - Other
|
$91.26
|
+1.04
1.15% |
$91.50
|
1,514,665
115.31% of 50 DAV
50 DAV is 1,313,600
|
$95.01
-3.95%
|
3/12/2012
|
$87.87
|
PP = $87.73
|
|
MB = $92.12
|
Most Recent Note - 3/28/2012 11:53:46 AM
G - Pulling back today with above average volume, enduring distributional pressure after inching to a new all-time high on Monday. Support to watch is at its 50 DMA line ($82.97).
>>> The latest Featured Stock Update with an annotated graph appeared on 2/24/2012. Click here.
View all notes |
Alert me of new notes |
CANSLIM.net Company Profile |
SEC |
Zacks Reports |
StockTalk |
News |
Chart |
Request a new note
C
A N
S L
I M
|
BODY
-
NASDAQ
Body Central Corp
RETAIL - Catalog andamp; Mail Order Houses
|
$28.05
|
-0.31
-1.09% |
$28.20
|
86,495
40.16% of 50 DAV
50 DAV is 215,400
|
$29.49
-4.88%
|
1/27/2012
|
$26.69
|
PP = $25.46
|
|
MB = $26.73
|
Most Recent Note - 3/28/2012 5:23:01 PM
G - Posted another gain today on light volume, rising from support at its 50 DMA line and prior highs in the $26 area. Subsequent damaging losses may trigger a more worrisome technical sell signal.
>>> The latest Featured Stock Update with an annotated graph appeared on 3/13/2012. Click here.
View all notes |
Alert me of new notes |
CANSLIM.net Company Profile |
SEC |
Zacks Reports |
StockTalk |
News |
Chart |
Request a new note
C
A N
S L
I M
|
Symbol/Exchange
Company Name
Industry Group |
PRICE |
CHANGE
(%Change) |
Day High |
Volume
(% DAV)
(% 50 day avg vol) |
52 Wk Hi
% From Hi |
Featured
Date |
Price
Featured |
Pivot Featured |
|
Max Buy |
CDNS
-
NASDAQ
Cadence Design Systems
COMPUTER SOFTWARE and SERVICES - Technical and System Software
|
$11.89
|
-0.20
-1.65% |
$12.05
|
3,127,075
92.23% of 50 DAV
50 DAV is 3,390,700
|
$12.60
-5.63%
|
2/3/2012
|
$11.66
|
PP = $11.15
|
|
MB = $11.71
|
Most Recent Note - 3/28/2012 11:21:52 AM
G - Volume totals have been cooling while holding its ground and consolidating near its 52-week high. Prior highs and its 50 DMA line define support to watch on pullbacks.
>>> The latest Featured Stock Update with an annotated graph appeared on 3/28/2012. Click here.
View all notes |
Alert me of new notes |
CANSLIM.net Company Profile |
SEC |
Zacks Reports |
StockTalk |
News |
Chart |
Request a new note
C
A N
S L
I M
|
CELG
-
NASDAQ
Celgene Corp
DRUGS - Drug Manufacturers - Major
|
$77.52
|
-0.42
-0.53% |
$78.20
|
2,066,660
71.96% of 50 DAV
50 DAV is 2,871,800
|
$78.83
-1.66%
|
2/2/2012
|
$74.16
|
PP = $75.21
|
|
MB = $78.97
|
Most Recent Note - 3/26/2012 10:11:25 PM
Y - Hit a new 52-week high today and rallied above its all-time high ($77.39 in Aug '08) with a 5th consecutive gain. The winning streak into new high territory is impressive, however to trigger a proper technical buy signal the volume behind a gain must be at least +40-50% above average, preferably greater, as a truly reassuring sign of great institutional demand capable of leading to a sustainable and meaningful price advance. Found support at its 50 DMA line on the last pullback, meanwhile any damaging violation would raise concerns and trigger technical sell signals. See the latest FSU analysis for more details and a new annotated graph.
>>> The latest Featured Stock Update with an annotated graph appeared on 3/26/2012. Click here.
View all notes |
Alert me of new notes |
CANSLIM.net Company Profile |
SEC |
Zacks Reports |
StockTalk |
News |
Chart |
Request a new note
C
A N
S L
I M
|
COO
-
NYSE
Cooper Companies Inc
HEALTH SERVICES - Medical Instruments and Supplies
|
$81.25
|
+0.82
1.02% |
$81.87
|
467,991
121.21% of 50 DAV
50 DAV is 386,100
|
$84.20
-3.50%
|
3/9/2012
|
$83.05
|
PP = $81.02
|
|
MB = $85.07
|
Most Recent Note - 3/28/2012 11:26:47 AM
G - Volume totals have been cooling while consolidating following its 3/09/12 gap up and new high. It is still perched only -4.9% off its 52-week high with little resistance remaining, however its Relative Strength rating has slumped to a mediocre 59, below the 80+ guideline for buy candidates, while sputtering back below the pivot point. Confirming gains with above average volume for additional new high closes would help its outlook.
>>> The latest Featured Stock Update with an annotated graph appeared on 3/9/2012. Click here.
View all notes |
Alert me of new notes |
CANSLIM.net Company Profile |
SEC |
Zacks Reports |
StockTalk |
News |
Chart |
Request a new note
C
A N
S L
I M
|
DISH
-
NASDAQ
Dish Network Corp Cl A
CONSUMER DURABLES - Electronic Equipment
|
$32.56
|
+0.09
0.28% |
$32.59
|
1,250,541
45.83% of 50 DAV
50 DAV is 2,728,800
|
$35.64
-8.64%
|
3/7/2012
|
$30.83
|
PP = $30.10
|
|
MB = $31.61
|
Most Recent Note - 3/28/2012 6:03:31 PM
G - Reversed into the red after early gains today. Consolidating above prior highs since blasting higher on 3/22/12 with heavy volume following news the FCC is maneuvering its rules in a way viewed as favorable for the company. Prior highs in the $30 area define initial support to watch on pullbacks.
>>> The latest Featured Stock Update with an annotated graph appeared on 3/14/2012. Click here.
View all notes |
Alert me of new notes |
CANSLIM.net Company Profile |
SEC |
Zacks Reports |
StockTalk |
News |
Chart |
Request a new note
C
A N
S L
I M
|
FEIC
-
NASDAQ
F E I Co
ELECTRONICS - Diversified Electronics
|
$48.92
|
+0.10
0.20% |
$49.07
|
187,216
59.04% of 50 DAV
50 DAV is 317,100
|
$49.75
-1.67%
|
12/7/2011
|
$41.41
|
PP = $42.35
|
|
MB = $44.47
|
Most Recent Note - 3/26/2012 1:32:46 PM
G - Hitting a new 52-week high today with above average volume behind a 2nd consecutive gain while no resistance remains to hinder its progress. The latest quarterly report showed +21% earnings for the Dec '11 quarter, below the +25% minimum guideline for earnings growth.
>>> The latest Featured Stock Update with an annotated graph appeared on 3/12/2012. Click here.
View all notes |
Alert me of new notes |
CANSLIM.net Company Profile |
SEC |
Zacks Reports |
StockTalk |
News |
Chart |
Request a new note
C
A N
S L
I M
|
Symbol/Exchange
Company Name
Industry Group |
PRICE |
CHANGE
(%Change) |
Day High |
Volume
(% DAV)
(% 50 day avg vol) |
52 Wk Hi
% From Hi |
Featured
Date |
Price
Featured |
Pivot Featured |
|
Max Buy |
GNC
-
NYSE
G N C Holdings Inc
RETAIL - Drug Stores
|
$34.64
|
-0.21
-0.60% |
$34.85
|
842,834
54.99% of 50 DAV
50 DAV is 1,532,700
|
$35.10
-1.31%
|
1/19/2012
|
$28.99
|
PP = $29.60
|
|
MB = $31.08
|
Most Recent Note - 3/28/2012 11:31:35 AM
G - Recent low ($30.75 on 3/07/12) and its 50 DMA line define near-term chart support to watch on pullbacks. Steadily inched to new highs since a considerable gap up gain on 3/13/12 after raising guidance based on stronger same store sales than previously expected. It completed Secondary Offerings on 10/25/11 and 3/13/12 after making steady progress following its 4/01/11 IPO.
>>> The latest Featured Stock Update with an annotated graph appeared on 3/5/2012. Click here.
View all notes |
Alert me of new notes |
CANSLIM.net Company Profile |
SEC |
Zacks Reports |
StockTalk |
News |
Chart |
Request a new note
C
A N
S L
I M
|
HLF
-
NYSE
Herbalife Ltd
DRUGS - Nutrition and Weight Management
|
$69.27
|
-0.90
-1.28% |
$70.00
|
1,149,485
86.62% of 50 DAV
50 DAV is 1,327,000
|
$72.11
-3.94%
|
2/22/2012
|
$65.90
|
PP = $63.50
|
|
MB = $66.68
|
Most Recent Note - 3/28/2012 11:33:28 AM
G - Hovering near its all-time high, stubbornly holding its ground after getting extended from its prior base pattern. Prior highs in the $63 area define support to watch on pullbacks.
>>> The latest Featured Stock Update with an annotated graph appeared on 2/22/2012. Click here.
View all notes |
Alert me of new notes |
CANSLIM.net Company Profile |
SEC |
Zacks Reports |
StockTalk |
News |
Chart |
Request a new note
C
A N
S L
I M
|
ISRG
-
NASDAQ
Intuitive Surgical Inc
HEALTH SERVICES - Medical Appliances and Equipment
|
$543.68
|
-0.95
-0.17% |
$549.22
|
260,137
77.49% of 50 DAV
50 DAV is 335,700
|
$550.47
-1.23%
|
12/20/2011
|
$442.43
|
PP = $449.16
|
|
MB = $471.62
|
Most Recent Note - 3/28/2012 11:36:17 AM
G - Stubbornly holding its ground and rising since last noted, getting more extended from any sound base pattern. Previously noted - "The December '11 quarterly earnings increased by just below the borderline +25% minimum guideline for ideal buy candidates. Rather than compromise, disciplined investors may sooner consider another Featured Stock when a fresh technical buy signal occurs."
>>> The latest Featured Stock Update with an annotated graph appeared on 3/1/2012. Click here.
View all notes |
Alert me of new notes |
CANSLIM.net Company Profile |
SEC |
Zacks Reports |
StockTalk |
News |
Chart |
Request a new note
C
A N
S L
I M
|
LULU
-
NASDAQ
Lululemon Athletica
MANUFACTURING - Textile Manufacturing
|
$73.15
|
-0.17
-0.23% |
$73.49
|
1,556,151
76.19% of 50 DAV
50 DAV is 2,042,400
|
$76.66
-4.58%
|
1/10/2012
|
$60.97
|
PP = $59.46
|
|
MB = $62.43
|
Most Recent Note - 3/28/2012 5:16:48 PM
G - Retreating from its all-time high with today's 4th consecutive small loss. It is extended from any sound base. An upward trendline connecting January-March lows defines initial near-term chart support to watch above its 50 DMA line ($67.54).
>>> The latest Featured Stock Update with an annotated graph appeared on 2/21/2012. Click here.
View all notes |
Alert me of new notes |
CANSLIM.net Company Profile |
SEC |
Zacks Reports |
StockTalk |
News |
Chart |
Request a new note
C
A N
S L
I M
|
MA
-
NYSE
Mastercard Inc Cl A
DIVERSIFIED SERVICES - Business/Management Services
|
$428.22
|
+0.70
0.16% |
$428.32
|
508,584
52.63% of 50 DAV
50 DAV is 966,300
|
$437.56
-2.13%
|
3/12/2012
|
$419.86
|
PP = $428.67
|
|
MB = $450.10
|
Most Recent Note - 3/26/2012 10:32:35 PM
Y - Volume was near average as its rose above its pivot point today. Volume-driven gains are needed to clinch a proper new (or add-on) technical buy signal. Its 50 DMA line defines near-term support to watch.
>>> The latest Featured Stock Update with an annotated graph appeared on 2/17/2012. Click here.
View all notes |
Alert me of new notes |
CANSLIM.net Company Profile |
SEC |
Zacks Reports |
StockTalk |
News |
Chart |
Request a new note
C
A N
S L
I M
|
Symbol/Exchange
Company Name
Industry Group |
PRICE |
CHANGE
(%Change) |
Day High |
Volume
(% DAV)
(% 50 day avg vol) |
52 Wk Hi
% From Hi |
Featured
Date |
Price
Featured |
Pivot Featured |
|
Max Buy |
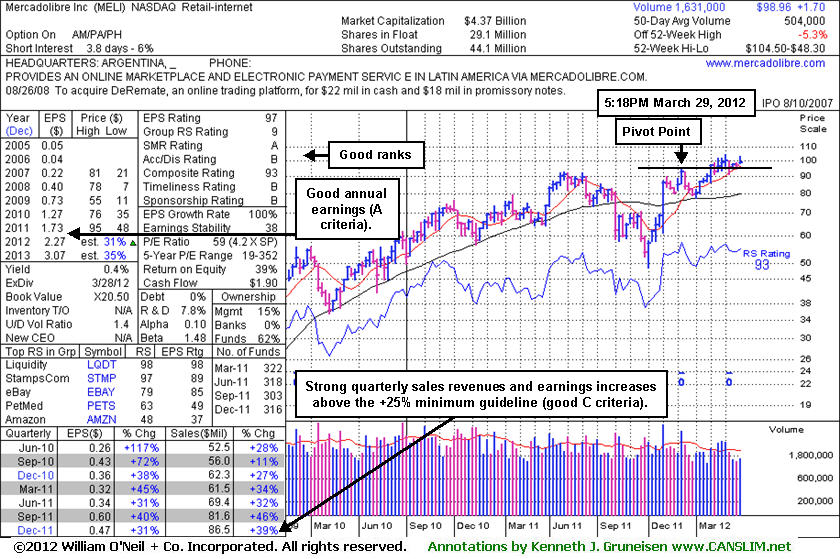
MELI
-
NASDAQ
Mercadolibre Inc
INTERNET - Internet Software and; Services
|
$98.96
|
-2.81
-2.76% |
$101.99
|
279,965
55.55% of 50 DAV
50 DAV is 504,000
|
$104.50
-5.30%
|
2/6/2012
|
$97.09
|
PP = $95.58
|
|
MB = $100.36
|
Most Recent Note - 3/29/2012 5:52:27 PM
Y - Color code is changed to yellow after slumping back below its "max buy" level with a loss today on light volume. Recently consolidating and staying above its 50 DMA line and above the recent low ($91.38 on 3/06/12) defining important support areas to watch. See the latest FSU analysis for more details and a new annotated weekly graph.
>>> The latest Featured Stock Update with an annotated graph appeared on 3/29/2012. Click here.
View all notes |
Alert me of new notes |
CANSLIM.net Company Profile |
SEC |
Zacks Reports |
StockTalk |
News |
Chart |
Request a new note
C
A N
S L
I M
|
MG
-
NYSE
Mistras Group Inc
DIVERSIFIED SERVICES - Bulding and Faci;ity Management Services
|
$24.29
|
-0.64
-2.57% |
$24.93
|
61,861
48.44% of 50 DAV
50 DAV is 127,700
|
$26.24
-7.43%
|
3/22/2012
|
$24.96
|
PP = $26.34
|
|
MB = $27.66
|
Most Recent Note - 3/28/2012 5:24:24 PM
Y - Up today for a 3rd consecutive gain on light volume, remaining below the new pivot point cited in the 3/22/12 mid-day report based on its 52-week high plus 10 cents after a 12-week base. It was previously noted - "Disciplined investors will watch for a volume-driven gain above the pivot to confirm a technical buy signal before taking any action. Found support well above its 200 DMA line and it has now rebounded to within -4.2% of its 52-week high. Fundamentals remain strong since it was dropped from the Featured Stocks list on 1/11/12. The number of top-rated funds owning its shares rose from 128 in Mar '11 to 185 in Dec '11, a reassuring sign concerning the I criteria."

>>> The latest Featured Stock Update with an annotated graph appeared on 1/6/2012. Click here.
View all notes |
Alert me of new notes |
CANSLIM.net Company Profile |
SEC |
Zacks Reports |
StockTalk |
News |
Chart |
Request a new note
C
A N
S L
I M
|
MKTX
-
NASDAQ
Marketaxess Holdings Inc
FINANCIAL SERVICES - Investment Brokerage - Nationa
|
$37.50
|
-0.29
-0.77% |
$37.61
|
203,012
73.77% of 50 DAV
50 DAV is 275,200
|
$37.81
-0.82%
|
3/8/2012
|
$35.80
|
PP = $35.52
|
|
MB = $37.30
|
Most Recent Note - 3/28/2012 5:27:04 PM
G - Finished near the session high with small gain today on average volume, touching a new all-time high. Color code is changed to green after rising above its "max buy" level. Its 50 DMA line defines important support to watch.
>>> The latest Featured Stock Update with an annotated graph appeared on 3/8/2012. Click here.
View all notes |
Alert me of new notes |
CANSLIM.net Company Profile |
SEC |
Zacks Reports |
StockTalk |
News |
Chart |
Request a new note
C
A N
S L
I M
|
NTES
-
NASDAQ
Netease.Com Inc Adr
INTERNET - Internet Information Providers
|
$58.34
|
-1.05
-1.77% |
$58.74
|
1,260,516
190.93% of 50 DAV
50 DAV is 660,200
|
$60.47
-3.52%
|
3/19/2012
|
$56.18
|
PP = $55.10
|
|
MB = $57.86
|
Most Recent Note - 3/29/2012 1:14:18 PM
G - Up from earlier lows after briefly trading below its "max buy" level, however it is pulling back today for a 3rd consecutive loss following a streak of 4 consecutive volume-driven gains. It is extended from its prior base. Its old highs in the $55 area define initial support to watch on pullbacks.
>>> The latest Featured Stock Update with an annotated graph appeared on 3/27/2012. Click here.
View all notes |
Alert me of new notes |
CANSLIM.net Company Profile |
SEC |
Zacks Reports |
StockTalk |
News |
Chart |
Request a new note
C
A N
S L
I M
|
RAX
-
NYSE
Rackspace Hosting Inc
INTERNET - Internet Software and; Services
|
$57.10
|
-0.63
-1.09% |
$57.67
|
1,749,088
83.50% of 50 DAV
50 DAV is 2,094,600
|
$59.43
-3.92%
|
2/2/2012
|
$46.69
|
PP = $45.55
|
|
MB = $47.83
|
Most Recent Note - 3/28/2012 6:05:19 PM
G - Down today with lighter than average volume. It recently wedged up to a new 52-week high with gains lacking great volume conviction, and the last consolidation was noted as a little short of the 5-week minimum length for it to be considered a new flat base pattern. Its 50 DMA line coincides with the prior low in the $49 area, defining an important near-term support level to watch.
>>> The latest Featured Stock Update with an annotated graph appeared on 2/16/2012. Click here.
View all notes |
Alert me of new notes |
CANSLIM.net Company Profile |
SEC |
Zacks Reports |
StockTalk |
News |
Chart |
Request a new note
C
A N
S L
I M
|
Symbol/Exchange
Company Name
Industry Group |
PRICE |
CHANGE
(%Change) |
Day High |
Volume
(% DAV)
(% 50 day avg vol) |
52 Wk Hi
% From Hi |
Featured
Date |
Price
Featured |
Pivot Featured |
|
Max Buy |
RGR
-
NYSE
Sturm Ruger & Co Inc
CONSUMER DURABLES - Sporting Goods
|
$48.35
|
+0.20
0.42% |
$48.55
|
324,787
108.33% of 50 DAV
50 DAV is 299,800
|
$50.72
-4.67%
|
3/22/2012
|
$46.49
|
PP = $46.78
|
|
MB = $49.12
|
Most Recent Note - 3/27/2012 5:01:24 PM
Y - Pulled back today after 3 consecutive volume-driven gains. It finished below its "max buy" level and the color code is changed to yellow again. Prior highs define initial support to watch on pullbacks toward its 50 DMA line.
>>> The latest Featured Stock Update with an annotated graph appeared on 3/22/2012. Click here.
View all notes |
Alert me of new notes |
CANSLIM.net Company Profile |
SEC |
Zacks Reports |
StockTalk |
News |
Chart |
Request a new note
C
A N
S L
I M
|
RRTS
-
NYSE
Roadrunner Trans Systems
TRANSPORTATION - Air Delivery and Freight Service
|
$17.52
|
-0.06
-0.34% |
$17.54
|
32,504
22.29% of 50 DAV
50 DAV is 145,800
|
$18.59
-5.76%
|
2/10/2012
|
$17.40
|
PP = $17.50
|
|
MB = $18.38
|
Most Recent Note - 3/26/2012 10:42:03 PM
Y - Second consecutive small gain today on light volume. It has been sputtering since a "negative reversal" on 3/16/12 for a loss on above average volume after touching a new 52-week high. A new pivot point was not cited, yet it has built a base-on-base pattern while consolidating above prior highs in the $17 area and above its 50 DMA line defining support to watch on pullbacks.
>>> The latest Featured Stock Update with an annotated graph appeared on 2/13/2012. Click here.
View all notes |
Alert me of new notes |
CANSLIM.net Company Profile |
SEC |
Zacks Reports |
StockTalk |
News |
Chart |
Request a new note
C
A N
S L
I M
|
SHFL
-
NASDAQ
Shuffle Master Inc
MANUFACTURING - Diversified Machinery
|
$17.19
|
-0.27
-1.55% |
$17.54
|
513,766
88.08% of 50 DAV
50 DAV is 583,300
|
$18.38
-6.47%
|
3/6/2012
|
$17.07
|
PP = $15.25
|
|
MB = $16.01
|
Most Recent Note - 3/28/2012 11:38:09 AM
G - Holding its ground stubbornly following a recent streak of gains. It may produce more climactic gains, but it is extended from any sound base pattern. Its 50 DMA line defines support to watch on pullbacks.
>>> The latest Featured Stock Update with an annotated graph appeared on 3/15/2012. Click here.
View all notes |
Alert me of new notes |
CANSLIM.net Company Profile |
SEC |
Zacks Reports |
StockTalk |
News |
Chart |
Request a new note
C
A N
S L
I M
|
SWI
-
NYSE
Solarwinds Inc
COMPUTER SOFTWARE and SERVICES - Application Software
|
$38.61
|
+0.03
0.08% |
$38.78
|
1,226,760
98.05% of 50 DAV
50 DAV is 1,251,100
|
$42.22
-8.55%
|
1/26/2012
|
$32.36
|
PP = $33.78
|
|
MB = $35.47
|
Most Recent Note - 3/28/2012 11:06:58 AM
G - Pulling back from its new all-time high hit with a volume-driven gain on Monday. It is extended from its last sound base pattern. Earnings below the +25% guideline for the Dec '11 quarter raised fundamental concerns, yet its bullish technical action has argued for disciplined investors to give it the benefit of the doubt until technical sell signals occur.
>>> The latest Featured Stock Update with an annotated graph appeared on 3/16/2012. Click here.
View all notes |
Alert me of new notes |
CANSLIM.net Company Profile |
SEC |
Zacks Reports |
StockTalk |
News |
Chart |
Request a new note
C
A N
S L
I M
|
SXCI
-
NASDAQ
S X C Health Solutions
COMPUTER SOFTWARE and SERVICES - Healthcare Information Service
|
$74.16
|
+1.71
2.36% |
$74.38
|
381,354
97.66% of 50 DAV
50 DAV is 390,500
|
$76.42
-2.96%
|
2/23/2012
|
$68.24
|
PP = $66.05
|
|
MB = $69.35
|
Most Recent Note - 3/28/2012 11:42:17 AM
G - Remaining in a tight trading range for the past 4 weeks, extended from its prior base. Its 50 DMA line and prior highs in the $66 area define support to watch on pullbacks.
>>> The latest Featured Stock Update with an annotated graph appeared on 3/6/2012. Click here.
View all notes |
Alert me of new notes |
CANSLIM.net Company Profile |
SEC |
Zacks Reports |
StockTalk |
News |
Chart |
Request a new note
C
A N
S L
I M
|
Symbol/Exchange
Company Name
Industry Group |
PRICE |
CHANGE
(%Change) |
Day High |
Volume
(% DAV)
(% 50 day avg vol) |
52 Wk Hi
% From Hi |
Featured
Date |
Price
Featured |
Pivot Featured |
|
Max Buy |
TDG
-
NYSE
Transdigm Group Inc
AEROSPACE/DEFENSE - Aerospace/Defense Products and; Services
|
$114.96
|
-1.04
-0.90% |
$115.44
|
414,173
97.45% of 50 DAV
50 DAV is 425,000
|
$121.48
-5.37%
|
2/29/2012
|
$120.10
|
PP = $118.93
|
|
MB = $124.88
|
Most Recent Note - 3/26/2012 10:40:05 PM
Y - Up today on near average volume, yet it remains below its latest pivot point after encountering distributional pressure. Its recent low ($111.03 on 3/06/12) and its 50 DMA line define important chart support to watch above prior highs in the $102 area.
>>> The latest Featured Stock Update with an annotated graph appeared on 2/10/2012. Click here.
View all notes |
Alert me of new notes |
CANSLIM.net Company Profile |
SEC |
Zacks Reports |
StockTalk |
News |
Chart |
Request a new note
C
A N
S L
I M
|
TNGO
-
NASDAQ
Tangoe Inc
COMPUTER SOFTWARE and SERVICES - Technical and System Software
|
$19.21
|
+0.20
1.05% |
$19.74
|
5,503,404
1,271.58% of 50 DAV
50 DAV is 432,800
|
$20.05
-4.19%
|
3/27/2012
|
$19.35
|
PP = $20.00
|
|
MB = $21.00
|
Most Recent Note - 3/29/2012 1:19:55 PM
Y - Today's volume-driven gain has it nearly challenging its 52-week high and its new pivot point, poised for a possible best-ever close. On 3/27/12 it was noted - "Latest consolidation above support at its 50 DMA line may be considered a 'square box' base. A new pivot point is cited based on its 2/24/12 high plus 10 cents while its color code is changed to yellow. A subsequent volume-driven gain with at least +40% above average volume may trigger a new (or add-on) technical buy signal."
>>> The latest Featured Stock Update with an annotated graph appeared on 2/14/2012. Click here.
View all notes |
Alert me of new notes |
CANSLIM.net Company Profile |
SEC |
Zacks Reports |
StockTalk |
News |
Chart |
Request a new note
C
A N
S L
I M
|
TSCO
-
NASDAQ
Tractor Supply Co
SPECIALTY RETAIL - Specialty Retail, Other
|
$91.14
|
-0.16
-0.18% |
$91.37
|
595,860
91.56% of 50 DAV
50 DAV is 650,800
|
$92.74
-1.73%
|
1/12/2012
|
$79.12
|
PP = $75.58
|
|
MB = $79.36
|
Most Recent Note - 3/26/2012 1:20:48 PM
G - Volume-driven gain today for a new all-time high. Color code is changed to green after rising further from its previous sound base. Last noted on 3/22/12 that it could be accumulated up to the prior high $88.65 (on 2/28/12) plus another 5%, however - the further one chases any stock above its pivot point the greater the chances are than an ordinary pullback may necessitate selling. Its 50 DMA line defines support to watch on pullbacks.
>>> The latest Featured Stock Update with an annotated graph appeared on 2/27/2012. Click here.
View all notes |
Alert me of new notes |
CANSLIM.net Company Profile |
SEC |
Zacks Reports |
StockTalk |
News |
Chart |
Request a new note
C
A N
S L
I M
|
UA
-
NYSE
Under Armour Inc Cl A
CONSUMER NON-DURABLES - Textile - Apparel Clothing
|
$94.04
|
-1.84
-1.92% |
$94.42
|
1,268,750
103.19% of 50 DAV
50 DAV is 1,229,500
|
$99.35
-5.34%
|
2/15/2012
|
$85.77
|
PP = $84.86
|
|
MB = $89.10
|
Most Recent Note - 3/29/2012 1:28:33 PM
G - Pulling back from its all-time highs today with a 3rd consecutive loss. It is extended from its last sound base pattern and recent gains above its pivot point did not have volume sufficient to trigger a proper technical buy signal.
>>> The latest Featured Stock Update with an annotated graph appeared on 2/15/2012. Click here.
View all notes |
Alert me of new notes |
CANSLIM.net Company Profile |
SEC |
Zacks Reports |
StockTalk |
News |
Chart |
Request a new note
C
A N
S L
I M
|
UBNT
-
NASDAQ
Ubiquiti Networks Inc
TELECOMMUNICATIONS - Diversified Communication Serv
|
$31.15
|
+0.20
0.65% |
$31.74
|
583,602
174.52% of 50 DAV
50 DAV is 334,400
|
$33.97
-8.30%
|
1/27/2012
|
$22.25
|
PP = $23.14
|
|
MB = $24.30
|
Most Recent Note - 3/28/2012 5:12:43 PM
G - Pulled back today for a second consecutive loss on above average volume after hitting a new 52-week high on Monday. It is extended from the previous base, and its 50 DMA line defines important near-term support to watch on pullbacks.
>>> The latest Featured Stock Update with an annotated graph appeared on 3/21/2012. Click here.
View all notes |
Alert me of new notes |
CANSLIM.net Company Profile |
SEC |
Zacks Reports |
StockTalk |
News |
Chart |
Request a new note
C
A N
S L
I M
|
Symbol/Exchange
Company Name
Industry Group |
PRICE |
CHANGE
(%Change) |
Day High |
Volume
(% DAV)
(% 50 day avg vol) |
52 Wk Hi
% From Hi |
Featured
Date |
Price
Featured |
Pivot Featured |
|
Max Buy |
ULTA
-
NASDAQ
Ulta Salon Cosm & Frag
SPECIALTY RETAIL - Specialty Retail, Other
|
$92.83
|
-0.76
-0.81% |
$93.17
|
572,667
81.39% of 50 DAV
50 DAV is 703,600
|
$94.73
-2.01%
|
1/11/2012
|
$71.97
|
PP = $75.80
|
|
MB = $79.59
|
Most Recent Note - 3/28/2012 11:45:09 AM
G - Perched near its all-time high today with volume totals cooling. Its 50 DMA line defines support above its prior highs in the $75 area. It is extended from any sound base pattern.
>>> The latest Featured Stock Update with an annotated graph appeared on 2/28/2012. Click here.
View all notes |
Alert me of new notes |
CANSLIM.net Company Profile |
SEC |
Zacks Reports |
StockTalk |
News |
Chart |
Request a new note
C
A N
S L
I M
|
V
-
NYSE
Visa Inc Cl A
DIVERSIFIED SERVICES - Business/Management Services
|
$119.00
|
-0.35
-0.29% |
$119.18
|
2,171,804
59.40% of 50 DAV
50 DAV is 3,656,400
|
$120.70
-1.41%
|
3/12/2012
|
$116.53
|
PP = $119.46
|
|
MB = $125.43
|
Most Recent Note - 3/28/2012 11:47:08 AM
Y - Touched another new all-time high on 3/26/12 with a gain on average volume. Volume-driven gains may trigger a new (or add-on) technical buy signal, meanwhile its 50 DMA line defines support to watch above prior highs in the $103-104 area.
>>> The latest Featured Stock Update with an annotated graph appeared on 3/7/2012. Click here.
View all notes |
Alert me of new notes |
CANSLIM.net Company Profile |
SEC |
Zacks Reports |
StockTalk |
News |
Chart |
Request a new note
C
A N
S L
I M
|