You are not logged in.
This means
you CAN ONLY VIEW reports that were published prior to Tuesday, April 22, 2025.
You
MUST UPGRADE YOUR MEMBERSHIP if you want to see any current reports.
 MIDDAY BREAKOUTS REPORT - FRIDAY, MARCH 30TH, 2012 MIDDAY BREAKOUTS REPORT - FRIDAY, MARCH 30TH, 2012
Previous Mid Day Report Next Mid Day Report >>>
|
|
DOW 13200.5 54.68 (0.42%) | NASDAQ 3096.02 0.66 (0.02%) | S&P 500 1408.26 4.98 (0.35%)
|
Time of Screening :
3/30/2012 11:43:31 AM Report Released :
3/30/2012 12:34:42 PM
Price is:
Above 52W High and Less Than 52W High
but within 8% of the 52 Week High
Volume Is:
At least 57.5% of 50 Day Average at
the time of the screening.
More details about this report...
At around
mid-way through each trading day we run
a screen against our database of
high-ranked stocks, searching for
possible buy candidates that are trading
at or near their 52-week high on above
average volume. The results of that
screen are split into the two sections
you see below. The first, titled
"TODAY's FEATURED STOCKS" shows stocks
that our experts have recently
identified as among the strongest candidates to
consider. Stocks highlighted in yellow
are the most timely and noteworthy, so
particular attention and prompt action
may be appropriate. The second section,
titled "TODAY's BREAKOUT SCREEN" shows
the remainder of stocks meeting today's
screen parameters. Our experts have
reviewed and included notes on these
stocks as well, but found that they may
not match up as favorably.
|
|
Y - Today's strongest
candidates
highlighted
by our staff
of experts.
|
|
G - Previously featured in
this report as yellow and
now may no longer be buyable
under the guidelines.
|
|
|
Symbol/Exchange
Company Name
Industry Group |
PRICE |
CHANGE
(%Change) |
Day High |
Volume
(% DAV)
(50 DAV) |
52 Wk Hi
% From Hi |
Date
Featured |
Price
Featured |
Pivot Point |
|
Max Buy |
ALLT
- NASDAQ
Allot Communications Ltd
|
$23.25
|
+0.32
1.40%
|
$23.42
|
416,622
106.17% of 50 DAV
50 DAV is 392,400
|
$23.42
-0.73%
|
3/13/2012 |
$19.72
|
PP = $18.91
MB = $19.86 |
Most Recent Note - 3/30/2012 11:54:07 AM
G - Touching another new 52-week high with today's gain after encountering distributional pressure this week. Prior highs near $18-19 define initial support to watch on pullbacks.
>>> The latest Featured Stock Update with an annotated graph appeared on 3/19/2012. Click here.
|
|
View all notes |
Alert me of new notes |
Company Profile |
SEC |
News |
Chart | C
A N
S L
I M
|
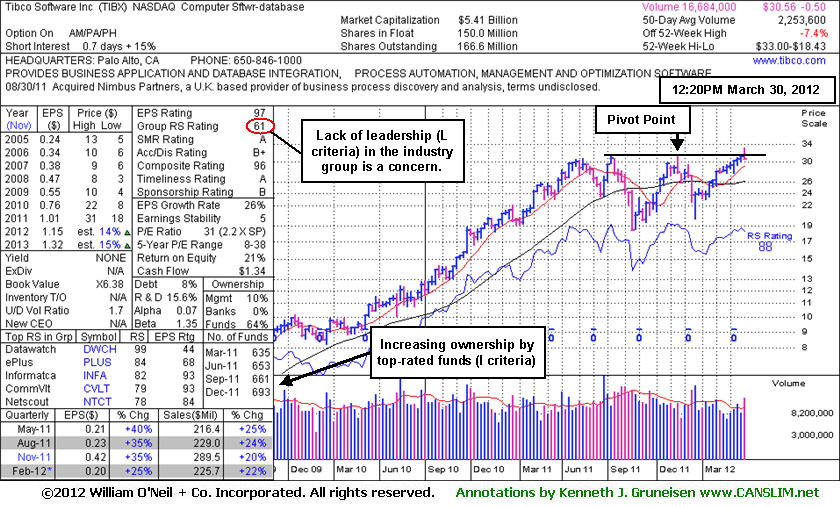
TIBX
- NASDAQ
Tibco Software Inc
|
$31.01
|
-1.44
-4.44%
|
$33.00
|
4,240,032
188.14% of 50 DAV
50 DAV is 2,253,600
|
$33.00
-6.03%
|
3/30/2012 |
$31.01
|
PP = $31.25
MB = $32.81 |
Most Recent Note - 3/30/2012 12:28:35 PM
Y - Color code is changed to yellow with pivot point cited based on its 11/16/11 high plus 10 cents. Technically, its volume-driven gain on the prior session triggered a buy signal. Touched a new 52-week high today then reversed into the red. Reported earnings +25% on +22% sales revenues for the quarter ended February 29, 2012 versus they year ago period. Volume and volatility often increase near earnings news. Recently rebounded after another deep consolidation below its 200 DMA line since last noted in the 11/14/11 mid-day report - "Dropped from the Featured Stocks list on 6/13/11. Fundamentals remain strong concerning the C and A criteria."
>>> The latest Featured Stock Update with an annotated graph appeared on 5/18/2011. Click here.
|
|
View all notes |
Alert me of new notes |
Company Profile |
SEC |
News |
Chart | C
A N
S L
I M
|
TNGO
- NASDAQ
Tangoe Inc
|
$19.16
|
-0.06
-0.29%
|
$19.55
|
369,748
68.40% of 50 DAV
50 DAV is 540,600
|
$20.05
-4.46%
|
3/27/2012 |
$19.35
|
PP = $20.00
MB = $21.00 |
Most Recent Note - 3/30/2012 12:30:23 PM
Y - Perched near its 52-week high, it completed a Public Offering on 3/29/12. On 3/27/12 it was noted - "Latest consolidation above support at its 50 DMA line may be considered a 'square box' base. A new pivot point is cited based on its 2/24/12 high plus 10 cents while its color code is changed to yellow. A subsequent volume-driven gain with at least +40% above average volume may trigger a new (or add-on) technical buy signal."
>>> The latest Featured Stock Update with an annotated graph appeared on 2/14/2012. Click here.
|
|
View all notes |
Alert me of new notes |
Company Profile |
SEC |
News |
Chart | C
A N
S L
I M
|
UBNT
- NASDAQ
Ubiquiti Networks Inc
|
$31.95
|
+0.80
2.57%
|
$32.19
|
196,845
58.10% of 50 DAV
50 DAV is 338,800
|
$33.97
-5.95%
|
1/27/2012 |
$22.25
|
PP = $23.14
MB = $24.30 |
Most Recent Note - 3/30/2012 12:33:51 PM
G - Perched near its 52-week high today, extended from the previous base. Its 50 DMA line defines important near-term support to watch on pullbacks.
>>> The latest Featured Stock Update with an annotated graph appeared on 3/21/2012. Click here.
|
|
View all notes |
Alert me of new notes |
Company Profile |
SEC |
News |
Chart | C
A N
S L
I M
|
|
 |
Symbol - Exchange - Industry Group
Company Name |
Last |
Chg |
Day
High |
52 WK Hi |
% From Hi |
Volume
% DAV |
DAV |
AAPL
- NASDAQ - COMPUTER HARDWARE - Personal Computers
Apple Inc
|
$602.93 |
-6.93
-1.14%
|
$610.56
|
$621.45
|
-2.98% |
14,463,214
67.25%
|
21,505,100
|
Most Recent Note for AAPL - 3/30/2012 11:45:13 AM
Perched near its all-time high, stubbornly holding its ground after recent gains backed by average volume. It could go on to produce more climactic gains, however, this well-known tech leader is very extended from any sound base pattern, making it a risky candidate. Prior notes acknowledged the considerable rally since the previously noted "breakaway gap" on 1/25/12 from an advanced "3-weeks tight" base pattern. Members may study companies on the "Featured Stocks" list for current stocks resembling the winning models of the fact-based investment system.
|
|
View all notes |
Alert me of new notes |
Company Profile |
SEC |
News |
Chart | C
A N
S L
I M
|
AET
- NYSE - HEALTH SERVICES - Health Care Plans
Aetna Inc
|
$50.43 |
+0.87
1.76%
|
$51.14
|
$51.14
|
-1.39% |
3,271,313
81.48%
|
4,014,700
|
Most Recent Note for AET - 3/30/2012 11:47:22 AM
Hitting new 52-week highs today with a 2nd consecutive volume-driven gain. Found support at its 50 DMA line during its latest consolidation in a tight trading range. Earnings increases have been above the +25% guideline in the past 7 quarterly comparisons versus the year earlier, but during that span its sales revenues were in the negative -0-3% range. Annual earnings (A criteria) history is also below the investment system's guidelines.
|
|
View all notes |
Alert me of new notes |
Company Profile |
SEC |
News |
Chart | C
A N
S L
I M
|
ALG
- NYSE - MANUFACTURING - Farm & Construction Machinery
Alamo Group Inc
|
$30.14 |
+0.39
1.31%
|
$30.33
|
$30.93
|
-2.55% |
14,602
67.29%
|
21,700
|
Most Recent Note for ALG - 3/30/2012 11:51:51 AM
Touched a new 52-week high this week. Reported earnings +15% on +11% sales revenues for the quarter ended December 31, 2011 versus the year ago period. Found support above its 200 DMA line during its consolidation since last noted in the 2/03/12 mid-day report - "No resistance remaining due to overhead supply. Earnings increases had improved in recent quarters, but sales revenues increases have been below guidelines and its annual earnings (A criteria) history has been up and down."
|
|
View all notes |
Alert me of new notes |
Company Profile |
SEC |
News |
Chart | C
A N
S L
I M
|
ANSS
- NASDAQ - Computer Sftwr-Design
Ansys Inc
|
$65.55 |
+0.34
0.52%
|
$65.64
|
$66.56
|
-1.52% |
319,580
105.96%
|
301,600
|
Most Recent Note for ANSS - 3/30/2012 11:56:11 AM
Testing support at its 50 DMA line today, yet perched just -1.6% off the new all-time high it quietly touched earlier this week. Reported earnings +5% on +19% sales revenues for the quarter ended December 31, 2011 versus the year ago period. Prior earnings increases had been near the +25% minimum guideline in recent quarterly comparisons and it maintained a steady annual earnings (A criteria) growth history. It survived but failed to impress since dropped from the Featured Stocks list on 9/17/09.
|
|
View all notes |
Alert me of new notes |
Company Profile |
SEC |
News |
Chart | C
A N
S L
I M
|
DISCA
- NASDAQ - MEDIA - Broadcasting - TV
Discovery Com Cl A
|
$50.25 |
+0.84
1.70%
|
$50.88
|
$50.88
|
-1.24% |
858,548
61.61%
|
1,393,600
|
Most Recent Note for DISCA - 3/30/2012 12:04:50 PM
Ownership by top-rated funds rose from 888 in Sep '11 to 928 in Dec '11. No resistance remains due to overhead supply and it is hitting a new 52-week high today, getting extended from prior highs in the $45 area. Earnings have been above the +25% guideline in quarterly comparisons and its annual earnings history has been strong. However, in 5 of the past 8 quarters (through Sep 2011) there are blue triangles beside the earnings figure on the chart service used by our experts - which indicates pre-tax, non-recurring items were included (where possible, such items are normally removed to provide data better suited for comparison).
|
|
View all notes |
Alert me of new notes |
Company Profile |
SEC |
News |
Chart | C
A N
S L
I M
|
FL
- NYSE - RETAIL - Apparel Stores
Foot Locker Inc
|
$31.00 |
-0.56
-1.77%
|
$31.65
|
$32.27
|
-3.94% |
1,311,418
66.17%
|
1,981,900
|
Most Recent Note for FL - 3/30/2012 12:06:01 PM
Perched near its 52-week high today, extended from any sound base pattern. Held its ground stubbornly as it gradually advanced into new high territory since noted in the 12/22/11 mid-day report after it found support near its 50 DMA line - "Quarterly results showed strong earnings increases but sales revenues growth has been sub par and its annual earnings (A criteria) history is not a good match with the investment system's guidelines."
|
|
View all notes |
Alert me of new notes |
Company Profile |
SEC |
News |
Chart | C
A N
S L
I M
|
PATK
- NASDAQ - Bldg-Mobile/Mfg & RV
Patrick Industries Inc
|
$11.95 |
+0.64
5.61%
|
$12.04
|
$12.15
|
-1.69% |
67,226
91.59%
|
73,400
|
Most Recent Note for PATK - 3/30/2012 12:07:18 PM
Perched near its 52-week high today, holding its ground after an impressive spurt of volume-driven gains. Prior mid-day reports noted - "Technically it is extended from prior chart highs, too far from any sound base. Fundamentally it is not a match with the fact-based investment system's guidelines. Low-priced stocks are discouraged from consideration as buy candidates unless all key criteria are solidly satisfied."
|
|
View all notes |
Alert me of new notes |
Company Profile |
SEC |
News |
Chart | C
A N
S L
I M
|
RHT
- NYSE - COMPUTER SOFTWARE & SERVICES - Application Software
Red Hat Inc
|
$59.63 |
-1.80
-2.93%
|
$61.51
|
$61.71
|
-3.37% |
2,767,261
152.08%
|
1,819,600
|
Most Recent Note for RHT - 3/30/2012 12:11:35 PM
Pulling back today following a considerable gap up gain and new 52-week high on the prior session backed by heavy volume. Reported earnings +12% on +21% sales revenues for the quarter ended February 29, 2012 versus the year ago period. It failed to impress since last noted in the 9/23/10 mid-day report -"Quarterly and annual earnings history are below guidelines of the fact-based investment system."
|
|
View all notes |
Alert me of new notes |
Company Profile |
SEC |
News |
Chart | C
A N
S L
I M
|
SAP
- NYSE - COMPUTER SOFTWARE & SERVICES - Application Software
S A P Ag Adr
|
$69.81 |
-0.04
-0.06%
|
$70.14
|
$72.52
|
-3.74% |
887,950
58.07%
|
1,529,200
|
Most Recent Note for SAP - 3/30/2012 12:13:46 PM
Consolidating near its 52-week high. Reported earnings +13% on +8% sales revenues for the quarter ended December 31, 2011 versus the year ago period. Last noted in the 4/20/11 mid-day report - "Earnings and sales revenues growth rates have been below guidelines. It also has a huge supply of 1.227 billion shares outstanding, making it less likely to be a good sprinter. It survived but failed to impress since noted in the 10/02/07 mid-day report."
|
|
View all notes |
Alert me of new notes |
Company Profile |
SEC |
News |
Chart | C
A N
S L
I M
|
TRIP
- NASDAQ - INTERNET - Internet Information Providers
TripAdvisor Inc
|
$36.41 |
+1.25
3.56%
|
$36.86
|
$36.86
|
-1.22% |
1,646,788
72.49%
|
2,271,900
|
Most Recent Note for TRIP - 3/30/2012 12:32:59 PM
Hitting a new 52-week high today. Reported earnings +14% on +30% sales revenues for the quarter ended December 31, 2011, versus the year ago period, below the +25% minimum earnings guideline of the fact-based investment system.
|
|
View all notes |
Alert me of new notes |
Company Profile |
SEC |
News |
Chart | C
A N
S L
I M
|
|
|
|
THESE ARE NOT BUY RECOMMENDATIONS!
Comments contained in the body of this report are technical
opinions only. The material herein has been obtained
from sources believed to be reliable and accurate, however,
its accuracy and completeness cannot be guaranteed.
We are not an investment advisor, hence it does
not endorse or recommend any securities or other investments.
Any recommendation contained in this report may not
be suitable for all investors and it is not to be deemed
an offer or solicitation on our part with respect to
the purchase or sale of any securities. All trademarks,
service marks and trade names appearing in this report
are the property of their respective owners, and are
likewise used for identification purposes only.
This report is a service available
only to active Paid Premium Members.
You may opt-out of receiving report notifications
at any time. Questions or comments may be submitted
by writing to FactBasedInvesting.com c/o Premium
Member Services 665 S.E. 10 Street, Suite 201
Deerfield Beach, FL 33441-5634 or by calling 954-785-1121.
We appreciate any feedback
members may wish to send via the inquiry form
here.
|
|
|


