You are not logged in.
This means you
CAN ONLY VIEW reports that were published prior to Monday, April 14, 2025.
You
MUST UPGRADE YOUR MEMBERSHIP if you want to see any current reports.
AFTER MARKET UPDATE - FRIDAY, MARCH 26TH, 2010
Previous After Market Report Next After Market Report >>>
|
|
|
|
DOW |
+9.15 |
10,850.36 |
+0.08% |
|
Volume |
1,028,764,310 |
-11% |
|
Volume |
2,286,212,240 |
-12% |
|
NASDAQ |
-2.28 |
2,395.13 |
-0.10% |
|
Advancers |
1,528 |
49% |
|
Advancers |
1,317 |
47% |
|
S&P 500 |
+0.86 |
1,166.59 |
+0.07% |
|
Decliners |
1,486 |
47% |
|
Decliners |
1,370 |
49% |
|
Russell 2000 |
-0.13 |
678.97 |
-0.02% |
|
52 Wk Highs |
169 |
|
|
52 Wk Highs |
70 |
|
|
S&P 600 |
-0.53 |
361.10 |
-0.15% |
|
52 Wk Lows |
12 |
|
|
52 Wk Lows |
14 |
|
|
 |
Fewer Stocks Hit New Highs As Volume Totals Cool
Adam Sarhan, Contributing Writer,
For the week, the major averages ended higher as investors digested a slew of political, economic, and earnings data. The volume totals on the NYSE and on the Nasdaq exchange Friday were reported lower compared to Thursday's totals while advancers were evenly mixed with decliners on both exchanges. There were 17 high-ranked companies from the CANSLIM.net Leaders List that made a new 52-week high and appeared on the CANSLIM.net BreakOuts Page, much lower than the 58 issues that appeared on the prior session. New 52-week highs outnumbered new lows on both exchanges yet again.
On Monday, the major averages ended higher as the dollar fell after Congress passed the historic health care bill. Stocks continued rallying on Tuesday after stronger-than-expected data was released from the ailing housing market. All the major averages rallied to new recovery highs after the National Association of Realtors said existing US home sales slowed to 0.6% last month which topped estimates.February's reading was also higher from January's -7.2% decline.
On Wednesday, the major averages, US Treasuries, the euro and a slew of commodities pulled back as the US dollar advanced after Portugal's debt was downgraded by Fitch. Economic data was mixed: durable goods were up while new home sales fell. Durable goods topped estimates and rose for a third consecutive month which was a healthy sign for the economic recovery. Meanwhile, new home sales fell -2.2% to a 308,000 annual rate. Overseas, Europe received some healthy economic data: European services and manufacturing grew at the fastest pace since August 2007 and German business confidence rose.
Stocks erased earlier gains and closed near their lows on Thursday after the Labor Department said initial jobless claims fell to the lowest level in six weeks and Fed Chief, Ben Bernanke, testified on Capital Hill.On Friday, stocks ended mixed after tensions escalated between North and South Korea. Before Friday's open, the Commerce Department revised Q4 GDP to +5.6%, down from +5.9%. In addition, the average company in the S&P 500 earned a profit in Q4 2009 which snapped a 9-month losing streak and was the first quarterly profit since the second quarter of 2007. It will be interesting to see if that healthy news can continue in the first quarter of 2010.
The fact that there have only been two distribution days since the follow-though-day (FTD) bodes well for this nascent rally. It is also a welcome sign to see the market continue to improve as investors digest the latest round of stronger than expected economic and earnings data. Remember that now that a new rally has been confirmed, the window is open to proactively be buying high quality breakouts meeting the investment system guidelines. Trade accordingly.
Professional Money Management Services - A Winning System - Inquire today!
Our skilled team of portfolio managers knows how to follow the rules of this fact-based investment system. We do not follow opinion or the "conviction list" of some large Wall Street institution which would have us fully invested even during horrific bear markets. Instead, we remain fluid and only buy the best stocks when they are triggering proper technical buy signals. If you are not completely satisfied with the way your portfolio is being managed, Click here to get connected with one of our portfolio managers. *Accounts over $250,000 please. ** Serious inquires only, please.
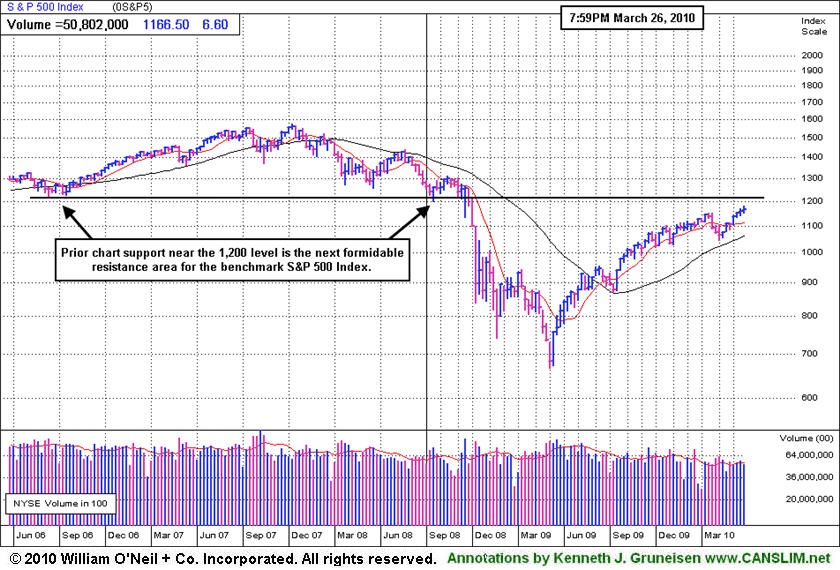
PICTURED: The S&P 500 Index posted a 4th consecutive weekly gain. Prior chart support near the 1,200 level is the next formidable resistance area for the benchmark index.
|
|
|
 |
Bank Index At Recovery High After 6 Weekly Gains
Kenneth J. Gruneisen - Passed the CAN SLIM® Master's Exam
The Gold & Silver Index ($XAU +1.96%) was a standout gainer on Friday, yet it failed to repair this week's violation of its 50-day and 200-day moving average lines (shown in the 3/24/10 Industry Group Watch section - read here). The Retail Index ($RLX +0.61%) posted a small gain, and the energy group had a slightly positive bias as the Integrated Oil Index ($XOI +0.23%) and Oil Services Index ($OSX +0.66%) edged higher. Financial shares drifted lower as the Broker/Dealer Index ($XBD -0.83%) closed out a second consecutive weekly loss. The Healthcare Index ($HMO -1.34%) fell for a 4th consecutive session. The tech sector showed mixed results as the Semiconductor Index ($SOX -0.53%) edged lower, the Networking Index ($NWX +0.41%) posted a small gain, and the Internet Index ($IIX -0.06%) and Biotechnology Index ($BTK +0.08%) both were virtually unchanged.
Charts courtesy www.stockcharts.com
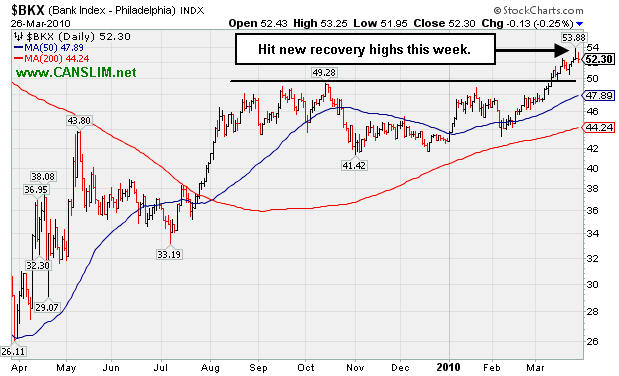
PICTURED: The Bank Index ($BKX -0.25%) hit a new recovery high this week, ending lower on Friday but finishing with its 6th consecutive weekly gain. Leadership in financial shares is a very reassuring sign. While financial shares are acting strong there is less of a chance for damaging declines in the major averages, so the outlook for the broader market is favorable.
| Oil Services |
$OSX |
199.29 |
+1.30 |
+0.66% |
+2.24% |
| Healthcare |
$HMO |
1,553.03 |
-21.11 |
-1.34% |
+5.44% |
| Integrated Oil |
$XOI |
1,058.17 |
+2.44 |
+0.23% |
-0.94% |
| Semiconductor |
$SOX |
362.89 |
-1.94 |
-0.53% |
+0.83% |
| Networking |
$NWX |
256.35 |
+1.05 |
+0.41% |
+10.95% |
| Internet |
$IIX |
247.71 |
-0.14 |
-0.06% |
+5.92% |
| Broker/Dealer |
$XBD |
116.60 |
-0.98 |
-0.83% |
+1.35% |
| Retail |
$RLX |
454.19 |
+2.75 |
+0.61% |
+10.48% |
| Gold & Silver |
$XAU |
161.41 |
+3.10 |
+1.96% |
-4.07% |
| Bank |
$BKX |
52.30 |
-0.13 |
-0.25% |
+22.45% |
| Biotech |
$BTK |
1,244.64 |
+1.02 |
+0.08% |
+32.11% |
|
|
|
 |
Little Progress Following Post-Breakout Offering
Kenneth J. Gruneisen - Passed the CAN SLIM® Master's Exam
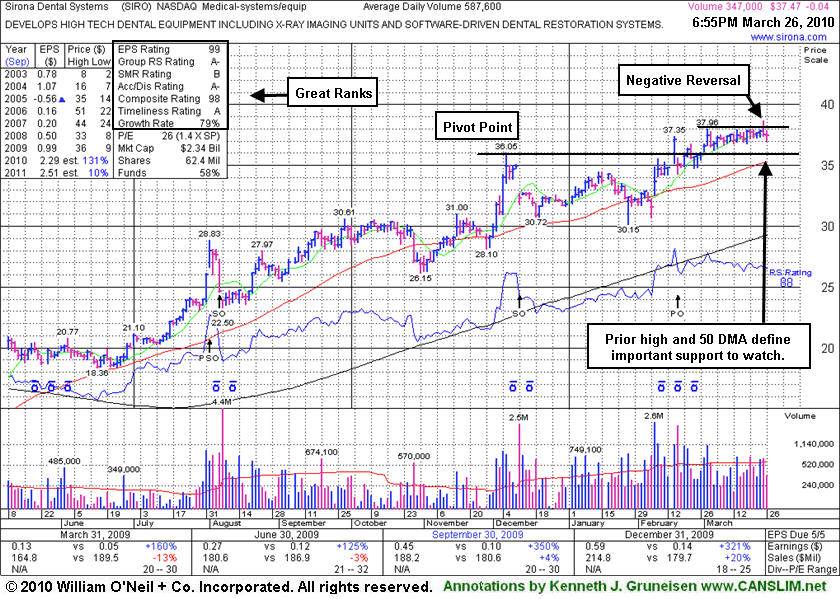
Sirona Dental Systems (SIRO -$0.22 or -0.59% to $36.99) held its ground today following a negative reversal on 3/25/10 for a small loss after early gains helped it briefly hit a new 52-week high above its "max buy" level. Prior chart highs and its 50-day moving average (DMA) line in the $35-36 area define important support to watch. Any subsequent weakness below its pivot point or its 50-day moving average (DMA) line would raise concerns. It has not made much progress since it was featured in yellow in the 2/16/10 mid-day report (read here) as it broke out from a 10-week flat base. The considerable 2/16/10 gain triggered a technical buy signal and an annotated graph was included under the headline "Medical - Systems/Equipment Firm Identified While Breaking Out."
Fundamentally, following 3 negative comparisons, its sales revenues in the Sep and Dec '09 quarters showed a return to growth. Quarterly earnings increases have been very strong along with great annual earnings growth in recent years (good C and A criteria). As it has rallied from January 2009 lows near $10, clearly it has been able to get help from underwriters as this high-ranked Medical - Systems/Equipment firm completed Secondary Offerings on 8/06/09 and 12/11/09, and yet another Public Offering on 2/17/10. The number of top-rated funds owning its shares rose from 55 in Mar '09 to 86 in Dec '09, which is nice reassurance with respect to the I criteria of the investment system. Companies often attract new institutional investors with the help of underwriters, but offerings often have the near-term effect of hindering upward price progress. Company management reportedly still owns a 70% interest in the company's shares even after those offerings, keeping them still very motivated to maintain and build shareholder value.
|
|
|
Color Codes Explained :
Y - Better candidates highlighted by our
staff of experts.
G - Previously featured
in past reports as yellow but may no longer be buyable under the
guidelines.
***Last / Change / Volume quote data in this table corresponds with the timestamp on the note***
Symbol/Exchange
Company Name
Industry Group |
Last |
Chg. |
Vol
% DAV |
Date Featured |
Price Featured |
Latest Pivot Point
Featured |
Status |
| Latest Max Buy Price |
ARUN
- NASDAQ
Aruba Networks Inc
COMPUTER HARDWARE - Networking & Communication Dev
|
$12.93
|
+0.15
|
2,036,797
135% DAV
1,504,500
|
2/19/2010
(Date
Featured) |
$12.71
(Price
Featured) |
PP = $11.94 |
G |
| MB = $12.54 |
Most Recent Note - 3/26/2010 6:12:36 PM
G - Posted its second consecutive gain today on higher above average volume. Support to watch is defined by prior chart highs and its 50 DMA line in the upper $11 area.
>>> The latest Featured Stock Update with an annotated graph appeared on 3/11/2010. click here.
|
|
C
A
S
I |
News |
Chart |
SEC
View all notes Alert
me of new notes
Company
Profile
|
BIDU
- NASDAQ
Baidu Inc Ads
INTERNET - Internet Information Providers
|
$596.37
|
+4.39
|
1,363,535
62% DAV
2,194,100
|
1/13/2010
(Date
Featured) |
$431.25
(Price
Featured) |
PP = $426.75 |
G |
| MB = $448.09 |
Most Recent Note - 3/26/2010 6:23:19 PM
G - Holding its ground near all-time highs. As recently noted, "It is extended from any sound base now. An upward trendline connecting its January-March lows is an initial chart support level to watch, where a subsequent violation may prompt investors to lock in gains."
>>> The latest Featured Stock Update with an annotated graph appeared on 3/24/2010. click here.
|
|
C
A
S
I |
News |
Chart |
SEC
View all notes Alert
me of new notes
Company
Profile
|
BRLI
- NASDAQ
Bio Reference Labs Inc
HEALTH SERVICES - Medical Laboratories & Researc
|
$43.48
|
+0.82
|
117,732
122% DAV
96,700
|
2/12/2010
(Date
Featured) |
$39.02
(Price
Featured) |
PP = $40.97 |
G |
| MB = $43.02 |
Most Recent Note - 3/26/2010 6:25:58 PM
G - Today's solid gain came with better than average volume after 3 consecutive losses with lighter volume. It closed the week above its "max buy" level, and its color code is changed to green. Consolidating in a healthy manner since its negative reversal on 3/12/10. Prior chart highs and its 50 DMA line coincide in the $40 area, defining important support to watch.
>>> The latest Featured Stock Update with an annotated graph appeared on 3/22/2010. click here.
|
|
C
A
S
I |
News |
Chart |
SEC
View all notes Alert
me of new notes
Company
Profile
|
CISG
- NASDAQ
Cninsure Inc Ads
INSURANCE - Insurance Brokers
|
$26.83
|
+0.32
|
189,130
82% DAV
229,400
|
3/3/2010
(Date
Featured) |
$24.38
(Price
Featured) |
PP = $23.10 |
G |
| MB = $24.26 |
Most Recent Note - 3/26/2010 6:27:28 PM
G - Holding its ground after a considerable gain on 3/23/10 with 3 times average volume for a new 52-week high. Extended from a sound base, yet no overhead supply remains to act as resistance. It rose from a 20-week double bottom base with 8 times average volume as it was featured in the 3/03/10 mid-day report (read here).
>>> The latest Featured Stock Update with an annotated graph appeared on 3/23/2010. click here.
|
|
C
A
S
I |
News |
Chart |
SEC
View all notes Alert
me of new notes
Company
Profile
|
CRM
- NYSE
Salesforce.com Inc
INTERNET - Internet Software & Services
|
$74.95
|
-1.02
|
1,051,533
52% DAV
2,009,700
|
3/5/2010
(Date
Featured) |
$72.28
(Price
Featured) |
PP = $75.53 |
Y |
| MB = $79.31 |
Most Recent Note - 3/26/2010 6:31:33 PM
Y - Posted a 4th consecutive loss today on light volume, slumping under its pivot point near prior chart highs in the $75 area. It recently rose above its pivot point to a new 52-week high without the required volume to trigger a proper technical buy signal.
>>> The latest Featured Stock Update with an annotated graph appeared on 3/25/2010. click here.
|
|
C
A
S
I |
News |
Chart |
SEC
View all notes Alert
me of new notes
Company
Profile
|
CTRP
- NASDAQ
Ctrip.com Intl Ltd Adr
LEISURE - Resorts & Casinos
|
$39.52
|
-0.97
|
2,327,272
107% DAV
2,184,600
|
3/25/2010
(Date
Featured) |
$40.74
(Price
Featured) |
PP = $39.40 |
Y |
| MB = $41.37 |
Most Recent Note - 3/26/2010 6:33:16 PM
Y - Slumped back near its pivot point today with a loss on average volume. Its 3/25/10 gain for a new 52-week high with +81% above average volume triggered a technical buy signal. Recently found prompt support near its 50 DMA line. A detailed new Stock Bulletin with annotated graphs and expert analysis was published on 3/25/10 (read here).
>>> The latest Featured Stock Update with an annotated graph appeared on 3/25/2010. click here.
|
|
C
A
S
I |
News |
Chart |
SEC
View all notes Alert
me of new notes
Company
Profile
|
EZPW
- NASDAQ
Ezcorp Inc Cl A
SPECIALTY RETAIL - Specialty Retail, Other
|
$20.92
|
-0.12
|
258,965
47% DAV
547,300
|
2/19/2010
(Date
Featured) |
$19.03
(Price
Featured) |
PP = $18.80 |
G |
| MB = $19.74 |
Most Recent Note - 3/26/2010 6:35:54 PM
G - Quietly consolidating above its 50 DMA line and its recent chart low ($19.73 on 3/16/10) which are near-term support levels to watch.
>>> The latest Featured Stock Update with an annotated graph appeared on 3/8/2010. click here.
|
|
C
A
S
I |
News |
Chart |
SEC
View all notes Alert
me of new notes
Company
Profile
|
GMCR
- NASDAQ
Green Mtn Coffee Roastrs
FOOD & BEVERAGE - Processed & Packaged Goods
|
$93.13
|
-0.61
|
625,505
49% DAV
1,277,100
|
2/26/2010
(Date
Featured) |
$84.39
(Price
Featured) |
PP = $88.75 |
Y |
| MB = $93.19 |
Most Recent Note - 3/26/2010 6:42:23 PM
Y - Posted a 4th consecutive small loss on below average volume, still consolidating -5.4% from its all-time high. Its color code is changed to yellow as it finished just below its previously cited "max buy" level. Its high volume gain on 3/08/10 triggered the latest technical buy signal. Initial support to watch is prior chart highs in the $86-88 area.
>>> The latest Featured Stock Update with an annotated graph appeared on 3/12/2010. click here.
|
|
C
A
S
I |
News |
Chart |
SEC
View all notes Alert
me of new notes
Company
Profile
|
ISRG
- NASDAQ
Intuitive Surgical Inc
HEALTH SERVICES - Medical Appliances & Equipment
|
$342.00
|
-0.06
|
464,157
88% DAV
530,300
|
1/22/2010
(Date
Featured) |
$340.40
(Price
Featured) |
PP = $314.00 |
G |
| MB = $329.70 |
Most Recent Note - 3/26/2010 6:46:43 PM
G - Loss today on near average volume was its 6th loss in 7 sessions. Its slump under prior chart highs ($346) raised concerns while falling toward its 50 DMA line (now $340.10), an important support level to watch. As previously repeated in notes, it did not trigger a technical buy signal in recent weeks.
>>> The latest Featured Stock Update with an annotated graph appeared on 3/16/2010. click here.
|
|
C
A
S
I |
News |
Chart |
SEC
View all notes Alert
me of new notes
Company
Profile
|
PCLN
- NASDAQ
Priceline.com Inc
INTERNET - Internet Software & Services
|
$399.55
|
-4.72
|
584,812
N/A
|
11/1/2002
(Date
Featured) |
$399.55
(Price
Featured) |
PP = $428.20 |
Y |
| MB = $449.61 |
Most Recent Note - 1/2/2011
Y - Returns to Featured Stocks list with its appearance in the January 2011 CANSLIM.net News including detailed analysis and annotated daily and weekly graphs.
>>> The latest Featured Stock Update with an annotated graph appeared on 3/10/2010. click here.
|
|
C
A
S
I |
News |
Chart |
SEC
View all notes Alert
me of new notes
Company
Profile
|
PEGA
- NASDAQ
Pegasystems Inc
COMPUTER SOFTWARE & SERVICES - Business Software & Services
|
$37.80
|
-0.17
|
89,476
41% DAV
217,100
|
2/26/2010
(Date
Featured) |
$36.00
(Price
Featured) |
PP = $38.55 |
Y |
| MB = $40.48 |
Most Recent Note - 3/26/2010 6:51:51 PM
Y - Volume totals have cooled while it has hovered in a tight range near all-time highs, but it has failed to follow through with confirming gains since its considerable gap up gain on 3/15/10 triggered a technical buy signal. Prior chart highs near $37-38 are initial chart support above its 50 DMA line.
>>> The latest Featured Stock Update with an annotated graph appeared on 3/15/2010. click here.
|
|
C
A
S
I |
News |
Chart |
SEC
View all notes Alert
me of new notes
Company
Profile
|
ROVI
- NASDAQ
Rovi Corp
COMPUTER SOFTWARE & SERVICES - Security Software & Services
|
$37.32
|
-0.16
|
765,244
56% DAV
1,364,500
|
2/25/2010
(Date
Featured) |
$33.54
(Price
Featured) |
PP = $34.87 |
G |
| MB = $36.61 |
Most Recent Note - 3/26/2010 6:53:52 PM
G - Posted a 3rd consecutive small loss today on light volume, perched -3.1% from its all-time high. It is slightly extended from its latest base, while prior chart highs in the $34 area define an important support level to watch on pullbacks.
>>> The latest Featured Stock Update with an annotated graph appeared on 3/17/2010. click here.
|
|
C
A
S
I |
News |
Chart |
SEC
View all notes Alert
me of new notes
Company
Profile
|
SIRO
- NASDAQ
Sirona Dental Systems
HEALTH SERVICES - Medical Instruments & Supplies
|
$37.47
|
-0.04
|
355,002
61% DAV
579,100
|
2/16/2010
(Date
Featured) |
$36.43
(Price
Featured) |
PP = $36.15 |
Y |
| MB = $37.96 |
Most Recent Note - 3/26/2010 6:58:47 PM
Y - Held its ground today following a negative reversal on 3/25/10 for a small loss after early gains helped it hit a new 52-week high above its "max buy" level. Prior chart highs and its 50 DMA line in the $35-36 area define important support to watch.
>>> The latest Featured Stock Update with an annotated graph appeared on 3/26/2010. click here.
|
|
C
A
S
I |
News |
Chart |
SEC
View all notes Alert
me of new notes
Company
Profile
|
ULTA
- NASDAQ
Ulta Salon Cosm & Frag
SPECIALTY RETAIL - Specialty Retail, Other
|
$22.50
|
-0.22
|
254,226
70% DAV
363,100
|
3/12/2010
(Date
Featured) |
$22.81
(Price
Featured) |
PP = $21.72 |
Y |
| MB = $22.81 |
Most Recent Note - 3/26/2010 7:00:59 PM
Y - Small loss today with lighter than average volume, still consolidating below its "max buy" level yet above its pivot point and prior chart highs in the $21area. A detailed Stock Bulletin with annotated graph was published soon after it was featured in the 3/12/10 mid-day report.
>>> The latest Featured Stock Update with an annotated graph appeared on 3/12/2010. click here.
|
|
C
A
S
I |
News |
Chart |
SEC
View all notes Alert
me of new notes
Company
Profile
|
VPRT
- NASDAQ
Vistaprint Nv
DIVERSIFIED SERVICES - Business/Management Services
|
$59.98
|
-0.74
|
209,724
47% DAV
446,100
|
3/1/2010
(Date
Featured) |
$57.72
(Price
Featured) |
PP = $59.70 |
Y |
| MB = $62.69 |
Most Recent Note - 3/26/2010 7:03:05 PM
Y - Volume totals have cooled in recent weeks while consolidating above prior chart highs. It did not trigger a technical buy signal since it was featured in the March 2010 CANSLIM.net News monthly newsletter (read here). As previously noted, "Its gain on 3/02/10 was below the volume guidelines for buyable breakouts under the investment system."
>>> The latest Featured Stock Update with an annotated graph appeared on 3/19/2010. click here.
|
|
C
A
S
I |
News |
Chart |
SEC
View all notes Alert
me of new notes
Company
Profile
|
|
|
|
THESE ARE NOT BUY RECOMMENDATIONS!
Comments contained in the body of this report are technical
opinions only. The material herein has been obtained
from sources believed to be reliable and accurate, however,
its accuracy and completeness cannot be guaranteed.
This site is not an investment advisor, hence it does
not endorse or recommend any securities or other investments.
Any recommendation contained in this report may not
be suitable for all investors and it is not to be deemed
an offer or solicitation on our part with respect to
the purchase or sale of any securities. All trademarks,
service marks and trade names appearing in this report
are the property of their respective owners, and are
likewise used for identification purposes only.
This report is a service available
only to active Paid Premium Members.
You may opt-out of receiving report notifications
at any time. Questions or comments may be submitted
by writing to Premium Membership Services 665 S.E. 10 Street, Suite 201 Deerfield Beach, FL 33441-5634 or by calling 1-800-965-8307
or 954-785-1121.
|
|
|


