You are not logged in.
This means you
CAN ONLY VIEW reports that were published prior to Monday, April 14, 2025.
You
MUST UPGRADE YOUR MEMBERSHIP if you want to see any current reports.
AFTER MARKET UPDATE - FRIDAY, MARCH 25TH, 2011
Previous After Market Report Next After Market Report >>>
|
|
|
|
DOW |
+50.03 |
12,220.59 |
+0.41% |
|
Volume |
824,811,110 |
-5% |
|
Volume |
1,809,450,390 |
-6% |
|
NASDAQ |
+6.64 |
2,743.06 |
+0.24% |
|
Advancers |
1,977 |
63% |
|
Advancers |
1,526 |
56% |
|
S&P 500 |
+4.14 |
1,313.80 |
+0.32% |
|
Decliners |
1,034 |
33% |
|
Decliners |
1,104 |
40% |
|
Russell 2000 |
+6.75 |
823.85 |
+0.83% |
|
52 Wk Highs |
203 |
|
|
52 Wk Highs |
143 |
|
|
S&P 600 |
+3.64 |
436.20 |
+0.84% |
|
52 Wk Lows |
8 |
|
|
52 Wk Lows |
21 |
|
|
 |
Leadership Expands With Gains On Lighter Than Average Volume
Kenneth J. Gruneisen - Passed the CAN SLIM® Master's Exam
Volume totals on the NYSE and the Nasdaq exchange cooled on Friday while the major averages pushed their winning streak to three sessions and leadership continued to expand. The S&P 500 Index's +2.7% weekly gain was its best weekly gain in more than a month. For the week, the Dow Jones Industrial Average rose +3.0% and the tech-heavy Nasdaq Composite Index posted a weekly gain of +3.8%. New 52-week highs outnumbered new 52-week lows on the Nasdaq exchange and on the NYSE. Advancing issues beat decliners by almost 2-1 on the NYSE and by nearly 3-2 on the Nasdaq. There were 89 high-ranked companies from the CANSLIM.net Leaders List that made new 52-week highs and appeared on the CANSLIM.net BreakOuts Page, up from a total of 73 on the prior session. On the Featured Stocks Page there were gains from 17 of the 21 high-ranked market leaders currently listed.
Key earnings reports and an upwardly revised estimate of U.S. economic growth gave the market a lift. The Commerce Department said U.S. gross domestic product rose 3.1% in the fourth quarter, compared to an earlier estimate of 2.8%. Global events remained as potential market-moving catalysts heading into the weekend. Some pundits suggested that may have kept volume totals low. Initial reports suggest one reactor core may be damaged at a crippled Japan nuclear plant. Portuguese bonds fell, driving their yield to a euro-era record, as investors anticipated the country would follow Ireland and Greece in seeking a financial lifeline.
On the downside, Research in Motion Ltd (RIMM -11.23%) slumped after a disappointing sales outlook. Oracle Corp (ORCL +1.56%) rose after profits topped estimates while companies continued their push into cloud computing. Accenture Plc (ACN +4.48%) raised its sales outlook as more companies seek consulting services.
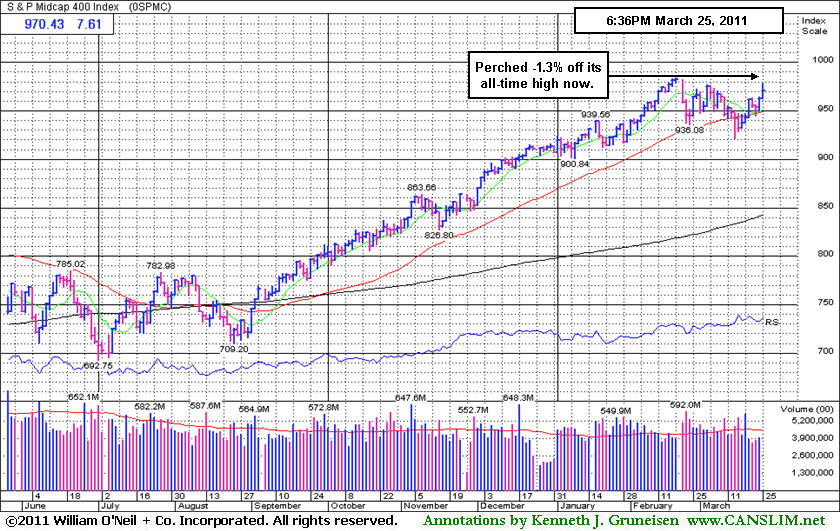
The bullish action of late did not meet the strict definition of a follow-through day (FTD), however the great expansion leadership (new 52-week highs) is a sign that the market has a healthy crop of strong leaders underpinning the latest rally effort. Coupled with the new leadership, the Dow Jones Industrial Average, S&P 500 Index, and the S&P Mid-Cap 400 and S&P Small-Cap 600 indexes have collectively rallied back to well above their respective 50-day moving average (DMA) lines. Since the last day of heavy distribution on March 16th, the institutional crowd has shown more encouraging signs of accumulation again. Even after a convincing FTD, new buying efforts should always be cautiously and carefully made only when all of the investment system's key criteria are met.
PICTURED: The S&P Mid-Cap 400 Index ended the week -1.3% off its recently hit all-time high.
|
 Kenneth J. Gruneisen started out as a licensed stockbroker in August 1987, a couple of months prior to the historic stock market crash that took the Dow Jones Industrial Average down -22.6% in a single day. He has published daily fact-based fundamental and technical analysis on high-ranked stocks online for two decades. Through FACTBASEDINVESTING.COM, Kenneth provides educational articles, news, market commentary, and other information regarding proven investment systems that work in good times and bad.
Comments contained in the body of this report are technical opinions only and are not necessarily those of Gruneisen Growth Corp. The material herein has been obtained from sources believed to be reliable and accurate, however, its accuracy and completeness cannot be guaranteed. Our firm, employees, and customers may effect transactions, including transactions contrary to any recommendation herein, or have positions in the securities mentioned herein or options with respect thereto. Any recommendation contained in this report may not be suitable for all investors and it is not to be deemed an offer or solicitation on our part with respect to the purchase or sale of any securities. |
|
 |
Group Action Indecisive With Quietly Positive Bias
Kenneth J. Gruneisen - Passed the CAN SLIM® Master's Exam
There was no decisiveness on Friday in the group indexes regularly followed in this commentary. The Gold & Silver Index ($XAU -0.51%) edged lower, and the Integrated Oil Index ($XOI +1.25%) posted a gain while the Oil Services Index ($OSX +0.06%) ended virtually unchanged. The Retail Index ($RLX +0.13%) and the Bank Index ($BKX +0.50%) posted a modest gain, but the Broker/Dealer Index ($XBD -0.34%) ended slightly lower. The Healthcare Index ($HMO +0.60%) and Biotechnology Index ($BTK +0.61%) posted small gains while the Internet Index ($IIX -0.51%), Networking Index ($NWX -0.30%), and Semiconductor Index ($SOX -0.26%) quietly finished with small losses.
Charts courtesy www.stockcharts.com
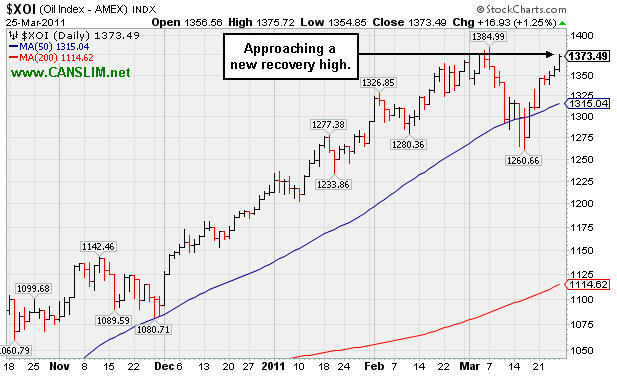
PICTURED: The Integrated Oil Index ($XOI +1.25%) is approaching a new recovery high.
| Oil Services |
$OSX |
289.29 |
+0.17 |
+0.06% |
+18.02% |
| Healthcare |
$HMO |
2,095.87 |
+12.41 |
+0.60% |
+23.87% |
| Integrated Oil |
$XOI |
1,373.49 |
+16.93 |
+1.25% |
+13.22% |
| Semiconductor |
$SOX |
436.27 |
-1.14 |
-0.26% |
+5.94% |
| Networking |
$NWX |
319.48 |
-0.96 |
-0.30% |
+13.87% |
| Internet |
$IIX |
313.50 |
-1.62 |
-0.51% |
+1.88% |
| Broker/Dealer |
$XBD |
120.52 |
-0.41 |
-0.34% |
-0.82% |
| Retail |
$RLX |
511.60 |
+0.67 |
+0.13% |
+0.63% |
| Gold & Silver |
$XAU |
214.66 |
-1.11 |
-0.51% |
-5.26% |
| Bank |
$BKX |
51.82 |
+0.26 |
+0.50% |
-0.75% |
| Biotech |
$BTK |
1,305.90 |
+7.95 |
+0.61% |
+0.64% |
|
|
|
 |
Distributional Pressure Evident While Advancing
Kenneth J. Gruneisen - Passed the CAN SLIM® Master's Exam
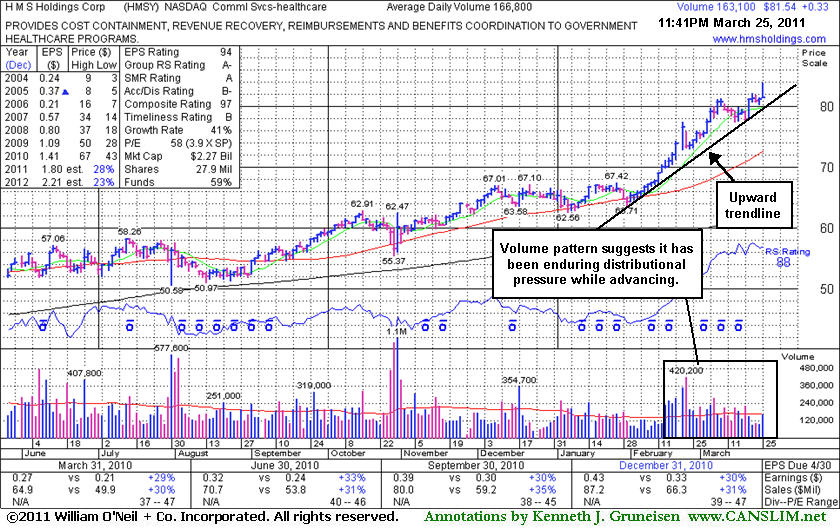
When a stock is at clear of all resistance due to overhead supply it can rally unhindered by the weight of anxious seller who own it at higher prices. This Commercial Services - Healthcare firm has maintained a solid sales revenues and earnings growth history that still satisfies the C and A criteria. The number of top-rated funds owning its shares has risen from 462 in Mar '10 to 503 in Dec '10, a very reassuring sign concerning the I criteria.
H M S Holdings Corp (HMSY +$0.33 or +0.41% to $81.54) hit a new 52-week high today, but then it erased most of its gain and finished near the session low. That was not as ominous as a "negative reversal" might have been, but it did suggest that it was facing profit taking pressure. The volume pattern suggests that it has been enduring some distributional pressure, even while it was advancing in recent weeks. It has been repeatedly noted as "extended from any sound base pattern", and yet it could go on to produce more climactic gains. The upward trendline defines an initial support level where a violation might raise concerns and be considered a "early sell signal" before support at its 50-day moving average (DMA) line. Since its last appearance in this FSU section on 2/16/11 with an annotated graph under the headline, "Earnings News Pending Following Persistent Gains", it reported earnings +30% on +31% sales revenues for the quarter ended December 31, 2010 versus the year ago period.
|
|
|
Color Codes Explained :
Y - Better candidates highlighted by our
staff of experts.
G - Previously featured
in past reports as yellow but may no longer be buyable under the
guidelines.
***Last / Change / Volume data in this table is the closing quote data***
Symbol/Exchange
Company Name
Industry Group |
PRICE |
CHANGE
(%Change) |
Day High |
Volume
(% DAV)
(% 50 day avg vol) |
52 Wk Hi
% From Hi |
Featured
Date |
Price
Featured |
Pivot Featured |
|
Max Buy |
BIDU
-
NASDAQ
Baidu Inc Ads
INTERNET - Internet Information Providers
|
$134.92
|
+1.45
1.08% |
$136.49
|
9,328,600
135.56% of 50 DAV
50 DAV is 6,881,600
|
$135.00
-0.06%
|
3/17/2011
|
$121.97
|
PP = $131.73
|
|
MB = $138.32
|
 Most Recent Note - 3/25/2011 11:55:01 AM
Y - Up today for a 5th consecutive gain and another new all-time high. Its gain with 2 times average volume on 3/23/11 triggered a technical buy signal after a riskier "late stage" set-up. The M criteria remains a concern until a follow-through day confirms the new rally and justifies new buying efforts under the system's strict guidelines. Prior high near $131 defines initial chart support to watch.
>>> The latest Featured Stock Update with an annotated graph appeared on 3/9/2011. Click here.
View all notes |
Alert me of new notes |
CANSLIM.net Company Profile |
SEC |
Zacks Reports |
StockTalk |
News |
Chart |
Request a new note
C
A N
S L
I M


|
CMG
-
NYSE
Chipotle Mexican Grill
LEISURE - Restaurants
|
$256.74
|
+5.76
2.30% |
$259.00
|
882,524
82.03% of 50 DAV
50 DAV is 1,075,900
|
$275.00
-6.64%
|
2/11/2011
|
$271.15
|
PP = $262.87
|
|
MB = $276.01
|
Most Recent Note - 3/25/2011 11:09:01 AM
G - Rising from support at its 50 DMA line with gains this week backed by light volume. Its recent low ($234.48 on 3/02/11) defines another important nearby level for chart readers to watch closely. Subsequent violations and damaging losses would raise greater concerns and trigger technical sell signals.
>>> The latest Featured Stock Update with an annotated graph appeared on 3/14/2011. Click here.
View all notes |
Alert me of new notes |
CANSLIM.net Company Profile |
SEC |
Zacks Reports |
StockTalk |
News |
Chart |
Request a new note
C
A N
S L
I M
|
CTCT
-
NASDAQ
Constant Contact Inc
MEDIA - Advertising Services
|
$35.26
|
+0.33
0.94% |
$35.48
|
415,176
108.71% of 50 DAV
50 DAV is 381,900
|
$35.98
-2.00%
|
3/22/2011
|
$33.59
|
PP = $32.49
|
|
MB = $34.11
|
Most Recent Note - 3/25/2011 11:11:34 AM
G - Perched at its all-time high, holding its ground stubbornly after a spurt of 3 consecutive gains with above average volume. Color code was changed to green after getting extended from its latest base. The M criteria remains an overriding concern until a follow-through day from at least one of the major averages confirms a new rally.
>>> The latest Featured Stock Update with an annotated graph appeared on 3/22/2011. Click here.
View all notes |
Alert me of new notes |
CANSLIM.net Company Profile |
SEC |
Zacks Reports |
StockTalk |
News |
Chart |
Request a new note
C
A N
S L
I M
|
CTSH
-
NASDAQ
Cognizant Tech Sol Cl A
COMPUTER SOFTWARE and SERVICES - Business Software and Services
|
$80.03
|
+0.24
0.30% |
$81.17
|
3,236,505
135.53% of 50 DAV
50 DAV is 2,388,100
|
$79.81
0.28%
|
2/7/2011
|
$75.09
|
PP = $76.46
|
|
MB = $80.28
|
Most Recent Note - 3/25/2011 11:15:48 AM
Y - Hitting another new 52-week high (N criteria) today, with no resistance remaining due to overhead supply. Volume on the prior session was only +11% above average while it rallied above its pivot point, not heavy enough to trigger a proper technical buy signal. Disciplined investors also know that a follow-through day (FTD) is needed to confirm the market direction (M criteria) is again favorable for new buying efforts.
>>> The latest Featured Stock Update with an annotated graph appeared on 3/17/2011. Click here.
View all notes |
Alert me of new notes |
CANSLIM.net Company Profile |
SEC |
Zacks Reports |
StockTalk |
News |
Chart |
Request a new note
C
A N
S L
I M
|
DECK
-
NASDAQ
Deckers Outdoor Corp
CONSUMER NON-DURABLES - Textile - Apparel Footwear
|
$83.31
|
+0.31
0.37% |
$85.22
|
781,870
51.78% of 50 DAV
50 DAV is 1,510,000
|
$94.70
-12.03%
|
2/3/2011
|
$79.61
|
PP = $82.67
|
|
MB = $86.80
|
Most Recent Note - 3/24/2011 11:45:47 AM
G - Inching back above its 50 DMA line with today's gain. A convincing rebound and close above that important short-term average would technically help its outlook improve.
>>> The latest Featured Stock Update with an annotated graph appeared on 3/3/2011. Click here.
View all notes |
Alert me of new notes |
CANSLIM.net Company Profile |
SEC |
Zacks Reports |
StockTalk |
News |
Chart |
Request a new note
C
A N
S L
I M
|
Symbol/Exchange
Company Name
Industry Group |
PRICE |
CHANGE
(%Change) |
Day High |
Volume
(% DAV)
(% 50 day avg vol) |
52 Wk Hi
% From Hi |
Featured
Date |
Price
Featured |
Pivot Featured |
|
Max Buy |
EBIX
-
NASDAQ
Ebix Inc
COMPUTER SOFTWARE and SERVICES - Business Software and Services
|
$23.48
|
+0.96
4.26% |
$24.07
|
8,924,479
967.74% of 50 DAV
50 DAV is 922,200
|
$30.35
-22.64%
|
2/28/2011
|
$25.70
|
PP = $25.97
|
|
MB = $27.27
|
Most Recent Note - 3/25/2011 4:56:12 PM
Made a stand at its 200 DMA line and near prior lows, posting a gain today with above average volume. Volume spiked to an amazing 14.8 million shares traded on the prior session, a total nearly half of its 30.6 million shares in the publicly traded float, while it fell abruptly from an all-time high, violating previously noted support and triggering technical sell signals. Based on the damaging technical action it will be dropped from the Featured Stocks list tonight.
>>> The latest Featured Stock Update with an annotated graph appeared on 2/28/2011. Click here.
View all notes |
Alert me of new notes |
CANSLIM.net Company Profile |
SEC |
Zacks Reports |
StockTalk |
News |
Chart |
Request a new note
C
A N
S L
I M
|
EZPW
-
NASDAQ
Ezcorp Inc Cl A
SPECIALTY RETAIL - Specialty Retail, Other
|
$31.18
|
+0.52
1.70% |
$31.80
|
637,419
165.05% of 50 DAV
50 DAV is 386,200
|
$31.76
-1.83%
|
2/18/2011
|
$27.94
|
PP = $30.04
|
|
MB = $31.54
|
Most Recent Note - 3/25/2011 1:06:04 PM
G - Gapped up again today and rallied above its "max buy" level. Color code is changed to green after getting extended from its latest base. As previously noted - "A follow-through day from at least one of the major averages (M criteria) is also necessary in order to justify new (or add-on) buying efforts under the system's guidelines."
>>> The latest Featured Stock Update with an annotated graph appeared on 3/10/2011. Click here.
View all notes |
Alert me of new notes |
CANSLIM.net Company Profile |
SEC |
Zacks Reports |
StockTalk |
News |
Chart |
Request a new note
C
A N
S L
I M
|
FOSL
-
NASDAQ
Fossil Inc
CONSUMER DURABLES - Recreational Goods, Other
|
$88.53
|
+3.01
3.52% |
$89.42
|
1,154,818
118.78% of 50 DAV
50 DAV is 972,200
|
$85.78
3.21%
|
2/1/2011
|
$73.30
|
PP = $74.44
|
|
MB = $78.16
|
Most Recent Note - 3/25/2011 10:31:43 AM
G - Up today for a 5th consecutive gain and another new all-time high, getting more extended from any sound base. Support to watch is at its 50 DMA line.
>>> The latest Featured Stock Update with an annotated graph appeared on 2/24/2011. Click here.
View all notes |
Alert me of new notes |
CANSLIM.net Company Profile |
SEC |
Zacks Reports |
StockTalk |
News |
Chart |
Request a new note
C
A N
S L
I M
|
HMSY
-
NASDAQ
H M S Holdings Corp
COMPUTER SOFTWARE and SERVICES - Healthcare Information Service
|
$81.54
|
+0.33
0.41% |
$83.98
|
163,128
97.80% of 50 DAV
50 DAV is 166,800
|
$82.18
-0.78%
|
11/19/2010
|
$61.89
|
PP = $63.01
|
|
MB = $66.16
|
Most Recent Note - 3/25/2011 11:51:16 PM
G - Hit a new 52-week high today but reversed and closed near the session low. It has endured distributional pressure while advancing in recent weeks, and it is extended from any sound base pattern. See the latest FSU analysis for additional details and a new annotated graph.
>>> The latest Featured Stock Update with an annotated graph appeared on 3/25/2011. Click here.
View all notes |
Alert me of new notes |
CANSLIM.net Company Profile |
SEC |
Zacks Reports |
StockTalk |
News |
Chart |
Request a new note
C
A N
S L
I M
|
HS
-
NYSE
Healthspring Inc
HEALTH SERVICES - Health Care Plans
|
$36.60
|
-1.37
-3.61% |
$36.80
|
6,612,343
1,108.15% of 50 DAV
50 DAV is 596,700
|
$39.19
-6.61%
|
3/22/2011
|
$38.29
|
PP = $38.85
|
|
MB = $40.79
|
Most Recent Note - 3/25/2011 12:21:56 PM
G - Gapped down today after pricing a new Public Offering of 7.5 million shares, still holding its ground near recent lows and well above its 50 DMA line. Color code was changed to green after slumping more than -7% below its pivot point. It failed to convincingly rally for a close above its pivot point after touching a new 52-week high on 3/22/11. See the latest FSU analysis for more details and an annotated graph.
>>> The latest Featured Stock Update with an annotated graph appeared on 3/23/2011. Click here.
View all notes |
Alert me of new notes |
CANSLIM.net Company Profile |
SEC |
Zacks Reports |
StockTalk |
News |
Chart |
Request a new note
C
A N
S L
I M
|
Symbol/Exchange
Company Name
Industry Group |
PRICE |
CHANGE
(%Change) |
Day High |
Volume
(% DAV)
(% 50 day avg vol) |
52 Wk Hi
% From Hi |
Featured
Date |
Price
Featured |
Pivot Featured |
|
Max Buy |
INFA
-
NASDAQ
Informatica Corp
COMPUTER SOFTWARE and SERVICES - Business Software and Services
|
$51.47
|
+1.07
2.12% |
$51.97
|
1,043,862
105.78% of 50 DAV
50 DAV is 986,800
|
$50.67
1.58%
|
3/24/2011
|
$50.04
|
PP = $49.86
|
|
MB = $52.35
|
Most Recent Note - 3/25/2011 11:36:53 AM
Y - Today's 6th consecutive gain helped it hit another new 52-week high. It triggered a technical buy signal as it rose with +42% above average volume (near the bare minimum per the investment system's guidelines for a proper technical buy signal) on 3/24/11 while breaking out from an orderly flat base pattern during which its 50 DMA line acted as support. The graph below was included in the mid-day report as this Redwood City, CA-based Computer Software - Database firm showed strong characteristics. Its sales revenues and earnings increases for the 3 most recent quarters (Jun, Sep, Dec '10) were above the +25% minimum guidelines and it has maintained a steady annual earnings (A criteria) history. The M criteria remains a concern until a FTD provides a reassuring sign confirming that odds are most favorable for investors.
>>> The latest Featured Stock Update with an annotated graph appeared on 3/8/2006. Click here.
View all notes |
Alert me of new notes |
CANSLIM.net Company Profile |
SEC |
Zacks Reports |
StockTalk |
News |
Chart |
Request a new note
C
A N
S L
I M
|
LULU
-
NASDAQ
Lululemon Athletica
MANUFACTURING - Textile Manufacturing
|
$78.64
|
-0.17
-0.22% |
$80.06
|
1,897,180
89.12% of 50 DAV
50 DAV is 2,128,800
|
$85.28
-7.79%
|
1/26/2011
|
$68.11
|
PP = $74.70
|
|
MB = $78.44
|
Most Recent Note - 3/23/2011 6:53:33 PM
G - Rising from support at its 50 DMA line, a classic chart support level. It has to look of a base-on-base type pattern and is perched -7.0% off its all-time high.
>>> The latest Featured Stock Update with an annotated graph appeared on 2/25/2011. Click here.
View all notes |
Alert me of new notes |
CANSLIM.net Company Profile |
SEC |
Zacks Reports |
StockTalk |
News |
Chart |
Request a new note
C
A N
S L
I M
|
MG
-
NYSE
Mistras Group Inc
DIVERSIFIED SERVICES - Bulding and Faci;ity Management Services
|
$17.11
|
+0.08
0.47% |
$17.23
|
78,267
74.40% of 50 DAV
50 DAV is 105,200
|
$17.10
0.06%
|
3/15/2011
|
$15.48
|
PP = $15.90
|
|
MB = $16.70
|
Most Recent Note - 3/25/2011 5:05:59 PM
G - Inched up for another new high today after stubbornly holding its ground. It is getting more extended from a sound base pattern. Prior highs and its 50 DMA line define important support to watch.
>>> The latest Featured Stock Update with an annotated graph appeared on 3/15/2011. Click here.
View all notes |
Alert me of new notes |
CANSLIM.net Company Profile |
SEC |
Zacks Reports |
StockTalk |
News |
Chart |
Request a new note
C
A N
S L
I M
|
MWIV
-
NASDAQ
M W I Veterinary Supply
HEALTH SERVICES - Medical Instruments and; Supplies
|
$75.34
|
+0.02
0.03% |
$76.07
|
91,732
99.06% of 50 DAV
50 DAV is 92,600
|
$78.48
-4.00%
|
11/4/2010
|
$61.79
|
PP = $59.60
|
|
MB = $62.58
|
Most Recent Note - 3/23/2011 7:04:30 PM
G - Holding its ground in a tight range perched -2.1% off its all-time high. It is extended from any sound base pattern.
>>> The latest Featured Stock Update with an annotated graph appeared on 3/8/2011. Click here.
View all notes |
Alert me of new notes |
CANSLIM.net Company Profile |
SEC |
Zacks Reports |
StockTalk |
News |
Chart |
Request a new note
C
A N
S L
I M
|
OPEN
-
NASDAQ
Opentable Inc
INTERNET - Internet Software and Services
|
$101.69
|
+3.04
3.08% |
$103.73
|
1,987,837
182.02% of 50 DAV
50 DAV is 1,092,100
|
$99.00
2.72%
|
3/17/2011
|
$90.71
|
PP = $96.07
|
|
MB = $100.87
|
Most Recent Note - 3/25/2011 12:41:56 PM
G - Gapped up today, rallying for a new all-time high well above its "max buy" level, and its color code was changed to green. Triggered a technical buy signal on 3/24/11 and quickly got extended from its latest base. See the latest FSU analysis for details and a new annotated graph.
>>> The latest Featured Stock Update with an annotated graph appeared on 3/24/2011. Click here.
View all notes |
Alert me of new notes |
CANSLIM.net Company Profile |
SEC |
Zacks Reports |
StockTalk |
News |
Chart |
Request a new note
C
A N
S L
I M
|
Symbol/Exchange
Company Name
Industry Group |
PRICE |
CHANGE
(%Change) |
Day High |
Volume
(% DAV)
(% 50 day avg vol) |
52 Wk Hi
% From Hi |
Featured
Date |
Price
Featured |
Pivot Featured |
|
Max Buy |
PAY
-
NYSE
Verifone Systems Inc
COMPUTER HARDWARE - Transaction Automation Systems
|
$52.80
|
-0.65
-1.22% |
$53.75
|
1,722,859
91.60% of 50 DAV
50 DAV is 1,880,900
|
$54.04
-2.29%
|
1/27/2011
|
$41.77
|
PP = $44.97
|
|
MB = $47.22
|
Most Recent Note - 3/23/2011 7:02:47 PM
G - Gain today on light volume for a new high close. Repeatedly noted - "No resistance remains due to overhead supply, but it is extended from a sound base pattern. Its 50 DMA line defines chart support to watch."
>>> The latest Featured Stock Update with an annotated graph appeared on 3/2/2011. Click here.
View all notes |
Alert me of new notes |
CANSLIM.net Company Profile |
SEC |
Zacks Reports |
StockTalk |
News |
Chart |
Request a new note
C
A N
S L
I M
|
PCLN
-
NASDAQ
Priceline.Com Inc
INTERNET - Internet Software and Services
|
$487.00
|
+10.99
2.31% |
$490.39
|
1,236,035
106.99% of 50 DAV
50 DAV is 1,155,300
|
$478.00
1.88%
|
1/3/2011
|
$399.55
|
PP = $428.20
|
|
MB = $449.61
|
Most Recent Note - 3/25/2011 11:20:55 PM
G - Rose to a new 52-week high with a third consecutive gain on average volume, getting extended from any sound base pattern. Its 50 DMA line has defined support.
>>> The latest Featured Stock Update with an annotated graph appeared on 3/21/2011. Click here.
View all notes |
Alert me of new notes |
CANSLIM.net Company Profile |
SEC |
Zacks Reports |
StockTalk |
News |
Chart |
Request a new note
C
A N
S L
I M
|
RAX
-
NYSE
Rackspace Hosting Inc
INTERNET - Internet Software and; Services
|
$38.54
|
+0.74
1.96% |
$39.73
|
1,811,539
101.33% of 50 DAV
50 DAV is 1,787,800
|
$40.62
-5.12%
|
3/16/2011
|
$36.28
|
PP = $40.72
|
|
MB = $42.76
|
Most Recent Note - 3/25/2011 10:41:57 AM
Y - Approaching its 52-week high and pivot point on the right side of an orderly 7-week flat base after finding support at its 50 DMA line. This high-ranked leader has strong fundamental and technical characteristics, and a breakout with volume may trigger a buy signal, however the M criteria is still an overriding concern.
>>> The latest Featured Stock Update with an annotated graph appeared on 3/16/2011. Click here.
View all notes |
Alert me of new notes |
CANSLIM.net Company Profile |
SEC |
Zacks Reports |
StockTalk |
News |
Chart |
Request a new note
C
A N
S L
I M
|
TIBX
-
NASDAQ
Tibco Software Inc
COMPUTER SOFTWARE and SERVICES - Business Software and Services
|
$26.34
|
+0.22
0.84% |
$26.77
|
2,327,795
96.78% of 50 DAV
50 DAV is 2,405,300
|
$26.37
-0.11%
|
3/18/2011
|
$23.88
|
PP = $26.04
|
|
MB = $27.34
|
Most Recent Note - 3/24/2011 11:36:16 AM
Y - Gapped up today and rallied to a new 52-week high, clear of all resistance. Volume is running at an above average pace while it has risen above its pivot point, and a strong close with at least +50% above average volume may trigger a technical buy signal. However, the M criteria remains an overriding concern for disciplined investors until the rally attempt is confirmed with a follow-through day from at least one of the major averages.
>>> The latest Featured Stock Update with an annotated graph appeared on 3/18/2011. Click here.
View all notes |
Alert me of new notes |
CANSLIM.net Company Profile |
SEC |
Zacks Reports |
StockTalk |
News |
Chart |
Request a new note
C
A N
S L
I M
|
UA
-
NYSE
Under Armour Inc Cl A
CONSUMER NON-DURABLES - Textile - Apparel Clothing
|
$65.79
|
+0.54
0.83% |
$67.10
|
495,269
62.31% of 50 DAV
50 DAV is 794,900
|
$70.69
-6.93%
|
1/27/2011
|
$58.31
|
PP = $56.99
|
|
MB = $59.84
|
Most Recent Note - 3/25/2011 11:20:49 AM
G - Quietly holding its ground this week above its 50 DMA line and recent lows defining important chart support. It may be forming a base-on-base pattern, but more damaging losses would hurt its outlook.
>>> The latest Featured Stock Update with an annotated graph appeared on 3/7/2011. Click here.
View all notes |
Alert me of new notes |
CANSLIM.net Company Profile |
SEC |
Zacks Reports |
StockTalk |
News |
Chart |
Request a new note
C
A N
S L
I M
|
Symbol/Exchange
Company Name
Industry Group |
PRICE |
CHANGE
(%Change) |
Day High |
Volume
(% DAV)
(% 50 day avg vol) |
52 Wk Hi
% From Hi |
Featured
Date |
Price
Featured |
Pivot Featured |
|
Max Buy |
ULTA
-
NASDAQ
Ulta Salon Cosm & Frag
SPECIALTY RETAIL - Specialty Retail, Other
|
$47.65
|
-0.19
-0.39% |
$48.45
|
325,212
52.61% of 50 DAV
50 DAV is 618,200
|
$48.43
-1.61%
|
1/6/2011
|
$36.12
|
PP = $37.34
|
|
MB = $39.21
|
Most Recent Note - 3/25/2011 11:22:23 AM
G - Quietly touched a new all-time high today. Stubbornly holding its ground after a spurt of volume-driven gains. Support to watch is at its 50 DMA line and recent chart lows near the $40 level.
>>> The latest Featured Stock Update with an annotated graph appeared on 2/17/2011. Click here.
View all notes |
Alert me of new notes |
CANSLIM.net Company Profile |
SEC |
Zacks Reports |
StockTalk |
News |
Chart |
Request a new note
C
A N
S L
I M
|
|
|
|
THESE ARE NOT BUY RECOMMENDATIONS!
Comments contained in the body of this report are technical
opinions only. The material herein has been obtained
from sources believed to be reliable and accurate, however,
its accuracy and completeness cannot be guaranteed.
This site is not an investment advisor, hence it does
not endorse or recommend any securities or other investments.
Any recommendation contained in this report may not
be suitable for all investors and it is not to be deemed
an offer or solicitation on our part with respect to
the purchase or sale of any securities. All trademarks,
service marks and trade names appearing in this report
are the property of their respective owners, and are
likewise used for identification purposes only.
This report is a service available
only to active Paid Premium Members.
You may opt-out of receiving report notifications
at any time. Questions or comments may be submitted
by writing to Premium Membership Services 665 S.E. 10 Street, Suite 201 Deerfield Beach, FL 33441-5634 or by calling 1-800-965-8307
or 954-785-1121.
|
|
|

