You are not logged in.
This means you
CAN ONLY VIEW reports that were published prior to Tuesday, April 15, 2025.
You
MUST UPGRADE YOUR MEMBERSHIP if you want to see any current reports.
AFTER MARKET UPDATE - THURSDAY, MARCH 24TH, 2011
Previous After Market Report Next After Market Report >>>
|
|
|
|
DOW |
+84.54 |
12,170.56 |
+0.70% |
|
Volume |
870,600,940 |
-1% |
|
Volume |
1,929,577,350 |
+12% |
|
NASDAQ |
+38.12 |
2,736.42 |
+1.41% |
|
Advancers |
1,958 |
63% |
|
Advancers |
1,686 |
62% |
|
S&P 500 |
+12.12 |
1,309.66 |
+0.93% |
|
Decliners |
1,031 |
33% |
|
Decliners |
937 |
35% |
|
Russell 2000 |
+5.86 |
817.10 |
+0.72% |
|
52 Wk Highs |
135 |
|
|
52 Wk Highs |
110 |
|
|
S&P 600 |
+2.80 |
432.56 |
+0.65% |
|
52 Wk Lows |
13 |
|
|
52 Wk Lows |
23 |
|
|
Many members have told us they enjoy the occasional "Ken's Mailbag Q&A" articles. In the past the articles have allowed us to leverage our experts' answers to some great questions from our members. TONIGHT make sure to read Ken's Mailbag in the After Market Update just below the Featured Stock Update table.
Please use the inquiry form to submit any questions you may have. Everyone might benefit if more great Q&A's are included in upcoming Ken's Mailbag articles! Your questions may also be answered in the upcoming Q1 2011 CANSLIM.net Webcast scheduled for March 30, 2011 at 8PM EST and available "on demand" afterward. We will always maintain your privacy, so free to ask whatever you want. The only stupid question is the one you didn't ask, or so it has been said.
Additionally, we want to repeat the following disclaimer (below) which is included at the footer of all pages within the website. It is also included routinely in the emails we send, but it was unintentionally left off a recent email announcement that was forwarded to some of our existing members following the March 21, 2011 issue of Barron's which favorably mentioned www.CANSLIM.net in an article titled "Where to Gather Momentum" on page 31. (You may be able to view it here too - http://online.barrons.com/article/SB50001424052970204011504576200630715822902.html)
The names "CANSLIM" and "CAN SLIM®" are service marks and trade names of Investor's Business Daily, Inc., a California corporation, and are used by Gruneisen Growth Corp., a Florida corporation, under license. GGC is solely responsible for the operation of and opinions expressed in this Website. Daily Graphs® and Daily Graphs Online® are registered trademarks of William O'Neil + Co. Incorporated and are used with permission.
|
 |
Major Averages Gain Momentum While Leadership Expands
Kenneth J. Gruneisen - Passed the CAN SLIM® Master's Exam
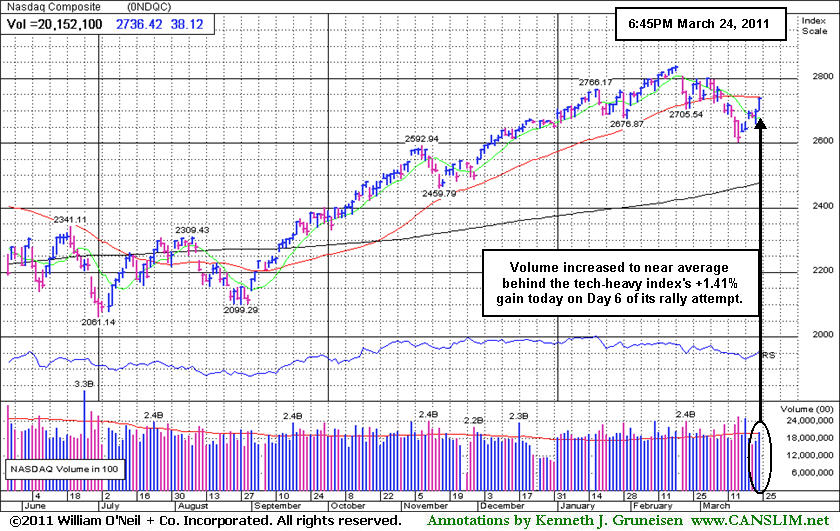
Technology stocks led the way as the market posted a second straight session of broad gains and positive momentum continued on Thursday. The volume total on the NYSE was reported slightly lower as the big cap indexes posted gains of less than +1%. The total volume was reported higher on the Nasdaq exchange, but the percentage gain posted by the tech-heavy Nasdaq Composite Index was not as big as the +1.7% gain needed to be considered a solid follow-through day (FTD). Advancing issues beat decliners by nearly 2-1 on the both the NYSE and the Nasdaq exchange. New 52-week highs outnumbered new 52-week lows on the Nasdaq exchange and on the NYSE. There were 73 high-ranked companies from the CANSLIM.net Leaders List that made new 52-week highs and appeared on the CANSLIM.net BreakOuts Page, up considerably from a total of 39 on the prior session. On the Featured Stocks Page there were gains from 17 of the 21 high-ranked market leaders currently listed.
Two economic reports appeared to have little impact on trading. Durable goods bookings declined 0.9% in February. While the decline was unexpected, January orders were revised higher. Initial jobless claims fell 3,000 to 382,000 in the latest week, in line with expectations. Concerns about Europe were pushed to the back burner as EU leaders met to present a plan to solve the region's debt crisis. Stronger corporate profits and signs the job market may be improving helped the markets overcome jitters about high oil prices. Oil traded above $106 per barrel to its highest level since 2008 and gold touched a record early in the day before closing lower. Oil prices slipped from a 30-month high, dropping for the first time in four days.
Chip-maker Micron Technology Inc (MU +8.39%) and software company Red Hat Inc (RHAT +18.24%) posted earnings that beat analyst estimates. Gamestop Corp (GME +2.94%), a retailer of video games, forecast profit above analyst projections. Scholastic Corp (SCHL -11.2%) cuts its forecast for full-year earnings and the shares tumbled.
The bullish action of late did not meet the strict definition of a follow-through day (FTD), however the great expansion leadership (new 52-week highs) is a sign that the market has a healthy crop of strong leaders underpinning the latest rally effort. Coupled with the new leadership, the Dow Jones Industrial Average, S&P 500 Index, and the S&P Mid-Cap 400 and S&P Small-Cap 600 indexes have collectively rallied back to well above their respective 50-day moving average (DMA) lines. Since the last day of heavy distribution on March 16th, the institutional crowd has shown more encouraging signs of accumulation again. Even after a convincing FTD, new buying efforts should always be cautiously and carefully made only when all of the investment system's key criteria are met.
PICTURED: The Nasdaq Composite Index's volume increased to near average behind its +1.41% gain today on Day 6 of its new rally attempt.
|
 Kenneth J. Gruneisen started out as a licensed stockbroker in August 1987, a couple of months prior to the historic stock market crash that took the Dow Jones Industrial Average down -22.6% in a single day. He has published daily fact-based fundamental and technical analysis on high-ranked stocks online for two decades. Through FACTBASEDINVESTING.COM, Kenneth provides educational articles, news, market commentary, and other information regarding proven investment systems that work in good times and bad.
Comments contained in the body of this report are technical opinions only and are not necessarily those of Gruneisen Growth Corp. The material herein has been obtained from sources believed to be reliable and accurate, however, its accuracy and completeness cannot be guaranteed. Our firm, employees, and customers may effect transactions, including transactions contrary to any recommendation herein, or have positions in the securities mentioned herein or options with respect thereto. Any recommendation contained in this report may not be suitable for all investors and it is not to be deemed an offer or solicitation on our part with respect to the purchase or sale of any securities. |
|
 |
Healthcare, Retail, and Tech Indexes Led Broad Gains
Kenneth J. Gruneisen - Passed the CAN SLIM® Master's Exam
The Retail Index ($RLX +1.50%) rose and a strong tech sector rally brought solid gains from the Semiconductor Index ($SOX +2.45%), Networking Index ($NWX +1.51%), Biotechnology Index ($BTK +1.55%), and Internet Index ($IIX +2.05%). The Healthcare Index ($HMO +2.02%) also posted a solid gain. The Bank Index ($BKX +0.31%) and Broker/Dealer Index ($XBD +0.47%) posted only modest gains. Energy-related shares also had a mildly positive bias as the Oil Services Index ($OSX +0.45%) and Integrated Oil Index ($XOI +0.54%) posted modest gains. The Gold & Silver Index ($XAU -0.78%) ended a 5-session winning streak with a small loss.
Charts courtesy www.stockcharts.com
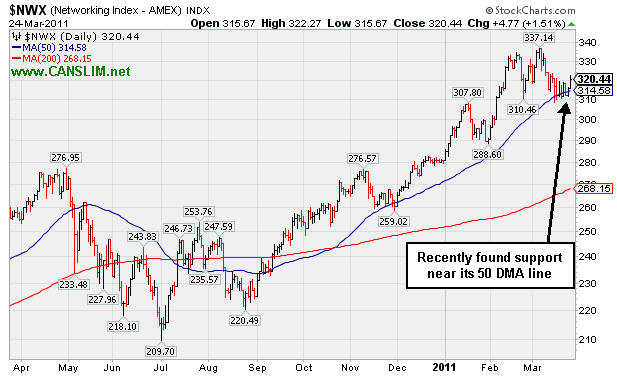
PICTURED: The Networking Index ($NWX +1.51%) has been one of the leading tech sector indexes in recent months. It has recently found support near its 50-day moving average (DMA) line.
| Oil Services |
$OSX |
289.12 |
+1.29 |
+0.45% |
+17.95% |
| Healthcare |
$HMO |
2,083.46 |
+41.25 |
+2.02% |
+23.14% |
| Integrated Oil |
$XOI |
1,356.56 |
+7.23 |
+0.54% |
+11.82% |
| Semiconductor |
$SOX |
437.41 |
+10.47 |
+2.45% |
+6.21% |
| Networking |
$NWX |
320.44 |
+4.78 |
+1.51% |
+14.22% |
| Internet |
$IIX |
315.12 |
+6.34 |
+2.05% |
+2.40% |
| Broker/Dealer |
$XBD |
120.92 |
+0.56 |
+0.47% |
-0.49% |
| Retail |
$RLX |
510.93 |
+7.57 |
+1.50% |
+0.50% |
| Gold & Silver |
$XAU |
215.77 |
-1.69 |
-0.78% |
-4.77% |
| Bank |
$BKX |
51.56 |
+0.16 |
+0.31% |
-1.24% |
| Biotech |
$BTK |
1,297.95 |
+19.83 |
+1.55% |
+0.02% |
|
|
|
 |
Technical Breakout From Another Sound Base Pattern
Kenneth J. Gruneisen - Passed the CAN SLIM® Master's Exam
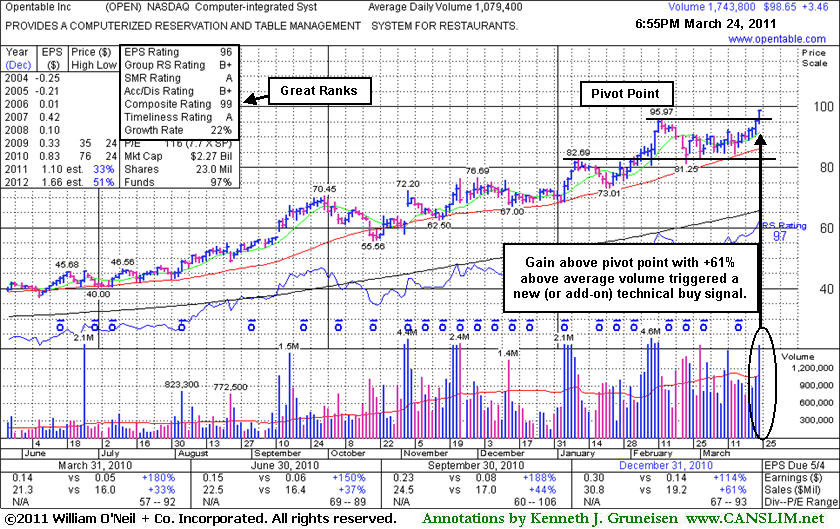
Opentable Inc. (OPEN +$3.46 or +3.63% to $99.65) hit a new all-time high today with +61% above average volume behind its solid gain above its pivot point, triggering a new (or add-on) technical buy signal. Since its last appearance in this FSU section with detailed analysis and an annotated graph on 2/15/11 under the headline, "Strong Earnings Underpin Bullish Performance", it consolidated and built a sound new base above its 50-day moving average (DMA) line. A new pivot point was cited on March 17th.
The C criteria is solidly satisfied as earnings and sales revenues increases have been strong in the 5 latest quarterly comparisons versus the year ago period. Its current Up/Down Volume Ratio of 1.7 provides an unbiased indication of institutional accumulation, aside from its favorable B+ rating for Accumulation/Distribution.
The company's management still owns a 32% stake in its shares, keeping them motivated to look after and build shareholder value. Of course, they also may be inclined to employ the help of an underwriter to complete a Secondary Offering at some future point, although no such news has been announced. Meanwhile, the number of top-rated funds owning shares rose from 167 in Dec '09 to 320 in Dec '10, a very reassuring sign concerning the I criteria. It could go on to produce more climactic gains, but disciplined investors know 3 out of 4 stocks follow the direction of the major averages (M criteria), and a convincing follow-through day by strict definition did not yet occur.
|
|
|
Color Codes Explained :
Y - Better candidates highlighted by our
staff of experts.
G - Previously featured
in past reports as yellow but may no longer be buyable under the
guidelines.
***Last / Change / Volume data in this table is the closing quote data***
Symbol/Exchange
Company Name
Industry Group |
PRICE |
CHANGE
(%Change) |
Day High |
Volume
(% DAV)
(% 50 day avg vol) |
52 Wk Hi
% From Hi |
Featured
Date |
Price
Featured |
Pivot Featured |
|
Max Buy |
BIDU
-
NASDAQ
Baidu Inc Ads
INTERNET - Internet Information Providers
|
$133.48
|
+0.90
0.68% |
$135.00
|
9,868,515
145.30% of 50 DAV
50 DAV is 6,791,700
|
$133.97
-0.37%
|
3/17/2011
|
$121.97
|
PP = $131.73
|
|
MB = $138.32
|
 Most Recent Note - 3/24/2011 11:52:36 AM
Y - Holding its ground today after a gain with 2 times average volume for a new all-time high on 3/23/11, rallying above its pivot point triggering a technical buy signal after a riskier "late stage" set-up. Disciplined investors know that a follow-through day from at least one of the major averages (M criteria) is necessary in order to justify new (or add-on) buying efforts under the system's guidelines. Its 50 DMA line defines important chart support to watch.
>>> The latest Featured Stock Update with an annotated graph appeared on 3/9/2011. Click here.
View all notes |
Alert me of new notes |
CANSLIM.net Company Profile |
SEC |
Zacks Reports |
StockTalk |
News |
Chart |
Request a new note
C
A N
S L
I M


|
CMG
-
NYSE
Chipotle Mexican Grill
LEISURE - Restaurants
|
$250.98
|
+4.00
1.62% |
$251.00
|
791,772
73.26% of 50 DAV
50 DAV is 1,080,800
|
$275.00
-8.73%
|
2/11/2011
|
$271.15
|
PP = $262.87
|
|
MB = $276.01
|
Most Recent Note - 3/22/2011 6:49:31 PM
G - It has slumped -11.3% off its all-time high and it is testing support at its 50 DMA line. Its recent low ($234.48 on 3/02/11) defines another important nearby level for chart readers to watch closely. Subsequent violations and damaging losses would raise greater concerns and trigger technical sell signals.
>>> The latest Featured Stock Update with an annotated graph appeared on 3/14/2011. Click here.
View all notes |
Alert me of new notes |
CANSLIM.net Company Profile |
SEC |
Zacks Reports |
StockTalk |
News |
Chart |
Request a new note
C
A N
S L
I M
|
CTCT
-
NASDAQ
Constant Contact Inc
MEDIA - Advertising Services
|
$34.93
|
-0.13
-0.37% |
$35.98
|
562,014
150.03% of 50 DAV
50 DAV is 374,600
|
$35.36
-1.22%
|
3/22/2011
|
$33.59
|
PP = $32.49
|
|
MB = $34.11
|
Most Recent Note - 3/23/2011 6:17:44 PM
G - Posted a 3rd consecutive gain for a new high today following a technical breakout. Color code is changed to green after rallying beyond the "max buy" level. The bullish action warrants attention, however the M criteria remains an overriding concern until a follow-through day from at least one of the major averages confirms a new rally.
>>> The latest Featured Stock Update with an annotated graph appeared on 3/22/2011. Click here.
View all notes |
Alert me of new notes |
CANSLIM.net Company Profile |
SEC |
Zacks Reports |
StockTalk |
News |
Chart |
Request a new note
C
A N
S L
I M
|
CTSH
-
NASDAQ
Cognizant Tech Sol Cl A
COMPUTER SOFTWARE and SERVICES - Business Software and Services
|
$79.79
|
+2.92
3.80% |
$79.81
|
2,635,506
111.02% of 50 DAV
50 DAV is 2,373,900
|
$78.69
1.40%
|
2/7/2011
|
$75.09
|
PP = $76.46
|
|
MB = $80.28
|
Most Recent Note - 3/24/2011 11:28:56 AM
Y - Rallied for a new 52-week high (N criteria) after gapping up today, rising clear of all resistance due to overhead supply. A strong close with well above average volume may trigger a technical buy signal, yet disciplined investors know caution is advised until a follow-through day confirms the market direction (M criteria) is again favorable for new buying efforts.
>>> The latest Featured Stock Update with an annotated graph appeared on 3/17/2011. Click here.
View all notes |
Alert me of new notes |
CANSLIM.net Company Profile |
SEC |
Zacks Reports |
StockTalk |
News |
Chart |
Request a new note
C
A N
S L
I M
|
DECK
-
NASDAQ
Deckers Outdoor Corp
CONSUMER NON-DURABLES - Textile - Apparel Footwear
|
$83.00
|
+2.16
2.67% |
$83.18
|
888,625
58.10% of 50 DAV
50 DAV is 1,529,400
|
$94.70
-12.35%
|
2/3/2011
|
$79.61
|
PP = $82.67
|
|
MB = $86.80
|
Most Recent Note - 3/24/2011 11:45:47 AM
G - Inching back above its 50 DMA line with today's gain. A convincing rebound and close above that important short-term average would technically help its outlook improve.
>>> The latest Featured Stock Update with an annotated graph appeared on 3/3/2011. Click here.
View all notes |
Alert me of new notes |
CANSLIM.net Company Profile |
SEC |
Zacks Reports |
StockTalk |
News |
Chart |
Request a new note
C
A N
S L
I M
|
Symbol/Exchange
Company Name
Industry Group |
PRICE |
CHANGE
(%Change) |
Day High |
Volume
(% DAV)
(% 50 day avg vol) |
52 Wk Hi
% From Hi |
Featured
Date |
Price
Featured |
Pivot Featured |
|
Max Buy |
EBIX
-
NASDAQ
Ebix Inc
COMPUTER SOFTWARE and SERVICES - Business Software and Services
|
$22.52
|
-7.20
-24.23% |
$30.35
|
14,975,565
2,376.32% of 50 DAV
50 DAV is 630,200
|
$29.86
-24.58%
|
2/28/2011
|
$25.70
|
PP = $25.97
|
|
MB = $27.27
|
Most Recent Note - 3/24/2011 5:35:21 PM
G - Volume spiked to an amazing 14.8 million shares traded on the session, a total nearly half of its 30.6 million shares in the publicly traded float, while it fell abruptly in the final 2 hours. The result was a damaging negative reversal after a gap up for a new all-time high. Its considerable loss violated prior highs in the $25-26 area and its 50 DMA line, previously noted for weeks as important support to watch, triggering technical sell signals. It closed above its 200 DMA line after nearly testing its November 2010 lows.
>>> The latest Featured Stock Update with an annotated graph appeared on 2/28/2011. Click here.
View all notes |
Alert me of new notes |
CANSLIM.net Company Profile |
SEC |
Zacks Reports |
StockTalk |
News |
Chart |
Request a new note
C
A N
S L
I M
|
EZPW
-
NASDAQ
Ezcorp Inc Cl A
SPECIALTY RETAIL - Specialty Retail, Other
|
$30.66
|
+0.47
1.56% |
$31.76
|
892,911
238.81% of 50 DAV
50 DAV is 373,900
|
$30.61
0.16%
|
2/18/2011
|
$27.94
|
PP = $30.04
|
|
MB = $31.54
|
Most Recent Note - 3/24/2011 12:06:33 PM
Y - Gapped up today and now trading near its "max buy" level. A solid gain on 3/23/11 with +69% above average volume for a new 52-week high helped it break out above its pivot point triggering a technical buy signal. Also confirming the N criteria, it announced a new global strategic alliance with second hand goods retailer Cash Converters International. As previously noted - "A follow-through day from at least one of the major averages (M criteria) is also necessary in order to justify new (or add-on) buying efforts under the system's guidelines."
>>> The latest Featured Stock Update with an annotated graph appeared on 3/10/2011. Click here.
View all notes |
Alert me of new notes |
CANSLIM.net Company Profile |
SEC |
Zacks Reports |
StockTalk |
News |
Chart |
Request a new note
C
A N
S L
I M
|
FOSL
-
NASDAQ
Fossil Inc
CONSUMER DURABLES - Recreational Goods, Other
|
$85.52
|
+1.19
1.41% |
$85.78
|
802,961
81.97% of 50 DAV
50 DAV is 979,600
|
$85.20
0.38%
|
2/1/2011
|
$73.30
|
PP = $74.44
|
|
MB = $78.16
|
Most Recent Note - 3/21/2011 2:47:32 PM
G - Up today with lighter volume. It has not formed a sound base. It found support at its 50 DMA line while consolidating above prior resistance in the $74 area.
>>> The latest Featured Stock Update with an annotated graph appeared on 2/24/2011. Click here.
View all notes |
Alert me of new notes |
CANSLIM.net Company Profile |
SEC |
Zacks Reports |
StockTalk |
News |
Chart |
Request a new note
C
A N
S L
I M
|
HMSY
-
NASDAQ
H M S Holdings Corp
COMPUTER SOFTWARE and SERVICES - Healthcare Information Service
|
$81.21
|
+0.26
0.32% |
$81.42
|
96,042
57.20% of 50 DAV
50 DAV is 167,900
|
$82.18
-1.18%
|
11/19/2010
|
$61.89
|
PP = $63.01
|
|
MB = $66.16
|
Most Recent Note - 3/21/2011 10:12:14 AM
G - Rallying within close striking distance of its 52-week high today after a brief consolidation, not a sound new base. Support to watch is its 50 DMA line.
>>> The latest Featured Stock Update with an annotated graph appeared on 2/16/2011. Click here.
View all notes |
Alert me of new notes |
CANSLIM.net Company Profile |
SEC |
Zacks Reports |
StockTalk |
News |
Chart |
Request a new note
C
A N
S L
I M
|
HS
-
NYSE
Healthspring Inc
HEALTH SERVICES - Health Care Plans
|
$37.97
|
+0.38
1.01% |
$38.15
|
360,365
60.04% of 50 DAV
50 DAV is 600,200
|
$39.19
-3.11%
|
3/22/2011
|
$38.29
|
PP = $38.85
|
|
MB = $40.79
|
Most Recent Note - 3/23/2011 8:12:04 PM
Y - Pulled back today after failing to convincingly rally for a close above its pivot point. It touched a new 52-week high on the prior session and finished at a new high close with +69% above average volume behind its gain. After an orderly flat base near minimum length its color code was changed to yellow with pivot point cited based on its 52-week high plus 10 cents when featured in the 3/22/11 mid-day report. See the latest FSU analysis for more details and an annotated graph.
>>> The latest Featured Stock Update with an annotated graph appeared on 3/23/2011. Click here.
View all notes |
Alert me of new notes |
CANSLIM.net Company Profile |
SEC |
Zacks Reports |
StockTalk |
News |
Chart |
Request a new note
C
A N
S L
I M
|
Symbol/Exchange
Company Name
Industry Group |
PRICE |
CHANGE
(%Change) |
Day High |
Volume
(% DAV)
(% 50 day avg vol) |
52 Wk Hi
% From Hi |
Featured
Date |
Price
Featured |
Pivot Featured |
|
Max Buy |
INFA
-
NASDAQ
Informatica Corp
COMPUTER SOFTWARE and SERVICES - Business Software and Services
|
$50.40
|
+1.75
3.60% |
$50.67
|
1,396,655
142.76% of 50 DAV
50 DAV is 978,300
|
$49.77
1.28%
|
3/24/2011
|
$50.04
|
PP = $49.86
|
|
MB = $52.35
|
Most Recent Note - 3/24/2011
Y - Gapped up today and hit a new 52-week high, rising from an orderly flat base pattern during which its 50 DMA line acted as support. Color code is changed to yellow with pivot point cited based upon its 52-week high plus 10 cents. This Redwood City, CA-based Computer Software - Database firm showed strong sales revenues and earnings increases for the 3 most recent quarters (Jun, Sep, Dec '10) above the +25% minimum guidelines and it has maintained a steady annual earnings (A criteria) history. Volume-driven gains above its pivot point coupled with a FTD (confirming the M criteria) would be reassuring signs confirming a technical buy signal. 
>>> The latest Featured Stock Update with an annotated graph appeared on 3/8/2006. Click here.
View all notes |
Alert me of new notes |
CANSLIM.net Company Profile |
SEC |
Zacks Reports |
StockTalk |
News |
Chart |
Request a new note
C
A N
S L
I M
|
LULU
-
NASDAQ
Lululemon Athletica
MANUFACTURING - Textile Manufacturing
|
$78.81
|
-0.47
-0.59% |
$80.97
|
1,869,350
87.80% of 50 DAV
50 DAV is 2,129,000
|
$85.28
-7.59%
|
1/26/2011
|
$68.11
|
PP = $74.70
|
|
MB = $78.44
|
Most Recent Note - 3/23/2011 6:53:33 PM
G - Rising from support at its 50 DMA line, a classic chart support level. It has to look of a base-on-base type pattern and is perched -7.0% off its all-time high.
>>> The latest Featured Stock Update with an annotated graph appeared on 2/25/2011. Click here.
View all notes |
Alert me of new notes |
CANSLIM.net Company Profile |
SEC |
Zacks Reports |
StockTalk |
News |
Chart |
Request a new note
C
A N
S L
I M
|
MG
-
NYSE
Mistras Group Inc
DIVERSIFIED SERVICES - Bulding and Faci;ity Management Services
|
$17.03
|
+0.03
0.18% |
$17.10
|
35,935
33.62% of 50 DAV
50 DAV is 106,900
|
$17.09
-0.35%
|
3/15/2011
|
$15.48
|
PP = $15.90
|
|
MB = $16.70
|
Most Recent Note - 3/22/2011 1:00:13 PM
G - Touched another new high today. After rallying beyond its "max buy" level its color code was changed to green. Prior highs near its pivot point define chart support to watch following last week's technical breakout. The M criteria argues against new buying efforts until a confirmed rally with follow-through day occurs.
>>> The latest Featured Stock Update with an annotated graph appeared on 3/15/2011. Click here.
View all notes |
Alert me of new notes |
CANSLIM.net Company Profile |
SEC |
Zacks Reports |
StockTalk |
News |
Chart |
Request a new note
C
A N
S L
I M
|
MWIV
-
NASDAQ
M W I Veterinary Supply
HEALTH SERVICES - Medical Instruments and; Supplies
|
$75.32
|
-1.54
-2.00% |
$77.67
|
93,280
102.28% of 50 DAV
50 DAV is 91,200
|
$78.48
-4.03%
|
11/4/2010
|
$61.79
|
PP = $59.60
|
|
MB = $62.58
|
Most Recent Note - 3/23/2011 7:04:30 PM
G - Holding its ground in a tight range perched -2.1% off its all-time high. It is extended from any sound base pattern.
>>> The latest Featured Stock Update with an annotated graph appeared on 3/8/2011. Click here.
View all notes |
Alert me of new notes |
CANSLIM.net Company Profile |
SEC |
Zacks Reports |
StockTalk |
News |
Chart |
Request a new note
C
A N
S L
I M
|
OPEN
-
NASDAQ
Opentable Inc
INTERNET - Internet Software and Services
|
$98.65
|
+3.46
3.63% |
$99.00
|
1,744,299
161.60% of 50 DAV
50 DAV is 1,079,400
|
$95.97
2.79%
|
3/17/2011
|
$90.71
|
PP = $96.07
|
|
MB = $100.87
|
Most Recent Note - 3/24/2011 7:13:36 PM
Y - Hit a new all-time high today with +61% above average volume behind its gain above its pivot point, triggering a new (or add-on) technical buy signal. See the latest FSU analysis for details and a new annotated graph.
>>> The latest Featured Stock Update with an annotated graph appeared on 3/24/2011. Click here.
View all notes |
Alert me of new notes |
CANSLIM.net Company Profile |
SEC |
Zacks Reports |
StockTalk |
News |
Chart |
Request a new note
C
A N
S L
I M
|
Symbol/Exchange
Company Name
Industry Group |
PRICE |
CHANGE
(%Change) |
Day High |
Volume
(% DAV)
(% 50 day avg vol) |
52 Wk Hi
% From Hi |
Featured
Date |
Price
Featured |
Pivot Featured |
|
Max Buy |
PAY
-
NYSE
Verifone Systems Inc
COMPUTER HARDWARE - Transaction Automation Systems
|
$53.45
|
+0.04
0.07% |
$54.04
|
2,247,675
119.28% of 50 DAV
50 DAV is 1,884,300
|
$54.00
-1.02%
|
1/27/2011
|
$41.77
|
PP = $44.97
|
|
MB = $47.22
|
Most Recent Note - 3/23/2011 7:02:47 PM
G - Gain today on light volume for a new high close. Repeatedly noted - "No resistance remains due to overhead supply, but it is extended from a sound base pattern. Its 50 DMA line defines chart support to watch."
>>> The latest Featured Stock Update with an annotated graph appeared on 3/2/2011. Click here.
View all notes |
Alert me of new notes |
CANSLIM.net Company Profile |
SEC |
Zacks Reports |
StockTalk |
News |
Chart |
Request a new note
C
A N
S L
I M
|
PCLN
-
NASDAQ
Priceline.Com Inc
INTERNET - Internet Software and Services
|
$476.01
|
+9.75
2.09% |
$478.00
|
1,191,588
102.70% of 50 DAV
50 DAV is 1,160,300
|
$474.74
0.27%
|
1/3/2011
|
$399.55
|
PP = $428.20
|
|
MB = $449.61
|
Most Recent Note - 3/23/2011 6:58:37 PM
G - Consolidating above support at its 50 DMA line, perched only -1.8% off its 52-week high, but it has not built a sound new base pattern.
>>> The latest Featured Stock Update with an annotated graph appeared on 3/21/2011. Click here.
View all notes |
Alert me of new notes |
CANSLIM.net Company Profile |
SEC |
Zacks Reports |
StockTalk |
News |
Chart |
Request a new note
C
A N
S L
I M
|
RAX
-
NYSE
Rackspace Hosting Inc
INTERNET - Internet Software and; Services
|
$37.80
|
+0.91
2.47% |
$37.95
|
1,062,863
57.91% of 50 DAV
50 DAV is 1,835,500
|
$40.62
-6.94%
|
3/16/2011
|
$36.28
|
PP = $40.72
|
|
MB = $42.76
|
Most Recent Note - 3/23/2011 7:07:53 PM
Y - Positive reversal today while testing support at its 50 DMA line. Its recent low ($34.22 on 3/15/11) defines another near-term support level to watch. The M criteria is an overriding concern arguing against new buying efforts until a rally with follow-through day occurs.
>>> The latest Featured Stock Update with an annotated graph appeared on 3/16/2011. Click here.
View all notes |
Alert me of new notes |
CANSLIM.net Company Profile |
SEC |
Zacks Reports |
StockTalk |
News |
Chart |
Request a new note
C
A N
S L
I M
|
TIBX
-
NASDAQ
Tibco Software Inc
COMPUTER SOFTWARE and SERVICES - Business Software and Services
|
$26.12
|
+1.32
5.32% |
$26.37
|
2,843,862
117.33% of 50 DAV
50 DAV is 2,423,900
|
$25.94
0.69%
|
3/18/2011
|
$23.88
|
PP = $26.04
|
|
MB = $27.34
|
Most Recent Note - 3/24/2011 11:36:16 AM
Y - Gapped up today and rallied to a new 52-week high, clear of all resistance. Volume is running at an above average pace while it has risen above its pivot point, and a strong close with at least +50% above average volume may trigger a technical buy signal. However, the M criteria remains an overriding concern for disciplined investors until the rally attempt is confirmed with a follow-through day from at least one of the major averages.
>>> The latest Featured Stock Update with an annotated graph appeared on 3/18/2011. Click here.
View all notes |
Alert me of new notes |
CANSLIM.net Company Profile |
SEC |
Zacks Reports |
StockTalk |
News |
Chart |
Request a new note
C
A N
S L
I M
|
UA
-
NYSE
Under Armour Inc Cl A
CONSUMER NON-DURABLES - Textile - Apparel Clothing
|
$65.25
|
+0.33
0.51% |
$65.88
|
448,474
56.51% of 50 DAV
50 DAV is 793,600
|
$70.69
-7.70%
|
1/27/2011
|
$58.31
|
PP = $56.99
|
|
MB = $59.84
|
Most Recent Note - 3/22/2011 6:41:58 PM
G - Down today with light volume, slumping toward its 50 DMA line and recent lows defining important chart support. It may be forming a base-on-base pattern, but more damaging losses would hurt its outlook.
>>> The latest Featured Stock Update with an annotated graph appeared on 3/7/2011. Click here.
View all notes |
Alert me of new notes |
CANSLIM.net Company Profile |
SEC |
Zacks Reports |
StockTalk |
News |
Chart |
Request a new note
C
A N
S L
I M
|
Symbol/Exchange
Company Name
Industry Group |
PRICE |
CHANGE
(%Change) |
Day High |
Volume
(% DAV)
(% 50 day avg vol) |
52 Wk Hi
% From Hi |
Featured
Date |
Price
Featured |
Pivot Featured |
|
Max Buy |
ULTA
-
NASDAQ
Ulta Salon Cosm & Frag
SPECIALTY RETAIL - Specialty Retail, Other
|
$47.84
|
+0.57
1.20% |
$48.43
|
492,857
79.28% of 50 DAV
50 DAV is 621,700
|
$47.93
-0.20%
|
1/6/2011
|
$36.12
|
PP = $37.34
|
|
MB = $39.21
|
Most Recent Note - 3/22/2011 6:43:51 PM
G - Hovering near its all-time high, quietly holding its ground after a spurt of volume-driven gains. Support to watch is at its 50 DMA line and recent chart lows near the $40 level.
>>> The latest Featured Stock Update with an annotated graph appeared on 2/17/2011. Click here.
View all notes |
Alert me of new notes |
CANSLIM.net Company Profile |
SEC |
Zacks Reports |
StockTalk |
News |
Chart |
Request a new note
C
A N
S L
I M
|
|
 |
| Subscriber Questions: |
March 22, 2011 |
Dear Ken,
I'm trying to interpret the Featured Stocks spreadsheet. The suggested purchase price, is that the featured price, or the pivot price? The Max Buy price, I take to mean don't chase the stock. Please contact me. Mr. R. in Los Angeles |
| Ken's Response: |
March 23, 2011 |
Dear Mr. R. in Los Angeles:
Thanks for asking a great question allowing me to provide more detailed comments on the Featured Stocks list.
To clarify any confusion about the Featured Stocks page http://premium.canslim.net/FeaturedStocks/featured.asp (or spreadsheet, if you downloaded it), the Featured Price you see listed is directly associated with the Featured Date on any stock currently listed on the Featured Stocks Page. Links provided on the website allow you to review all prior notes and featured articles with annotated graphs on each stock's Company Profile page. Whenever Pivot Points were noted, they also directly associated with the Featured Date and Featured Price at the time of the note. Whenever a new Pivot Point is cited for a previously featured stock, a new Featured Date and Featured Price are associated with that new Pivot Point published in the reports from that time forward.
The Company Profile page for any stock gives you a concise review of the prior coverage. Understand that the summary of historic notes and more detailed write-ups you will find there is comprised mostly of notes or analysis that appeared in either a previous Mid-day Breakouts Report, or an earlier After Market Update. Those reports are included with your upgraded membership, and it is highly recommended that members review both reports in their entirety each day. We send notification emails immediately as these reports are published and made available on the secure website for those with access. All prior reports are available for review via the Premium Membership Homepage http://premium.canslim.net/canslimnewservicehome.asp
On occasion, new notes may be added to an already featured stock and the new note may state that a new Pivot Point has been cited. Indeed, if you check the After Market Update we published on the evening of such a note you should see that the Featured Date, Featured Price, and Pivot Point are new, whereas earlier After Market Updates we published cited the prior Featured Date, Featured Price, and Pivot Point.
Since you did not ask about a specific stock, I cannot tell you if it had or had not yet traded above its Pivot Point with volume conviction and triggered a technical buy signal or not when it was previously "Featured" in the prior reports. In some cases the stocks are identified before a breakout, and in some cases they are identified after a breakout yet still within buyable guidelines.
I cannot suggest you buy any amount of anything, however, because I know nothing of your risk tolerance and what is suitable for you. Please note that to keep the legal folks happy our reports include the following disclaimer - "THESE ARE NOT BUY RECOMMENDATIONS! Comments contained in the body of this report are technical opinions only. The material herein has been obtained from sources believed to be reliable and accurate, however, its accuracy and completeness cannot be guaranteed. CANSLIM.net is not an investment advisor, hence it does not endorse or recommend any securities or other investments. Any recommendation contained in this report may not be suitable for all investors and it is not to be deemed an offer or solicitation on our part with respect to the purchase or sale of any securities. All trademarks, service marks and trade names appearing in this report are the property of their respective owners, and are likewise used for identification purposes only." Please review our site's terms and conditions page for additional information - http://www.canslim.net/termsandconditions.asp
I will gladly help if you need anything else clarified. I attempted to call you earlier but couldn't reach you. Hopefully the above is sufficient explanation to make sure you understand
Please let me know if there is any way I can be more helpful to you in your efforts.
Best regards,

Kenneth J. Gruneisen
Founder & Contributing Writer for CANSLIM.net
www.canslim.net |
|
|
|
THESE ARE NOT BUY RECOMMENDATIONS!
Comments contained in the body of this report are technical
opinions only. The material herein has been obtained
from sources believed to be reliable and accurate, however,
its accuracy and completeness cannot be guaranteed.
This site is not an investment advisor, hence it does
not endorse or recommend any securities or other investments.
Any recommendation contained in this report may not
be suitable for all investors and it is not to be deemed
an offer or solicitation on our part with respect to
the purchase or sale of any securities. All trademarks,
service marks and trade names appearing in this report
are the property of their respective owners, and are
likewise used for identification purposes only.
This report is a service available
only to active Paid Premium Members.
You may opt-out of receiving report notifications
at any time. Questions or comments may be submitted
by writing to Premium Membership Services 665 S.E. 10 Street, Suite 201 Deerfield Beach, FL 33441-5634 or by calling 1-800-965-8307
or 954-785-1121.
|
|
|

