You are not logged in.
This means
you CAN ONLY VIEW reports that were published prior to Monday, April 14, 2025.
You
MUST UPGRADE YOUR MEMBERSHIP if you want to see any current reports.
 MIDDAY BREAKOUTS REPORT - THURSDAY, MARCH 24TH, 2011 MIDDAY BREAKOUTS REPORT - THURSDAY, MARCH 24TH, 2011
Previous Mid Day Report Next Mid Day Report >>>
|
|
DOW 12152.06 66.04 (0.55%) | NASDAQ 2727.58 29.28 (1.09%) | S&P 500 1307.67 10.13 (0.78%)
|
Time of Screening :
3/24/2011 11:47:03 AM Report Released :
3/24/2011 1:10:10 PM
Price is:
Above 52W High and Less Than 52W High
but within 7% of the 52 Week High
Volume Is:
At least 65% of 50 Day Average at
the time of the screening.
More details about this report...
At around
mid-way through each trading day we run
a screen against our database of
high-ranked stocks, searching for
possible buy candidates that are trading
at or near their 52-week high on above
average volume. The results of that
screen are split into the two sections
you see below. The first, titled
"TODAY's FEATURED STOCKS" shows stocks
that our experts have recently
identified as among the strongest candidates to
consider. Stocks highlighted in yellow
are the most timely and noteworthy, so
particular attention and prompt action
may be appropriate. The second section,
titled "TODAY's BREAKOUT SCREEN" shows
the remainder of stocks meeting today's
screen parameters. Our experts have
reviewed and included notes on these
stocks as well, but found that they may
not match up as favorably.
|
|
Y - Today's strongest
candidates
highlighted
by our staff
of experts.
|
|
G - Previously featured in
this report as yellow and
now may no longer be buyable
under the guidelines.
|
|
|
Symbol/Exchange
Company Name
Industry Group |
PRICE |
CHANGE
(%Change) |
Day High |
Volume
(% DAV)
(50 DAV) |
52 Wk Hi
% From Hi |
Date
Featured |
Price
Featured |
Pivot Point |
|
Max Buy |
BIDU
- NASDAQ
Baidu Inc Ads
|
$134.08
|
+1.50
1.13%
|
$135.00
|
6,278,899
92.45% of 50 DAV
50 DAV is 6,791,700
|
$135.00
-0.68%
|
3/17/2011 |
$121.97
|
PP = $131.73
MB = $138.32 |
Most Recent Note - 3/24/2011 11:52:36 AM
Y - Holding its ground today after a gain with 2 times average volume for a new all-time high on 3/23/11, rallying above its pivot point triggering a technical buy signal after a riskier "late stage" set-up. Disciplined investors know that a follow-through day from at least one of the major averages (M criteria) is necessary in order to justify new (or add-on) buying efforts under the system's guidelines. Its 50 DMA line defines important chart support to watch.
>>> The latest Featured Stock Update with an annotated graph appeared on 3/9/2011. Click here.
|
|
View all notes |
Alert me of new notes |
Company Profile |
SEC |
News |
Chart | C
A N
S L
I M
|
EZPW
- NASDAQ
Ezcorp Inc Cl A
|
$31.65
|
+1.46
4.84%
|
$31.67
|
373,402
99.87% of 50 DAV
50 DAV is 373,900
|
$31.76
-0.35%
|
2/18/2011 |
$27.94
|
PP = $30.04
MB = $31.54 |
Most Recent Note - 3/24/2011 12:06:33 PM
Y - Gapped up today and now trading near its "max buy" level. A solid gain on 3/23/11 with +69% above average volume for a new 52-week high helped it break out above its pivot point triggering a technical buy signal. Also confirming the N criteria, it announced a new global strategic alliance with second hand goods retailer Cash Converters International. As previously noted - "A follow-through day from at least one of the major averages (M criteria) is also necessary in order to justify new (or add-on) buying efforts under the system's guidelines."
>>> The latest Featured Stock Update with an annotated graph appeared on 3/10/2011. Click here.
|
|
View all notes |
Alert me of new notes |
Company Profile |
SEC |
News |
Chart | C
A N
S L
I M
|
INFA
- NASDAQ
Informatica Corp
|
$50.04
|
+1.39
2.86%
|
$50.22
|
678,137
69.32% of 50 DAV
50 DAV is 978,300
|
$50.21
-0.34%
|
3/24/2011 |
$50.04
|
PP = $49.86
MB = $52.35 |
Most Recent Note - 3/24/2011
Y - Gapped up today and hit a new 52-week high, rising from an orderly flat base pattern during which its 50 DMA line acted as support. Color code is changed to yellow with pivot point cited based upon its 52-week high plus 10 cents. This Redwood City, CA-based Computer Software - Database firm showed strong sales revenues and earnings increases for the 3 most recent quarters (Jun, Sep, Dec '10) above the +25% minimum guidelines and it has maintained a steady annual earnings (A criteria) history. Volume-driven gains above its pivot point coupled with a FTD (confirming the M criteria) would be reassuring signs confirming a technical buy signal.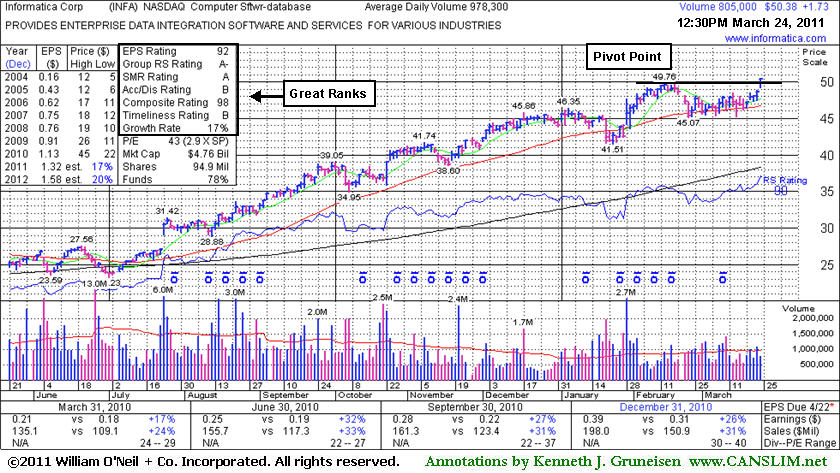 ? ?
>>> The latest Featured Stock Update with an annotated graph appeared on 3/8/2006. Click here.
|
|
View all notes |
Alert me of new notes |
Company Profile |
SEC |
News |
Chart | C
A N
S L
I M
|
OPEN
- NASDAQ
Opentable Inc
|
$98.28
|
+3.09
3.25%
|
$98.74
|
933,708
86.50% of 50 DAV
50 DAV is 1,079,400
|
$98.74
-0.47%
|
3/17/2011 |
$90.71
|
PP = $96.07
MB = $100.87 |
Most Recent Note - 3/24/2011 12:47:01 PM
Y - Hit a new all-time high today, trading above its pivot point while on track for a 4th consecutive gain with ever-increasing volume. A gain with at least +50% above average volume and close above the new pivot point cited, coupled with a confirmed rally with a follow-through day (FTD) from at least one of the major averages (M criteria), may justify new (or add-on) buying efforts under the fact-based investment system's guidelines.
>>> The latest Featured Stock Update with an annotated graph appeared on 2/15/2011. Click here.
|
|
View all notes |
Alert me of new notes |
Company Profile |
SEC |
News |
Chart | C
A N
S L
I M
|
|
 |
Symbol - Exchange - Industry Group
Company Name |
Last |
Chg |
Day
High |
52 WK Hi |
% From Hi |
Volume
% DAV |
DAV |
AG
- NYSE - METALS & MINING - Silver
First Majestic Silver
|
$20.34 |
+1.02
5.28%
|
$20.48
|
$20.48
|
-0.68% |
1,095,612
130.77%
|
837,800
|
Most Recent Note for AG - 3/24/2011 11:51:14 AM
Gapped up today, hitting another new all-time high with a second consecutive gain with above average volume. This week the Vancouver, BC headquartered firm engaged in silver production in Mexico was noted in 2 earlier mid-day reports - "It found support above its 50 DMA line in the interim and has spurted higher with more volume-driven gains. On 12/15/10 it was listed on the NYSE. Recent quarterly comparisons showed solid sales and earnings increases but its annual earnings (A criteria) history has been below guidelines."
|
|
View all notes |
Alert me of new notes |
Company Profile |
SEC |
News |
Chart | C
A N
S L
I M
|
CAP
- NYSE - DIVERSIFIED SERVICES - Rental & Leasing Services
C A I International Inc
|
$25.86 |
+0.54
2.13%
|
$26.26
|
$26.26
|
-1.52% |
105,634
113.34%
|
93,200
|
Most Recent Note for CAP - 3/24/2011 11:53:55 AM
Hit another new high after a small gap up today. Prior mid-day reports noted when challenging its high - "Following a brief consolidation above prior highs and its 50 DMA line defining support. No overhead supply remains to act as resistance, but the downturn in its FY '09 earnings is a flaw with respect to the A criteria. It completed a Public Offering on 12/09/10 and found support near its 50 DMA line since the 11/30/10 mid-day report noted - 'Recent quarterly comparisons show improving sales and earnings after negative comparisons.'"
|
|
View all notes |
Alert me of new notes |
Company Profile |
SEC |
News |
Chart | C
A N
S L
I M
|
CVLT
- NASDAQ - COMPUTER SOFTWARE & SERVICES - Business Software & Services
Commvault Systems Inc
|
$39.70 |
+1.17
3.04%
|
$39.87
|
$39.93
|
-0.58% |
363,437
69.09%
|
526,000
|
Most Recent Note for CVLT - 3/24/2011 11:57:18 AM
Today's 5th consecutive gain has it challenging its all-time high. It found support at its 50 DMA line while consolidating since that high was hit when last noted in the 2/11/11 mid-day report - "Based on poor technical action it was dropped from the Featured Stocks list on 7/13/10. It has rebounded impressively since, yet its fundamental characteristics today are not a match for the fact-based system at all. Disciplined investors avoid the temptation to get in "early" and may review earlier notes and observe that CVLT did not trigger a technical buy signal after it had been featured in the 7/06/10 mid-day report."
|
|
View all notes |
Alert me of new notes |
Company Profile |
SEC |
News |
Chart | C
A N
S L
I M
|
EPL
- NYSE - ENERGY - Independent Oil & Gas
E P L Oil & Gas Inc
|
$17.24 |
+0.31
1.83%
|
$17.44
|
$17.44
|
-1.15% |
195,443
74.03%
|
264,000
|
Most Recent Note for EPL - 3/24/2011 12:02:39 PM
Recently rebounded from below its 50 DMA line and today it hit a new 52-week high. The 3/23/11 mid-day report noted - "Earnings and sales revenues history are below the fact-based investment system's guidelines."
|
|
View all notes |
Alert me of new notes |
Company Profile |
SEC |
News |
Chart | C
A N
S L
I M
|
GENT
- NASDAQ - DRUGS - Drug Manufacturers - Other
Gentium Spa Ads
|
$12.19 |
+0.40
3.39%
|
$13.69
|
$13.69
|
-10.96% |
133,357
284.34%
|
46,900
|
Most Recent Note for GENT - 3/24/2011 12:12:34 PM
Up today for another new 52-week high, but well off its early session highs. The 3 prior mid-day reports noted - "Gain today for a new 52-week high. This Italy-based Medical - Biomed/Biotech firm with minuscule but increasing sales revenues growth found support at its 50 DMA line during its consolidation since last noted in the 2/09/11 mid-day report - 'Recent quarterly comparisons show sales and earnings improving after a long history of losses. Low priced stocks are discouraged under the investment system guidelines.'"
|
|
View all notes |
Alert me of new notes |
Company Profile |
SEC |
News |
Chart | C
A N
S L
I M
|
GMCR
- NASDAQ - FOOD & BEVERAGE - Processed & Packaged Goods
Green Mtn Coffee Roastrs
|
$61.41 |
-1.65
-2.62%
|
$62.55
|
$63.85
|
-3.82% |
3,530,228
75.15%
|
4,697,500
|
Most Recent Note for GMCR - 3/24/2011 12:15:50 PM
Holding its ground perched near its all-time high, extended from any sound base pattern following its considerable gap up on 3/10/11 after news of a deal with Starbucks Corp (SBUX). The 3/11/11 mid-day report noted - "In recent weeks it had rallied above prior resistance in the $37-38 area, yet it had sputtered below its 50 DMA line since noted in the 11/30/10 mid-day report as it touched a new all-time high after a very choppy 9-week consolidation that included a brief trip below its 200 DMA line. It has maintained a very strong sales revenues and earnings growth history solidly satisfying the C and A criteria. This previously featured leader was dropped from the Featured Stocks list on 10/01/10."
|
|
View all notes |
Alert me of new notes |
Company Profile |
SEC |
News |
Chart | C
A N
S L
I M
|
IPGP
- NASDAQ - ELECTRONICS - Semiconductor - Integrated Circuits
I P G Photonics Corp
|
$60.62 |
+2.85
4.93%
|
$61.63
|
$61.63
|
-1.64% |
390,479
96.44%
|
404,900
|
Most Recent Note for IPGP - 3/24/2011 12:26:53 PM
Touched another new all-time high today following a strong volume-driven gain on the prior session. It hit is prior high and negatively reversed when last noted in the 3/07/11 mid-day report - "Reported impressive earnings +700% on +86% sales revenues for the quarter ended December 31, 20101 versus the year ago period. A downturn in FY '09 earnings is a flaw with respect to the A criteria of the fact-based system. It is extended from any sound base pattern. Its prior history has been erratic and below guidelines of the fact-based system.'"
|
|
View all notes |
Alert me of new notes |
Company Profile |
SEC |
News |
Chart | C
A N
S L
I M
|
IRM
- NYSE - DIVERSIFIED SERVICES - Business/Management Services
Iron Mountain Inc
|
$31.23 |
+0.33
1.07%
|
$31.28
|
$31.28
|
-0.16% |
2,461,441
116.57%
|
2,111,500
|
Most Recent Note for IRM - 3/24/2011 12:33:23 PM
Hitting new 52-week highs with a recent spurt of volume-driven gains. Sales and earnings history has been below guidelines of the fact-based investment system.
|
|
View all notes |
Alert me of new notes |
Company Profile |
SEC |
News |
Chart | C
A N
S L
I M
|
KRO
- NYSE - CHEMICALS - Specialty Chemicals
Kronos Worldwide Inc
|
$58.45 |
+0.45
0.78%
|
$58.49
|
$59.00
|
-0.93% |
321,646
217.18%
|
148,100
|
Most Recent Note for KRO - 3/24/2011 12:36:51 PM
Climbing to new 52-week highs with a 6th consecutive gain today. It found support above prior chart highs after a recent spurt of volume-driven gains helped it clear an orderly base pattern. Prior mid-day reports noted - "Earnings history has been erratic and below guidelines. Found support at its 50 DMA line after it proposed a Public Offering on 10/18/10, and subsequently rallied to new highs."
|
|
View all notes |
Alert me of new notes |
Company Profile |
SEC |
News |
Chart | C
A N
S L
I M
|
LXU
- NYSE - CHEMICALS - Synthetics
L S B Industries Inc
|
$37.01 |
+0.93
2.58%
|
$37.24
|
$37.74
|
-1.93% |
282,443
111.95%
|
252,300
|
Most Recent Note for LXU - 3/24/2011 12:39:31 PM
Hovering near its all-time high since a breakaway gap on 3/04/11. Earnings history is below the investment system's guidelines.
|
|
View all notes |
Alert me of new notes |
Company Profile |
SEC |
News |
Chart | C
A N
S L
I M
|
MTD
- NYSE - ELECTRONICS - Scientific & Technical Instrum
Mettler Toledo Intl Inc
|
$170.15 |
-1.56
-0.91%
|
$173.29
|
$177.39
|
-4.08% |
125,505
83.67%
|
150,000
|
Most Recent Note for MTD - 3/24/2011 12:42:21 PM
Consolidating above its 50 DMA line, building a base-on-base type pattern since last noted in the 2/23/11 mid-day report - "Technically, it broke out from an orderly flat base with a gain backed by above average volume on 2/08/11 since last noted in the 1/19/11 mid-day report - 'Sales revenues and earnings history has not been strong and steady enough to solidly satisfy fundamental guidelines.'"
|
|
View all notes |
Alert me of new notes |
Company Profile |
SEC |
News |
Chart | C
A N
S L
I M
|
NNBR
- NASDAQ - MANUFACTURING - Machine Tools & Accessories
N N Inc
|
$16.45 |
+1.01
6.54%
|
$16.47
|
$16.47
|
-0.12% |
309,613
194.24%
|
159,400
|
Most Recent Note for NNBR - 3/24/2011 12:43:42 PM
Making its 4th consecutive mid-day report appearance, rising for another new 52-week high today. It went through a choppy consolidation since noted in the 1/11/11 mid-day report - "Recent quarterly comparisons show improving sales and earnings after big losses in FY '09."
|
|
View all notes |
Alert me of new notes |
Company Profile |
SEC |
News |
Chart | C
A N
S L
I M
|
OVTI
- NASDAQ - ELECTRONICS - Semiconductor - Integrated Cir
Omnivision Technologies
|
$34.06 |
+2.29
7.21%
|
$34.36
|
$35.00
|
-2.69% |
1,663,824
65.85%
|
2,526,600
|
Most Recent Note for OVTI - 3/24/2011 12:51:10 PM
Today's gain has it challenging its 52-week high after a pullback near its 50 DMA line. Its prior high was hit on 3/07/11 when last noted in the mid-day report - "It briefly traded above its $34.49 high from 2006 then reversed into the red. Its 3/03/11 gap up gain on heavy volume left no overhead supply remaining to act as resistance. A considerable gap up gain on 2/25/11 helped it rebound from below its 200 DMA line after a "double bottom" base. Recent quarterly comparisons show strong sales revenues and earnings increases after a loss in FY '09 and an up and down annual earnings (A criteria)."
|
|
View all notes |
Alert me of new notes |
Company Profile |
SEC |
News |
Chart | C
A N
S L
I M
|
STJ
- NYSE - HEALTH SERVICES - Medical Appliances & Equipment
St Jude Medical Inc
|
$50.52 |
-0.46
-0.90%
|
$51.50
|
$51.93
|
-2.72% |
3,489,707
90.33%
|
3,863,400
|
Most Recent Note for STJ - 3/24/2011 12:58:16 PM
Consolidating following a considerable volume-driven gain on 3/22/11 for a new 52-week high. Quarterly sales revenues have been up in the +7-12% range while earnings increases have been below the +25% guideline (not meeting C criteria). Its annual earnings (A criteria) history has been steadily improving in recent years.
|
|
View all notes |
Alert me of new notes |
Company Profile |
SEC |
News |
Chart | C
A N
S L
I M
|
TORM
- NASDAQ - CHEMICALS - Synthetics
Tor Minerals Intl Inc
|
$21.05 |
-0.64
-2.95%
|
$22.48
|
$22.48
|
-6.36% |
31,186
95.96%
|
32,500
|
Most Recent Note for TORM - 3/24/2011 12:59:39 PM
Reversed into the red after early gains today. The 3/23/11 mid-day report noted - "Spiking to another new 52-week high today with a 4th consecutive gain with ever-increasing volume, extended from any sound base. Prior mid-day reports noted - 'Hovering near its 52-week high since a considerable gap up gain on 2/24/11 following its strong earnings news for the quarter ended December 31, 2010 versus the year ago period. Recent quarterly comparisons show improving sales revenues and earnings, but its prior history has been erratic and below the investment system's guidelines.'"
|
|
View all notes |
Alert me of new notes |
Company Profile |
SEC |
News |
Chart | C
A N
S L
I M
|
TYPE
- NASDAQ - COMPUTER SOFTWARE & SERVICES - Application Software
Monotype Imaging Hldgs
|
$13.60 |
-0.08
-0.58%
|
$13.85
|
$14.00
|
-2.86% |
125,610
85.57%
|
146,800
|
Most Recent Note for TYPE - 3/24/2011 1:01:39 PM
Perched only -2.8% off its 52-week high today. The 3/23/11 mid-day report noted - "Found support above its 50 DMA line recently while consolidating since a considerable breakaway gap on 2/17/11 following earnings news. Sales and earnings history are below the fact-based system's guidelines."
|
|
View all notes |
Alert me of new notes |
Company Profile |
SEC |
News |
Chart | C
A N
S L
I M
|
TZOO
- NASDAQ - COMPUTER SOFTWARE & SERVICES - Information Technology Service
Travelzoo Inc
|
$56.57 |
-0.69
-1.21%
|
$58.48
|
$58.48
|
-3.27% |
253,132
67.34%
|
375,900
|
Most Recent Note for TZOO - 3/24/2011 1:05:10 PM
Touched another new 52-week high today then reversed into the red. Considerable volume-driven gain this week helped it rally above prior resistance in the $53 area following a deep "V" shaped consolidation below its 50 DMA line. Noted in prior mid-day reports - "After a very impressive rally from August '10 lows near $14 and January 2009 low of $3.72 per share. Recent quarterly comparisons show sales and earnings improving but its prior earnings history is below guidelines."
|
|
View all notes |
Alert me of new notes |
Company Profile |
SEC |
News |
Chart | C
A N
S L
I M
|
VIAS
- NASDAQ - ELECTRONICS - Printed Circuit Boards
Viasystems Group Inc
|
$28.00 |
+0.57
2.08%
|
$28.00
|
$28.70
|
-2.44% |
29,674
93.61%
|
31,700
|
Most Recent Note for VIAS - 3/24/2011 1:08:36 PM
Hovering in a tight range for the past few weeks perched near its 52-week high. Sales and earnings history are below the fact-based system's guidelines after huge losses in FY '08 and '09.
|
|
View all notes |
Alert me of new notes |
Company Profile |
SEC |
News |
Chart | C
A N
S L
I M
|
|
|
|
THESE ARE NOT BUY RECOMMENDATIONS!
Comments contained in the body of this report are technical
opinions only. The material herein has been obtained
from sources believed to be reliable and accurate, however,
its accuracy and completeness cannot be guaranteed.
We are not an investment advisor, hence it does
not endorse or recommend any securities or other investments.
Any recommendation contained in this report may not
be suitable for all investors and it is not to be deemed
an offer or solicitation on our part with respect to
the purchase or sale of any securities. All trademarks,
service marks and trade names appearing in this report
are the property of their respective owners, and are
likewise used for identification purposes only.
This report is a service available
only to active Paid Premium Members.
You may opt-out of receiving report notifications
at any time. Questions or comments may be submitted
by writing to FactBasedInvesting.com c/o Premium
Member Services 665 S.E. 10 Street, Suite 201
Deerfield Beach, FL 33441-5634 or by calling 954-785-1121.
We appreciate any feedback
members may wish to send via the inquiry form
here.
|
|
|


