You are not logged in.
This means you
CAN ONLY VIEW reports that were published prior to Monday, April 14, 2025.
You
MUST UPGRADE YOUR MEMBERSHIP if you want to see any current reports.
AFTER MARKET UPDATE - MONDAY, MARCH 24TH, 2014
Previous After Market Report Next After Market Report >>>
|
|
|
|
DOW |
-26.08 |
16,276.69 |
-0.16% |
|
Volume |
714,305,220 |
-64% |
|
Volume |
2,262,759,940 |
-20% |
|
NASDAQ |
-50.40 |
4,226.39 |
-1.18% |
|
Advancers |
1,155 |
37% |
|
Advancers |
684 |
23% |
|
S&P 500 |
-9.08 |
1,857.44 |
-0.49% |
|
Decliners |
1,935 |
61% |
|
Decliners |
2,238 |
75% |
|
Russell 2000 |
-15.50 |
1,178.23 |
-1.30% |
|
52 Wk Highs |
65 |
|
|
52 Wk Highs |
43 |
|
|
S&P 600 |
-6.55 |
671.82 |
-0.97% |
|
52 Wk Lows |
19 |
|
|
52 Wk Lows |
35 |
|
|
 |
Major Averages Ended Above Worst Levels With Less Volume Behind Losses
Kenneth J. Gruneisen - Passed the CAN SLIM® Master's Exam
The major averages finished lower on Monday while the volume totals were reported lighter on the NYSE and on the Nasdaq exchange, down from Friday's totals inflated by options expirations. Decliners led advancers by more than a 3-2 margin on the NYSE and on the Nasdaq exchange. There were 10 high-ranked companies from the CANSLIM.net Leaders List that made new 52-week highs and appeared on the CANSLIM.net BreakOuts Page, down abruptly from the total of 58 stocks on the prior session. The list of stocks hitting new 52-week highs outnumbered new 52-week lows on the Nasdaq exchange and on the NYSE. There were gains for 2 of the 10 high-ranked companies currently included on the Featured Stocks Page. The Market (M criteria) uptrend faced some recent pressure and yet the rally has continued. For any rally to be sustained it is critical for there to be healthy leadership, so it remains crucial for many stocks to continue hitting new 52-week highs.
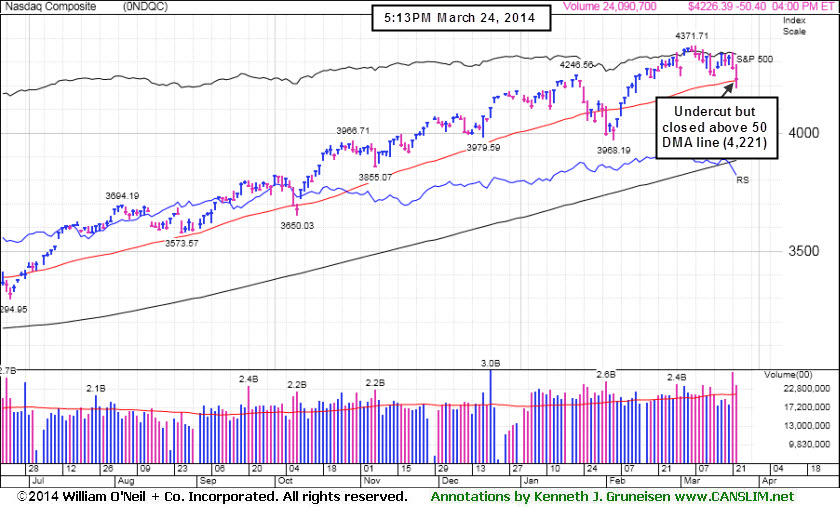
The Dow lost 26 points to 16,276. The S&P 500 fell 9 points to 1,857 and the NASDAQ declined 50 points to 4,226. Equities were under pressure amid weak economic data. U.S. manufacturing edged lower in March as Markit magazine's factory activity index slowed to 55.5 from a near four-month-high of 57.1 in the previous month. In addition, a measure of China's manufacturing activity weakened for the fifth straight month to an eight-month low. The situation in Ukraine also weighed on the market as Russia's troops seized Ukrainian ships and military installations in Crimea following its annexation of the peninsula last week.
As a result, seven of the 10 S&P 500 sectors declined. Health care and consumer discretionary stocks paced the retreat as Pfizer (PFE -2.14%) and Netflix (NFLX -6.67%) declined. The more defensive telecommunication and utility sectors advanced as AT&T (T +0.47%) and Southern Co (SO +0.61%) rose.
Treasury prices gained ground ahead of a government auction of $32 billion in two-year notes tomorrow. The 10-year note gained 3/32 to yield 2.73%. The 30-year bond was up 24/32 to yield 3.57%.
The CANSLIM.net Featured Stocks Page shows the most action-worthy candidates and their latest notes and a Headline Link directs members to the latest detailed analysis with data-packed graphs annotated by a Certified expert along with links to additional resources. The Premium Member Homepage includes "dynamic archives" to all prior pay reports published. Watch for an announcement via email concerning the next WEBCAST.
PICTURED: The Nasdaq Composite Index undercut its 50-day moving average (DMA) line intra-day yet finished the session a few points above that important short-term average.
|
 Kenneth J. Gruneisen started out as a licensed stockbroker in August 1987, a couple of months prior to the historic stock market crash that took the Dow Jones Industrial Average down -22.6% in a single day. He has published daily fact-based fundamental and technical analysis on high-ranked stocks online for two decades. Through FACTBASEDINVESTING.COM, Kenneth provides educational articles, news, market commentary, and other information regarding proven investment systems that work in good times and bad.
Comments contained in the body of this report are technical opinions only and are not necessarily those of Gruneisen Growth Corp. The material herein has been obtained from sources believed to be reliable and accurate, however, its accuracy and completeness cannot be guaranteed. Our firm, employees, and customers may effect transactions, including transactions contrary to any recommendation herein, or have positions in the securities mentioned herein or options with respect thereto. Any recommendation contained in this report may not be suitable for all investors and it is not to be deemed an offer or solicitation on our part with respect to the purchase or sale of any securities. |
|
 |
Gold & Silver, Tech, and Retail Indexes Fell
Kenneth J. Gruneisen - Passed the CAN SLIM® Master's Exam
The Gold & Silver Index ($XAU -4.66%) led decliners on Monday with a considerable loss. The Biotechnology Index ($BTK -2.54%) and the Networking Index ($NWX -1.81%) led the tech sector's retreat while the Semiconductor Index ($SOX -0.46%) suffered a smaller loss. The Retail Index ($RLX -1.67%) weighed on the major averages whilen the Broker/Dealer Index ($XBD -0.37%) and the Bank Index ($BKX -0.10%) edged lower. The Oil Services Index ($OSX -1.14%) slumped while the Integrated Oil Index ($XOI -0.02%) finished flat.
Charts courtesy www.stockcharts.com
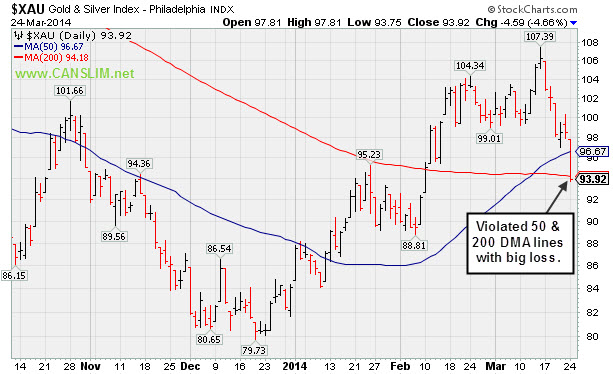
PICTURED: The Gold & Silver Index ($XAU -4.66%) violated its 50-day and 200-day moving average (DMA) lines with a considerable loss.
| Oil Services |
$OSX |
281.17 |
-3.25 |
-1.14% |
+0.05% |
| Integrated Oil |
$XOI |
1,477.25 |
-0.23 |
-0.02% |
-1.72% |
| Semiconductor |
$SOX |
579.85 |
-2.69 |
-0.46% |
+8.38% |
| Networking |
$NWX |
336.94 |
-6.21 |
-1.81% |
+4.01% |
| Broker/Dealer |
$XBD |
162.51 |
-0.61 |
-0.37% |
+1.22% |
| Retail |
$RLX |
902.49 |
-15.35 |
-1.67% |
-3.97% |
| Gold & Silver |
$XAU |
93.92 |
-4.59 |
-4.66% |
+11.61% |
| Bank |
$BKX |
72.63 |
-0.07 |
-0.10% |
+4.87% |
| Biotech |
$BTK |
2,617.62 |
-68.12 |
-2.54% |
+12.32% |
|
|
|
 |
Negated Recent Breakout and Testing Support at 50-Day Average
Kenneth J. Gruneisen - Passed the CAN SLIM® Master's Exam
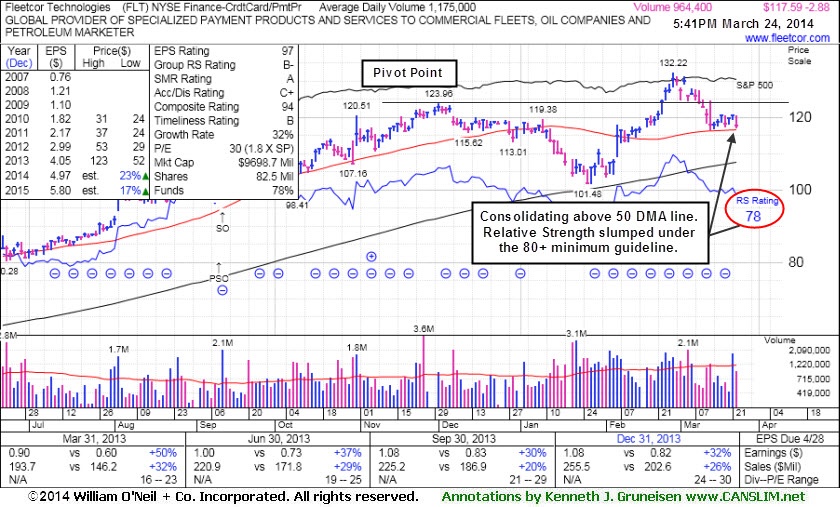
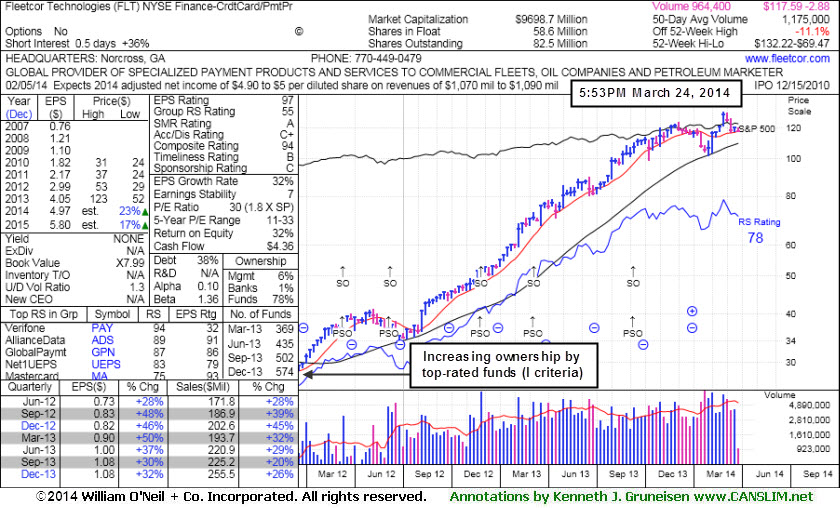
FleetCor Technologies, Inc's (FLT -$2.88 or -2.39% to $117.59) recent slump below its old high close ($122.70 on 12/02/13) raised concerns as it completely negated the prior breakout. Still it is consolidating above its 50-day moving average (DMA) line, an encouraging sign of institutional support, but its Relative Strength rating has slumped to 78, below the 80+ minimum guideline for buy candidates. Fundamentals remain strong with earnings +32% on +26% sales revenues for the Dec '13 quarter continuing its strong earnings history satisfying the C criteria.
FLT last appeared in this FSU section on 3/05/14 with annotated graphs under the headline, "Consolidating Following Recent Breakout to New High Territory". It made limited headway after highlighted in yellow with a pivot point cited based on its 12/02/13 high plus 10 cents in the 3/05/14 mid-day report (read here). Members were previously cautioned - "Odds are most favorable for investors who buy while a stock is rising, rather than buying stocks on pullbacks. Disciplined investors limit losses by selling any stock that falls more than -7% from their purchase price."
The company hails from the Finance - Credit Card Payment Processing group which currently has a mediocre 55 Group Relative Strength Rating, however, impressive strength and leadership from a couple of other firms in the same industry group is considered a sufficient reassurance concerning the L criteria. The company completed a Secondary Offering on 9/11/13. Prior Secondary Offerings on 3/14/12, 6/11/12, 11/29/12, and 3/08/13 were previously noted, "Such offerings often are a short-term hindrance to upward price progress yet typically result in broader institutional ownership interest." The number of top-rated funds owning its shares rose from 193 in Mar '12 to 574 in Dec '13, a reassuring sign concerning the I criteria.
|
|
|
Color Codes Explained :
Y - Better candidates highlighted by our
staff of experts.
G - Previously featured
in past reports as yellow but may no longer be buyable under the
guidelines.
***Last / Change / Volume data in this table is the closing quote data***
Symbol/Exchange
Company Name
Industry Group |
PRICE |
CHANGE
(%Change) |
Day High |
Volume
(% DAV)
(% 50 day avg vol) |
52 Wk Hi
% From Hi |
Featured
Date |
Price
Featured |
Pivot Featured |
|
Max Buy |
EQM
-
NYSE
E Q T Midstream Partners
ENERGY - Oil and Gas Pipelines
|
$68.14
|
+0.43
0.64% |
$69.66
|
113,407
110.10% of 50 DAV
50 DAV is 103,000
|
$67.80
0.50%
|
12/12/2013
|
$53.17
|
PP = $56.51
|
|
MB = $59.34
|
Most Recent Note - 3/21/2014 7:58:05 PM
G - Posted a gain today for a best-ever close. Held its ground since reporting earnings -2% on +22% sales revenues for the Dec '13 quarter, below the +25% minimum earnings guideline (C criteria), raising fundamental concerns. Its 50 DMA line defines near-term support where a violation may trigger a technical sell signal. See the latest FSU analysis for more details and new annotated graphs.
>>> FEATURED STOCK ARTICLE : Hit New Highs But Fundamental Concerns Remain - 3/21/2014
View all notes |
Set NEW NOTE alert |
CANSLIM.net Company Profile |
SEC
News |
Chart |
Request a new note
C
A N
S L
I M


|
FB
-
NASDAQ
Facebook Inc Cl A
INTERNET
|
$64.10
|
-3.14
-4.67% |
$67.36
|
85,434,169
147.04% of 50 DAV
50 DAV is 58,103,000
|
$72.59
-11.70%
|
12/12/2013
|
$51.40
|
PP = $54.93
|
|
MB = $57.68
|
 Most Recent Note - 3/24/2014 11:59:26 AM
G - Down considerably today amid widespread weakness. Testing its 50 DMA line ($64.36 now) which defines near-term support to watch.
>>> FEATURED STOCK ARTICLE : Pulling Back After Getting Extended From Prior Base - 3/14/2014
View all notes |
Set NEW NOTE alert |
CANSLIM.net Company Profile |
SEC
News |
Chart |
Request a new note
C
A N
S L
I M
|
FLT
-
NYSE
Fleetcor Technologies
DIVERSIFIED SERVICES - Business/Management Services
|
$117.59
|
-2.88
-2.39% |
$120.50
|
955,691
81.34% of 50 DAV
50 DAV is 1,175,000
|
$132.22
-11.06%
|
3/5/2014
|
$125.40
|
PP = $124.06
|
|
MB = $130.26
|
Most Recent Note - 3/24/2014 6:19:34 PM
Y - Recent slump below its old high close ($122.70 on 12/02/13) raised concerns as it completely negated the recent breakout. Still consolidating above its 50 DMA line, but its Relative Strength rating has slumped to 78, below the 80+ minimum guideline for buy candidates. See the latest FSU analysis for more details and new annotated graphs.
>>> FEATURED STOCK ARTICLE : Negated Recent Breakout and Testing Support at 50-Day Average - 3/24/2014
View all notes |
Set NEW NOTE alert |
CANSLIM.net Company Profile |
SEC
News |
Chart |
Request a new note
C
A N
S L
I M
|
GNRC
-
NYSE
Generac Hldgs Inc
Electrical-Power/Equipmt
|
$59.45
|
-1.13
-1.87% |
$60.93
|
434,736
45.67% of 50 DAV
50 DAV is 952,000
|
$62.50
-4.88%
|
2/14/2014
|
$56.50
|
PP = $57.39
|
|
MB = $60.26
|
Most Recent Note - 3/24/2014 6:23:09 PM
Y - Slumped below its "max buy" level with a loss on light volume and its color code is changed to yellow again. Prior highs in the $57 area define near-term support to watch.
>>> FEATURED STOCK ARTICLE : Bullish Gap Up Followed By Wedging and Stalling Action - 3/11/2014
View all notes |
Set NEW NOTE alert |
CANSLIM.net Company Profile |
SEC
News |
Chart |
Request a new note
C
A N
S L
I M
|
ICON
-
NASDAQ
Iconix Brand Group Inc
CONSUMER NON-DURABLES - Textile - Apparel Footwear
|
$40.52
|
+0.46
1.15% |
$40.80
|
589,524
94.17% of 50 DAV
50 DAV is 626,000
|
$42.47
-4.58%
|
3/7/2014
|
$41.46
|
PP = $40.88
|
|
MB = $42.92
|
Most Recent Note - 3/24/2014 6:25:58 PM
Y - Posted a gain today with slightly higher (near average) volume, consolidating near prior highs in the $40 area defining near-term support. More damaging losses and deterioration below recent lows ($39.75 on 3/14/14) would raise greater concerns.
>>> FEATURED STOCK ARTICLE : Encountered Distributional Pressure Following Recent Breakout - 3/7/2014
View all notes |
Set NEW NOTE alert |
CANSLIM.net Company Profile |
SEC
News |
Chart |
Request a new note
C
A N
S L
I M
|
Symbol/Exchange
Company Name
Industry Group |
PRICE |
CHANGE
(%Change) |
Day High |
Volume
(% DAV)
(% 50 day avg vol) |
52 Wk Hi
% From Hi |
Featured
Date |
Price
Featured |
Pivot Featured |
|
Max Buy |
KORS
-
NYSE
Michael Kors Hldgs Ltd
RETAIL - Apparel Stores
|
$94.11
|
-3.35
-3.44% |
$97.97
|
3,720,997
109.60% of 50 DAV
50 DAV is 3,395,000
|
$101.04
-6.86%
|
3/12/2014
|
$98.03
|
PP = $101.14
|
|
MB = $106.20
|
Most Recent Note - 3/24/2014 12:01:10 PM
Y - Down considerably today amid widespread weakness. Its 50 DMA line ($91.28) defines support above prior highs in the $84 area.
>>> FEATURED STOCK ARTICLE : Formed Advanced Base Pattern With Volume Totals Cooling - 3/12/2014
View all notes |
Set NEW NOTE alert |
CANSLIM.net Company Profile |
SEC
News |
Chart |
Request a new note
C
A N
S L
I M
|
PCLN
-
NASDAQ
Priceline.com Inc
INTERNET - Internet Software and Services
|
$1,227.93
|
-40.91
-3.22% |
$1,275.99
|
1,423,065
175.90% of 50 DAV
50 DAV is 809,000
|
$1,378.96
-10.95%
|
12/18/2013
|
$1,156.20
|
PP = $1,198.85
|
|
MB = $1,258.79
|
Most Recent Note - 3/24/2014 12:02:27 PM
G - Raising concerns while violating its 50 DMA line ($1,248) with today's damaging loss amid widespread weakness.
>>> FEATURED STOCK ARTICLE : Perched At Highs With Volume Totals Cooling - 3/10/2014
View all notes |
Set NEW NOTE alert |
CANSLIM.net Company Profile |
SEC
News |
Chart |
Request a new note
C
A N
S L
I M
|
PSIX
-
NASDAQ
Power Solutions Intl Inc
Machinery-Gen Industrial
|
$75.46
|
-4.50
-5.63% |
$79.99
|
81,960
128.06% of 50 DAV
50 DAV is 64,000
|
$87.40
-13.66%
|
2/28/2014
|
$74.65
|
PP = $76.93
|
|
MB = $80.78
|
Most Recent Note - 3/24/2014 11:56:49 AM
Y - Down considerably today, abruptly retreating back into the prior base and raising concerns. Testing support at its 50 DMA line after undercutting prior highs in the $78 area which recently acted as support.
>>> FEATURED STOCK ARTICLE : Halted Slide After Undercutting Prior Highs on Pullback - 3/18/2014
View all notes |
Set NEW NOTE alert |
CANSLIM.net Company Profile |
SEC
News |
Chart |
Request a new note
C
A N
S L
I M
|
SILC
-
NASDAQ
Silicom Ltd
COMPUTER HARDWARE - Networking andamp; Communication Dev
|
$68.50
|
-0.95
-1.37% |
$69.50
|
75,447
84.77% of 50 DAV
50 DAV is 89,000
|
$73.44
-6.73%
|
12/23/2013
|
$44.62
|
PP = $46.25
|
|
MB = $48.56
|
Most Recent Note - 3/24/2014 6:28:02 PM
G - Quietly consolidating well above its 50 DMA line ($63.61) defining near-term support. Previously noted - "Extended from any sound base. Patient investors may watch for a new base or secondary buy point to possibly develop and be noted in the weeks ahead."
>>> FEATURED STOCK ARTICLE : Traded Up +64.6% in Under 3 Months Since Featured in Mid-Day Report - 3/20/2014
View all notes |
Set NEW NOTE alert |
CANSLIM.net Company Profile |
SEC
News |
Chart |
Request a new note
C
A N
S L
I M
|
VRX
-
NYSE
Valeant Pharmaceuticals
DRUGS - Drug Manufacturers - Other
|
$131.47
|
-4.08
-3.01% |
$137.44
|
3,354,557
201.60% of 50 DAV
50 DAV is 1,664,000
|
$153.10
-14.13%
|
9/11/2013
|
$100.26
|
PP = $105.50
|
|
MB = $110.78
|
Most Recent Note - 3/24/2014 6:30:55 PM
G- Slumped further below its 50 DMA line today with another damaging loss on higher above average volume. Triggered a technical sell signal with its violation in the prior session when noted - "Only a prompt rebound above the 50 DMA line would help its outlook."
>>> FEATURED STOCK ARTICLE : Finding Support Above 50-Day Moving Average Line - 3/17/2014
View all notes |
Set NEW NOTE alert |
CANSLIM.net Company Profile |
SEC
News |
Chart |
Request a new note
C
A N
S L
I M
|
Symbol/Exchange
Company Name
Industry Group |
PRICE |
CHANGE
(%Change) |
Day High |
Volume
(% DAV)
(% 50 day avg vol) |
52 Wk Hi
% From Hi |
Featured
Date |
Price
Featured |
Pivot Featured |
|
Max Buy |
|
|
|
THESE ARE NOT BUY RECOMMENDATIONS!
Comments contained in the body of this report are technical
opinions only. The material herein has been obtained
from sources believed to be reliable and accurate, however,
its accuracy and completeness cannot be guaranteed.
This site is not an investment advisor, hence it does
not endorse or recommend any securities or other investments.
Any recommendation contained in this report may not
be suitable for all investors and it is not to be deemed
an offer or solicitation on our part with respect to
the purchase or sale of any securities. All trademarks,
service marks and trade names appearing in this report
are the property of their respective owners, and are
likewise used for identification purposes only.
This report is a service available
only to active Paid Premium Members.
You may opt-out of receiving report notifications
at any time. Questions or comments may be submitted
by writing to Premium Membership Services 665 S.E. 10 Street, Suite 201 Deerfield Beach, FL 33441-5634 or by calling 1-800-965-8307
or 954-785-1121.
|
|
|

