You are not logged in.
This means you
CAN ONLY VIEW reports that were published prior to Tuesday, April 15, 2025.
You
MUST UPGRADE YOUR MEMBERSHIP if you want to see any current reports.
AFTER MARKET UPDATE - TUESDAY, MARCH 25TH, 2014
Previous After Market Report Next After Market Report >>>
|
|
|
|
DOW |
+91.19 |
16,367.88 |
+0.56% |
|
Volume |
631,575,990 |
-12% |
|
Volume |
2,126,545,990 |
-6% |
|
NASDAQ |
+7.88 |
4,234.27 |
+0.19% |
|
Advancers |
1,790 |
57% |
|
Advancers |
1,354 |
49% |
|
S&P 500 |
+8.18 |
1,865.62 |
+0.44% |
|
Decliners |
1,234 |
39% |
|
Decliners |
1,309 |
48% |
|
Russell 2000 |
-0.18 |
1,178.05 |
-0.02% |
|
52 Wk Highs |
85 |
|
|
52 Wk Highs |
40 |
|
|
S&P 600 |
-0.27 |
671.55 |
-0.04% |
|
52 Wk Lows |
15 |
|
|
52 Wk Lows |
18 |
|
|
 |
Institutional Crowd Timid About Buying as Major Averages Rose With LessVolume
Kenneth J. Gruneisen - Passed the CAN SLIM® Master's Exam
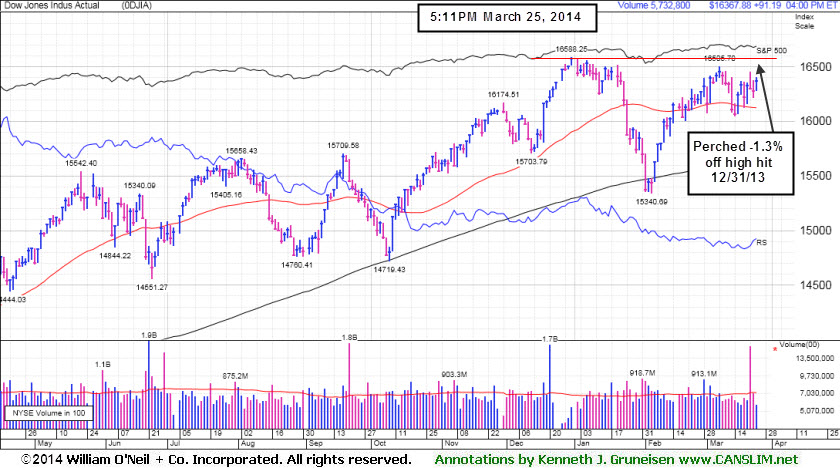
For Tuesday's session the major averages ended higher while small caps lagged. The volume totals were reported lighter on the NYSE and on the Nasdaq exchange, revealing little pep behind the institutional crowd's buying efforts. Advancers led decliners on the NYSE by a 3-2 margin on the NYSE while breadth was nearly even on the Nasdaq exchange. There were 19 high-ranked companies from the CANSLIM.net Leaders List that made new 52-week highs and appeared on the CANSLIM.net BreakOuts Page, up from the total of 10 stocks on the prior session. The list of stocks hitting new 52-week highs outnumbered new 52-week lows on the Nasdaq exchange and on the NYSE. There were gains for 5 of the 10 high-ranked companies currently included on the Featured Stocks Page. The Market (M criteria) uptrend faced some recent pressure and yet the rally has continued. For any rally to be sustained it is critical for there to be healthy leadership, so it remains crucial for many stocks to continue hitting new 52-week highs.
Stocks snapped a two-day losing streak as investors responded positively to largely better-than-expected economic data. Most sectors on the S&P ended higher. Healthcare stocks showed strength with shares of Gilead Sciences (GILD +1.25%) up, paring some of their recent declines.
On the earnings front, McCormick (MKC +5.47%) gapped up above its 200-day moving average (DMA) line after the company posted results ahead of analysts' estimates. Walgreen (WAG +3.28%) also finished higher following their quarterly report. In other news, shares of IBM (IBM +3.61%) rose after announcing a strategic partnership with Pitney Bowes (PBI +0.90%) .
Turning to fixed income markets, Treasuries ended lower along the curve. The benchmark 10-year note was down 1/8 of a point to yield 2.75% and the 30-year bond gave up nearly 1/2 of a point to yield 3.59%.
The CANSLIM.net Featured Stocks Page shows the most action-worthy candidates and their latest notes and a Headline Link directs members to the latest detailed analysis with data-packed graphs annotated by a Certified expert along with links to additional resources. The Premium Member Homepage includes "dynamic archives" to all prior pay reports published. Watch for an announcement via email concerning the next WEBCAST.
PICTURED: The Dow Jones Industrial Average is consolidating above its 50-day moving average (DMA) line, -1.3% off its all-time high hit on 12/31/13.
|
 Kenneth J. Gruneisen started out as a licensed stockbroker in August 1987, a couple of months prior to the historic stock market crash that took the Dow Jones Industrial Average down -22.6% in a single day. He has published daily fact-based fundamental and technical analysis on high-ranked stocks online for two decades. Through FACTBASEDINVESTING.COM, Kenneth provides educational articles, news, market commentary, and other information regarding proven investment systems that work in good times and bad.
Comments contained in the body of this report are technical opinions only and are not necessarily those of Gruneisen Growth Corp. The material herein has been obtained from sources believed to be reliable and accurate, however, its accuracy and completeness cannot be guaranteed. Our firm, employees, and customers may effect transactions, including transactions contrary to any recommendation herein, or have positions in the securities mentioned herein or options with respect thereto. Any recommendation contained in this report may not be suitable for all investors and it is not to be deemed an offer or solicitation on our part with respect to the purchase or sale of any securities. |
|
 |
Tech and Commodity-Linked Groups Rose While Retail and Broker/Dealers Fell
Kenneth J. Gruneisen - Passed the CAN SLIM® Master's Exam
The Retail Index ($RLX -0.45%) and the Broker/Dealer Index ($XBD -0.57%) both suffered modest losses which had a negative influence on the major averages while the Bank Index ($BKX +0.04%) finished flat. Commodity-linked groups rose, led by the energy-linked Integrated Oil Index ($XOI +0.79%) and the Oil Services Index ($OSX +1.14%), followed by the Gold & Silver Index ($XAU +0.64%). The Networking Index ($NWX +0.85%) and the Semiconductor Index ($SOX +0.77%) posted modest gains while the Biotechnology Index ($BTK -0.07%) was virtually unchanged.
Charts courtesy www.stockcharts.com

PICTURED: The Oil Services Index ($OSX +1.14%) is consolidating -3% off its 52-week high, above its 50-day and 200-day moving average (DMA) lines.
| Oil Services |
$OSX |
284.37 |
+3.20 |
+1.14% |
+1.19% |
| Integrated Oil |
$XOI |
1,488.92 |
+11.67 |
+0.79% |
-0.95% |
| Semiconductor |
$SOX |
584.33 |
+4.48 |
+0.77% |
+9.21% |
| Networking |
$NWX |
339.80 |
+2.86 |
+0.85% |
+4.90% |
| Broker/Dealer |
$XBD |
161.60 |
-0.92 |
-0.57% |
+0.65% |
| Retail |
$RLX |
898.41 |
-4.08 |
-0.45% |
-4.40% |
| Gold & Silver |
$XAU |
94.52 |
+0.60 |
+0.64% |
+12.32% |
| Bank |
$BKX |
72.66 |
+0.03 |
+0.04% |
+4.91% |
| Biotech |
$BTK |
2,615.14 |
-2.48 |
-0.09% |
+12.22% |
|
|
|
 |
Falling Back Under Prior Highs Raises Concerns
Kenneth J. Gruneisen - Passed the CAN SLIM® Master's Exam
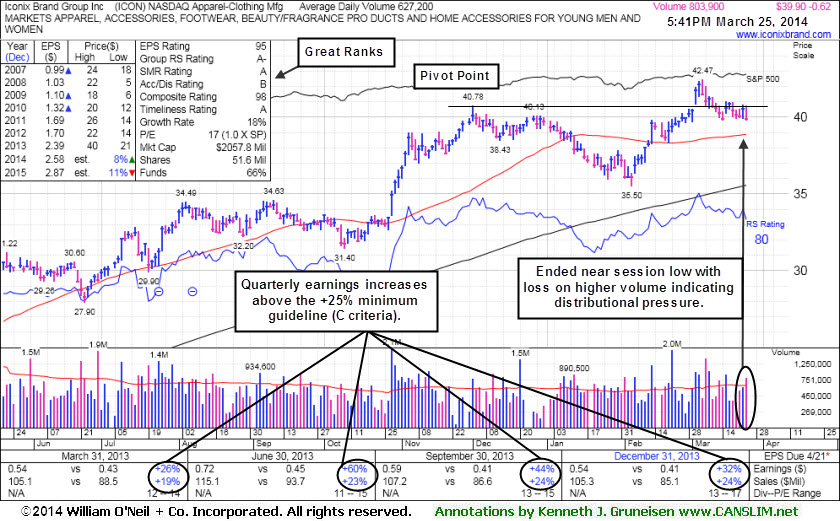
Iconix Brand Group Inc (ICON -$0.62 or -1.08% to $39.90) finished near the session low today with a loss on higher (above average) volume indicating that it was encountering more distributional pressure. It raised concerns as it undercut prior highs in the $40 area defining near-term support and negated the recent technical breakout while slumping back into the prior base. More damaging losses and deterioration below recent lows ($39.75 on 3/14/14) could more serious concerns. Its Relative Strength Rating is at 80, the bare minimum rating for buy candidates under the fact-based system. It was last shown in this FSU section on 3/07/14 with annotated graphs under the headline, "Encountered Distributional Pressure Following Recent Breakout".
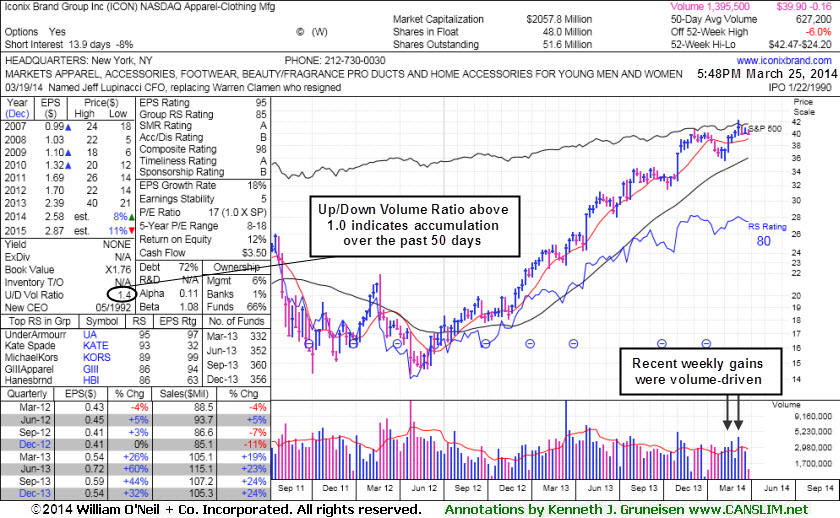
The weekly chart shows recent weekly gains were backed by above average volume. Its Up/Down Volume Ratio of 1.4 currently is an unbiased indication that shares have been under accumulation over the past 50 days. Disciplined investors always limit losses by selling any stock that falls more than -7% from their purchase price. It is consolidating above prior highs in the $40 area defining near-term support.
The high-ranked Apparel - Clothing Manufacturing firm reported earnings +32% on +24% sales revenues for the Dec '13 quarter, marking its 4th consecutive quarterly earnings increase above the +25% guideline (C criteria). Its annual earnings (A criteria) history has been steady. The number of top-rated funds owning its shares rose from 333 in Mar '13 to 356 in Dec '13, a reassuring sign concerning the I criteria.
|
|
|
Color Codes Explained :
Y - Better candidates highlighted by our
staff of experts.
G - Previously featured
in past reports as yellow but may no longer be buyable under the
guidelines.
***Last / Change / Volume data in this table is the closing quote data***
Symbol/Exchange
Company Name
Industry Group |
PRICE |
CHANGE
(%Change) |
Day High |
Volume
(% DAV)
(% 50 day avg vol) |
52 Wk Hi
% From Hi |
Featured
Date |
Price
Featured |
Pivot Featured |
|
Max Buy |
EQM
-
NYSE
E Q T Midstream Partners
ENERGY - Oil and Gas Pipelines
|
$68.40
|
+0.26
0.38% |
$68.99
|
93,330
89.74% of 50 DAV
50 DAV is 104,000
|
$69.66
-1.81%
|
12/12/2013
|
$53.17
|
PP = $56.51
|
|
MB = $59.34
|
Most Recent Note - 3/21/2014 7:58:05 PM
G - Posted a gain today for a best-ever close. Held its ground since reporting earnings -2% on +22% sales revenues for the Dec '13 quarter, below the +25% minimum earnings guideline (C criteria), raising fundamental concerns. Its 50 DMA line defines near-term support where a violation may trigger a technical sell signal. See the latest FSU analysis for more details and new annotated graphs.
>>> FEATURED STOCK ARTICLE : Hit New Highs But Fundamental Concerns Remain - 3/21/2014
View all notes |
Set NEW NOTE alert |
CANSLIM.net Company Profile |
SEC
News |
Chart |
Request a new note
C
A N
S L
I M


|
FB
-
NASDAQ
Facebook Inc Cl A
INTERNET
|
$64.89
|
+0.79
1.23% |
$66.19
|
68,406,017
118.00% of 50 DAV
50 DAV is 57,970,000
|
$72.59
-10.61%
|
12/12/2013
|
$51.40
|
PP = $54.93
|
|
MB = $57.68
|
Most Recent Note - 3/24/2014 11:59:26 AM
G - Down considerably today amid widespread weakness. Testing its 50 DMA line ($64.36 now) which defines near-term support to watch.
>>> FEATURED STOCK ARTICLE : Pulling Back After Getting Extended From Prior Base - 3/14/2014
View all notes |
Set NEW NOTE alert |
CANSLIM.net Company Profile |
SEC
News |
Chart |
Request a new note
C
A N
S L
I M
|
FLT
-
NYSE
Fleetcor Technologies
DIVERSIFIED SERVICES - Business/Management Services
|
$115.38
|
-2.21
-1.88% |
$118.95
|
680,573
57.55% of 50 DAV
50 DAV is 1,182,500
|
$132.22
-12.74%
|
3/5/2014
|
$125.40
|
PP = $124.06
|
|
MB = $130.26
|
Most Recent Note - 3/24/2014 6:19:34 PM
Y - Recent slump below its old high close ($122.70 on 12/02/13) raised concerns as it completely negated the recent breakout. Still consolidating above its 50 DMA line, but its Relative Strength rating has slumped to 78, below the 80+ minimum guideline for buy candidates. See the latest FSU analysis for more details and new annotated graphs.
>>> FEATURED STOCK ARTICLE : Negated Recent Breakout and Testing Support at 50-Day Average - 3/24/2014
View all notes |
Set NEW NOTE alert |
CANSLIM.net Company Profile |
SEC
News |
Chart |
Request a new note
C
A N
S L
I M
|
GNRC
-
NYSE
Generac Hldgs Inc
Electrical-Power/Equipmt
|
$59.53
|
+0.08
0.13% |
$60.25
|
423,976
44.63% of 50 DAV
50 DAV is 950,000
|
$62.50
-4.75%
|
2/14/2014
|
$56.50
|
PP = $57.39
|
|
MB = $60.26
|
Most Recent Note - 3/24/2014 6:23:09 PM
Y - Slumped below its "max buy" level with a loss on light volume and its color code is changed to yellow again. Prior highs in the $57 area define near-term support to watch.
>>> FEATURED STOCK ARTICLE : Bullish Gap Up Followed By Wedging and Stalling Action - 3/11/2014
View all notes |
Set NEW NOTE alert |
CANSLIM.net Company Profile |
SEC
News |
Chart |
Request a new note
C
A N
S L
I M
|
ICON
-
NASDAQ
Iconix Brand Group Inc
CONSUMER NON-DURABLES - Textile - Apparel Footwear
|
$39.90
|
-0.62
-1.53% |
$40.77
|
805,442
128.46% of 50 DAV
50 DAV is 627,000
|
$42.47
-6.04%
|
3/7/2014
|
$41.46
|
PP = $40.88
|
|
MB = $42.92
|
 Most Recent Note - 3/25/2014 6:07:38 PM
Y - Ended near the session low today with a loss on higher volume, sputtering near prior highs in the $40 area. More damaging losses and deterioration below recent lows ($39.75 on 3/14/14) would raise greater concerns. See the latest FSU analysis for more details and new annotated graphs.
>>> FEATURED STOCK ARTICLE : Falling Back Under Prior Highs Raises Concerns - 3/25/2014
View all notes |
Set NEW NOTE alert |
CANSLIM.net Company Profile |
SEC
News |
Chart |
Request a new note
C
A N
S L
I M
|
Symbol/Exchange
Company Name
Industry Group |
PRICE |
CHANGE
(%Change) |
Day High |
Volume
(% DAV)
(% 50 day avg vol) |
52 Wk Hi
% From Hi |
Featured
Date |
Price
Featured |
Pivot Featured |
|
Max Buy |
KORS
-
NYSE
Michael Kors Hldgs Ltd
RETAIL - Apparel Stores
|
$93.44
|
-0.67
-0.71% |
$95.07
|
3,030,873
89.09% of 50 DAV
50 DAV is 3,402,000
|
$101.04
-7.52%
|
3/12/2014
|
$98.03
|
PP = $101.14
|
|
MB = $106.20
|
Most Recent Note - 3/24/2014 12:01:10 PM
Y - Down considerably today amid widespread weakness. Its 50 DMA line ($91.28) defines support above prior highs in the $84 area.
>>> FEATURED STOCK ARTICLE : Formed Advanced Base Pattern With Volume Totals Cooling - 3/12/2014
View all notes |
Set NEW NOTE alert |
CANSLIM.net Company Profile |
SEC
News |
Chart |
Request a new note
C
A N
S L
I M
|
PCLN
-
NASDAQ
Priceline.com Inc
INTERNET - Internet Software and Services
|
$1,223.70
|
-4.23
-0.34% |
$1,244.80
|
1,418,733
171.34% of 50 DAV
50 DAV is 828,000
|
$1,378.96
-11.26%
|
12/18/2013
|
$1,156.20
|
PP = $1,198.85
|
|
MB = $1,258.79
|
Most Recent Note - 3/25/2014 2:03:48 PM
G - Still sputtering below its 50 DMA line today while on track for a 3rd consecutive loss with above average and ever-increasing volume, action indicative of distributional pressure. Disciplined investors avoid chasing extended stocks and always sell if any stock falls more than -7% from their purchase price.
>>> FEATURED STOCK ARTICLE : Perched At Highs With Volume Totals Cooling - 3/10/2014
View all notes |
Set NEW NOTE alert |
CANSLIM.net Company Profile |
SEC
News |
Chart |
Request a new note
C
A N
S L
I M
|
PSIX
-
NASDAQ
Power Solutions Intl Inc
Machinery-Gen Industrial
|
$75.20
|
-0.26
-0.34% |
$77.40
|
74,208
114.17% of 50 DAV
50 DAV is 65,000
|
$87.40
-13.96%
|
2/28/2014
|
$74.65
|
PP = $76.93
|
|
MB = $80.78
|
Most Recent Note - 3/24/2014 11:56:49 AM
Y - Down considerably today, abruptly retreating back into the prior base and raising concerns. Testing support at its 50 DMA line after undercutting prior highs in the $78 area which recently acted as support.
>>> FEATURED STOCK ARTICLE : Halted Slide After Undercutting Prior Highs on Pullback - 3/18/2014
View all notes |
Set NEW NOTE alert |
CANSLIM.net Company Profile |
SEC
News |
Chart |
Request a new note
C
A N
S L
I M
|
SILC
-
NASDAQ
Silicom Ltd
COMPUTER HARDWARE - Networking andamp; Communication Dev
|
$68.67
|
+0.17
0.25% |
$69.77
|
35,569
39.52% of 50 DAV
50 DAV is 90,000
|
$73.44
-6.50%
|
12/23/2013
|
$44.62
|
PP = $46.25
|
|
MB = $48.56
|
Most Recent Note - 3/24/2014 6:28:02 PM
G - Quietly consolidating well above its 50 DMA line ($63.61) defining near-term support. Previously noted - "Extended from any sound base. Patient investors may watch for a new base or secondary buy point to possibly develop and be noted in the weeks ahead."
>>> FEATURED STOCK ARTICLE : Traded Up +64.6% in Under 3 Months Since Featured in Mid-Day Report - 3/20/2014
View all notes |
Set NEW NOTE alert |
CANSLIM.net Company Profile |
SEC
News |
Chart |
Request a new note
C
A N
S L
I M
|
VRX
-
NYSE
Valeant Pharmaceuticals
DRUGS - Drug Manufacturers - Other
|
$131.53
|
+0.06
0.05% |
$134.88
|
1,417,466
83.09% of 50 DAV
50 DAV is 1,706,000
|
$153.10
-14.09%
|
9/11/2013
|
$100.26
|
PP = $105.50
|
|
MB = $110.78
|
Most Recent Note - 3/24/2014 6:30:55 PM
G- Slumped further below its 50 DMA line today with another damaging loss on higher above average volume. Triggered a technical sell signal with its violation in the prior session when noted - "Only a prompt rebound above the 50 DMA line would help its outlook."
>>> FEATURED STOCK ARTICLE : Finding Support Above 50-Day Moving Average Line - 3/17/2014
View all notes |
Set NEW NOTE alert |
CANSLIM.net Company Profile |
SEC
News |
Chart |
Request a new note
C
A N
S L
I M
|
Symbol/Exchange
Company Name
Industry Group |
PRICE |
CHANGE
(%Change) |
Day High |
Volume
(% DAV)
(% 50 day avg vol) |
52 Wk Hi
% From Hi |
Featured
Date |
Price
Featured |
Pivot Featured |
|
Max Buy |
|
|
|
THESE ARE NOT BUY RECOMMENDATIONS!
Comments contained in the body of this report are technical
opinions only. The material herein has been obtained
from sources believed to be reliable and accurate, however,
its accuracy and completeness cannot be guaranteed.
This site is not an investment advisor, hence it does
not endorse or recommend any securities or other investments.
Any recommendation contained in this report may not
be suitable for all investors and it is not to be deemed
an offer or solicitation on our part with respect to
the purchase or sale of any securities. All trademarks,
service marks and trade names appearing in this report
are the property of their respective owners, and are
likewise used for identification purposes only.
This report is a service available
only to active Paid Premium Members.
You may opt-out of receiving report notifications
at any time. Questions or comments may be submitted
by writing to Premium Membership Services 665 S.E. 10 Street, Suite 201 Deerfield Beach, FL 33441-5634 or by calling 1-800-965-8307
or 954-785-1121.
|
|
|

