You are not logged in.
This means you
CAN ONLY VIEW reports that were published prior to Tuesday, April 15, 2025.
You
MUST UPGRADE YOUR MEMBERSHIP if you want to see any current reports.
AFTER MARKET UPDATE - FRIDAY, MARCH 21ST, 2014
Previous After Market Report Next After Market Report >>>
|
|
|
|
DOW |
-28.28 |
16,302.77 |
-0.17% |
|
Volume |
1,982,658,210 |
+220% |
|
Volume |
2,831,700,700 |
+65% |
|
NASDAQ |
-42.50 |
4,276.79 |
-0.98% |
|
Advancers |
1,788 |
57% |
|
Advancers |
1,159 |
40% |
|
S&P 500 |
-5.49 |
1,866.52 |
-0.29% |
|
Decliners |
1,276 |
40% |
|
Decliners |
1,664 |
58% |
|
Russell 2000 |
-5.24 |
1,193.73 |
-0.44% |
|
52 Wk Highs |
197 |
|
|
52 Wk Highs |
168 |
|
|
S&P 600 |
-1.71 |
678.37 |
-0.25% |
|
52 Wk Lows |
20 |
|
|
52 Wk Lows |
23 |
|
|
 |
Major Averages Ended Weak as Distributional Pressure Mounted
Kenneth J. Gruneisen - Passed the CAN SLIM® Master's Exam
For the week, the Dow gained +1.4%, the S&P 500 added +1.3% and the NASDAQ advanced +0.7%. Friday's volume totals were reported higher on the NYSE and on the Nasdaq exchange, inflated by options expirations. Advancers led decliners by nearly a 3-2 margin on the NYSE but decliners led advancers by nearly a 3-2 margin on the Nasdaq exchange. There were 58 high-ranked companies from the CANSLIM.net Leaders List that made new 52-week highs and appeared on the CANSLIM.net BreakOuts Page, up from the total of 41 stocks on the prior session. The list of stocks hitting new 52-week highs easily outnumbered new 52-week lows on the Nasdaq exchange and on the NYSE. There were gains for 3 of the 11 high-ranked companies currently included on the Featured Stocks Page. The Market (M criteria) uptrend faced some recent pressure and yet the rally has continued. For any rally to be sustained it is critical for there to be healthy leadership, so it remains crucial for many stocks to continue hitting new 52-week highs.
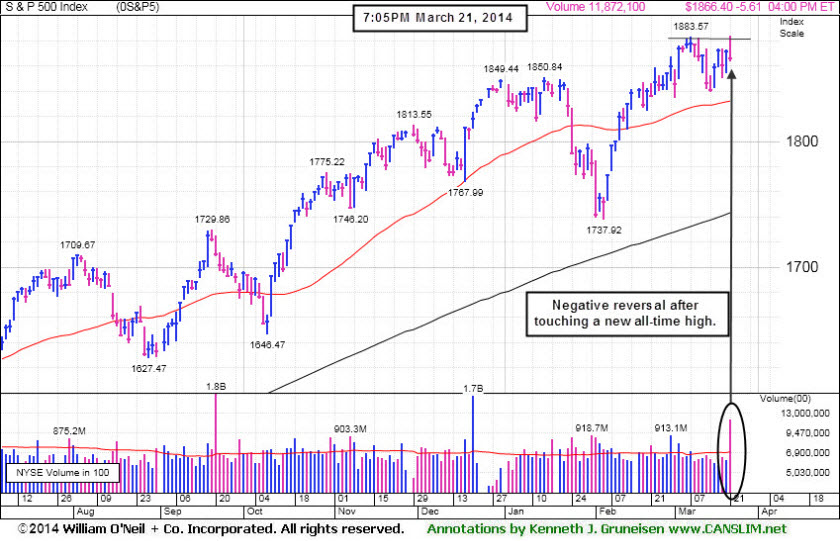
Stocks faded into Friday's closing bell. The Dow Jones Industrial Average ended 28 points lower at 16,305.14 after being up by as many as b points earlier. The S&P 500 gave up 5 points to 1,866 after touching a new all-time intra-day high. The NASDAQ shed 42 points with the index closing at 4,276.
Equities were volatile as investors focused on quadruple witching and lingering geopolitical concerns. Sector action on the S&P was mixed. Healthcare stocks were under pressure on weakness in biotechs. Shares of Gilead Sciences (GILD -4.6%) led the space lower as the U.S. House Energy and Commerce committee asked for details surrounding the pricing of its hepatitis C drug.
On the earnings front, shares of Nike (NKE -5.1%) fell and Darden Restaurants (DRI +2.7%) rose following their quarterly profit tallies.
Turning to fixed income markets, Treasuries ended higher along the curve. The benchmark 10-year note was up 7/32 to yield 2.75% and the 30-year bond added 29/32 to yield 3.61%.
The CANSLIM.net Featured Stocks Page shows the most action-worthy candidates and their latest notes and a Headline Link directs members to the latest detailed analysis with data-packed graphs annotated by a Certified expert along with links to additional resources. The Premium Member Homepage includes "dynamic archives" to all prior pay reports published. Watch for an announcement via email concerning the next WEBCAST.
PICTURED: The S&P 500 Index encountered distributional pressure as it touched a new all-time high on Friday then reversed into the red for a loss on heavy volume.
|
 Kenneth J. Gruneisen started out as a licensed stockbroker in August 1987, a couple of months prior to the historic stock market crash that took the Dow Jones Industrial Average down -22.6% in a single day. He has published daily fact-based fundamental and technical analysis on high-ranked stocks online for two decades. Through FACTBASEDINVESTING.COM, Kenneth provides educational articles, news, market commentary, and other information regarding proven investment systems that work in good times and bad.
Comments contained in the body of this report are technical opinions only and are not necessarily those of Gruneisen Growth Corp. The material herein has been obtained from sources believed to be reliable and accurate, however, its accuracy and completeness cannot be guaranteed. Our firm, employees, and customers may effect transactions, including transactions contrary to any recommendation herein, or have positions in the securities mentioned herein or options with respect thereto. Any recommendation contained in this report may not be suitable for all investors and it is not to be deemed an offer or solicitation on our part with respect to the purchase or sale of any securities. |
|
 |
Financial, Retail, and Tech Groups Led Decliners
Kenneth J. Gruneisen - Passed the CAN SLIM® Master's Exam
The Biotechnology Index ($BTK -3.94%) led the tech sector's retreat while the Semiconductor Index ($SOX -0.87%) and the Networking Index ($NWX -0.70%) suffered smaller losses. The Retail Index ($RLX -0.46%) created a drag on the major averages and the Broker/Dealer Index ($XBD -0.94%) outpaced the Bank Index ($BKX -0.29%) to the downside. The Oil Services Index ($OSX +1.03%) posted a solid gain while the Integrated Oil Index ($XOI -0.01%) and the Gold & Silver Index ($XAU -0.04%) finished flat.
Charts courtesy www.stockcharts.com
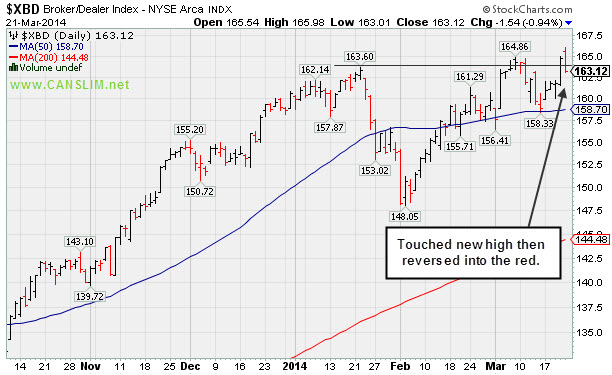
PICTURED 1: The Broker/Dealer Index ($XBD -0.94%) touched a new high then reversed into the red on Friday.
Charts courtesy www.stockcharts.com
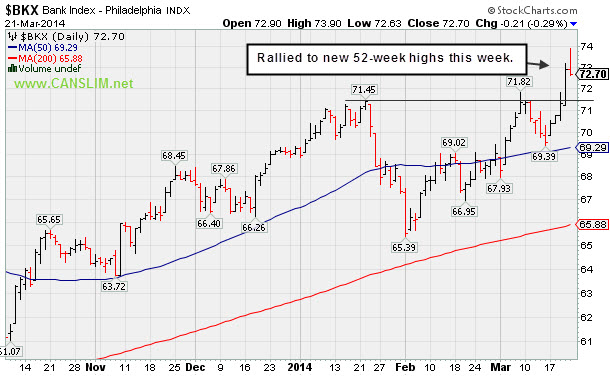
PICTURED 2: The Bank Index ($BKX -0.29%) rallied to new highs this week.
| Oil Services |
$OSX |
284.42 |
+2.90 |
+1.03% |
+1.21% |
| Integrated Oil |
$XOI |
1,477.48 |
-0.08 |
-0.01% |
-1.71% |
| Semiconductor |
$SOX |
582.54 |
-5.09 |
-0.87% |
+8.88% |
| Networking |
$NWX |
343.15 |
-2.41 |
-0.70% |
+5.93% |
| Broker/Dealer |
$XBD |
163.12 |
-1.54 |
-0.94% |
+1.59% |
| Retail |
$RLX |
922.06 |
-0.69 |
-0.07% |
-1.89% |
| Gold & Silver |
$XAU |
98.51 |
-0.04 |
-0.04% |
+17.06% |
| Bank |
$BKX |
72.91 |
+1.59 |
+2.23% |
+5.27% |
| Biotech |
$BTK |
2,685.74 |
-110.25 |
-3.94% |
+15.25% |
|
|
|
 |
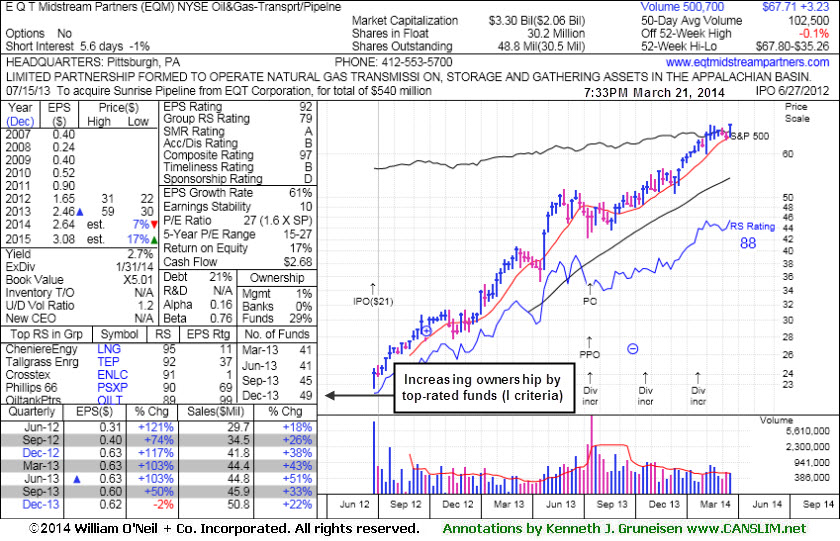
Hit New Highs But Fundamental Concerns Remain
Kenneth J. Gruneisen - Passed the CAN SLIM® Master's Exam
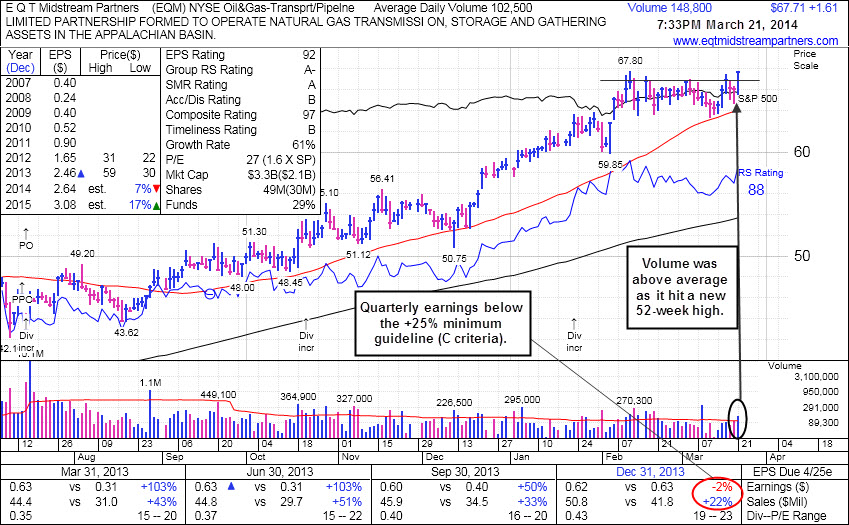
E Q T Midstream Partners (EQM +$1.61 or +2.44% to $67.71) hit a new 52-week high and finished strong with today's volume-driven gain. It recently found support above its 50-day moving average (DMA) line. It has been stubbornly holding its ground since reporting earnings -2% on +22% sales revenues for the Dec '13 quarter, below the +25% minimum earnings guideline (C criteria), raising fundamental concerns. Its 50-day moving average (DMA) line ($64 now) defines near-term support where a violation may trigger a technical sell signal. Its last appearance in this FSU section was on 3/03/14 under the headline, "Resilient Despite Fundamental Concerns".
It traded up nearly +20% since first highlighted in yellow in the 12/12/13 mid-day report (read here) with new pivot point cited based on its 11/18/13 high plus 10 cents. The fact-based system suggests watching for technical sell signals rather than selling purely on fundmentals, yet is wise to sometimes lock in gains at the +20% level. For those watching it and still giving it the benefit of the doubt, recent lows in the $63 area define near-term support above its 50-day moving average (DMA) line where subsequent violations may trigger more worrisome technical sell signals.
It completed a new Public Offering on 7/16/13, then made gradual progress afterward. This MLP in the Natural Gas business has seen the number of top-rated funds owning its shares rise from 20 in Jun '12 to 50 in Dec '13, a reassuring sign concerning the I criteria. Its Up/Down Volume Ratio of 1.5 is an unbiased indication its shares have been under accumulation over the past 50 days.
|
|
|
Color Codes Explained :
Y - Better candidates highlighted by our
staff of experts.
G - Previously featured
in past reports as yellow but may no longer be buyable under the
guidelines.
***Last / Change / Volume data in this table is the closing quote data***
Symbol/Exchange
Company Name
Industry Group |
PRICE |
CHANGE
(%Change) |
Day High |
Volume
(% DAV)
(% 50 day avg vol) |
52 Wk Hi
% From Hi |
Featured
Date |
Price
Featured |
Pivot Featured |
|
Max Buy |
EQM
-
NYSE
E Q T Midstream Partners
ENERGY - Oil and Gas Pipelines
|
$67.71
|
+1.61
2.44% |
$67.71
|
149,476
146.55% of 50 DAV
50 DAV is 102,000
|
$67.80
-0.13%
|
12/12/2013
|
$53.17
|
PP = $56.51
|
|
MB = $59.34
|
 Most Recent Note - 3/21/2014 7:58:05 PM
G - Posted a gain today for a best-ever close. Held its ground since reporting earnings -2% on +22% sales revenues for the Dec '13 quarter, below the +25% minimum earnings guideline (C criteria), raising fundamental concerns. Its 50 DMA line defines near-term support where a violation may trigger a technical sell signal. See the latest FSU analysis for more details and new annotated graphs.
>>> FEATURED STOCK ARTICLE : Hit New Highs But Fundamental Concerns Remain - 3/21/2014
View all notes |
Set NEW NOTE alert |
CANSLIM.net Company Profile |
SEC
News |
Chart |
Request a new note
C
A N
S L
I M


|
FB
-
NASDAQ
Facebook Inc Cl A
INTERNET
|
$67.24
|
+0.27
0.40% |
$67.92
|
60,016,256
103.41% of 50 DAV
50 DAV is 58,038,000
|
$72.59
-7.37%
|
12/12/2013
|
$51.40
|
PP = $54.93
|
|
MB = $57.68
|
Most Recent Note - 3/21/2014 7:59:35 PM
G - Extended from any sound base. Consolidating above its 50 DMA line ($64.25 now) which defines near-term support to watch.
>>> FEATURED STOCK ARTICLE : Pulling Back After Getting Extended From Prior Base - 3/14/2014
View all notes |
Set NEW NOTE alert |
CANSLIM.net Company Profile |
SEC
News |
Chart |
Request a new note
C
A N
S L
I M
|
FLT
-
NYSE
Fleetcor Technologies
DIVERSIFIED SERVICES - Business/Management Services
|
$120.47
|
+0.68
0.57% |
$120.64
|
1,825,398
158.52% of 50 DAV
50 DAV is 1,151,500
|
$132.22
-8.89%
|
3/5/2014
|
$125.40
|
PP = $124.06
|
|
MB = $130.26
|
Most Recent Note - 3/17/2014 6:50:43 PM
Y - Recent slump below its old high close ($122.70 on 12/02/13) raised concerns as it completely negated the recent breakout. Still consolidating above its 50 DMA line, but its Relative Strength rating has slumped to 78, below the 80+ minimum guideline for buy candidates.
>>> FEATURED STOCK ARTICLE : Consolidating Following Recent Breakout to New High Territory - 3/5/2014
View all notes |
Set NEW NOTE alert |
CANSLIM.net Company Profile |
SEC
News |
Chart |
Request a new note
C
A N
S L
I M
|
GNRC
-
NYSE
Generac Hldgs Inc
Electrical-Power/Equipmt
|
$60.58
|
-0.13
-0.21% |
$61.40
|
508,752
52.61% of 50 DAV
50 DAV is 967,000
|
$62.50
-3.07%
|
2/14/2014
|
$56.50
|
PP = $57.39
|
|
MB = $60.26
|
Most Recent Note - 3/21/2014 8:01:09 PM
G - Consolidating just above its "max buy" level. Prior highs in the $57 area define near-term support to watch.
>>> FEATURED STOCK ARTICLE : Bullish Gap Up Followed By Wedging and Stalling Action - 3/11/2014
View all notes |
Set NEW NOTE alert |
CANSLIM.net Company Profile |
SEC
News |
Chart |
Request a new note
C
A N
S L
I M
|
ICON
-
NASDAQ
Iconix Brand Group Inc
CONSUMER NON-DURABLES - Textile - Apparel Footwear
|
$40.06
|
-0.12
-0.30% |
$40.56
|
539,887
85.28% of 50 DAV
50 DAV is 633,100
|
$42.47
-5.67%
|
3/7/2014
|
$41.46
|
PP = $40.88
|
|
MB = $42.92
|
Most Recent Note - 3/17/2014 12:10:11 PM
Y - Halting its 4-session losing streak with a gain today. Prior highs in the $40 area define near-term support. Highlighted in yellow with pivot point cited based on its 12/02/13 high plus 10 cents in the 3/07/14 mid-day report (read here) and covered in greater detail with annotated graphs in that evening's report.
>>> FEATURED STOCK ARTICLE : Encountered Distributional Pressure Following Recent Breakout - 3/7/2014
View all notes |
Set NEW NOTE alert |
CANSLIM.net Company Profile |
SEC
News |
Chart |
Request a new note
C
A N
S L
I M
|
Symbol/Exchange
Company Name
Industry Group |
PRICE |
CHANGE
(%Change) |
Day High |
Volume
(% DAV)
(% 50 day avg vol) |
52 Wk Hi
% From Hi |
Featured
Date |
Price
Featured |
Pivot Featured |
|
Max Buy |
KORS
-
NYSE
Michael Kors Hldgs Ltd
RETAIL - Apparel Stores
|
$97.46
|
-0.21
-0.22% |
$99.17
|
2,351,355
67.37% of 50 DAV
50 DAV is 3,490,000
|
$101.04
-3.54%
|
3/12/2014
|
$98.03
|
PP = $101.14
|
|
MB = $106.20
|
Most Recent Note - 3/19/2014 6:07:36 PM
Y - Still stubbornly holding its ground in a very tight range near its 52-week high. Its 50 DMA line ($90) defines the nearest support above prior highs in the $84 area.
>>> FEATURED STOCK ARTICLE : Formed Advanced Base Pattern With Volume Totals Cooling - 3/12/2014
View all notes |
Set NEW NOTE alert |
CANSLIM.net Company Profile |
SEC
News |
Chart |
Request a new note
C
A N
S L
I M
|
PCLN
-
NASDAQ
Priceline.com Inc
INTERNET - Internet Software and Services
|
$1,268.84
|
-23.56
-1.82% |
$1,316.99
|
1,170,356
147.03% of 50 DAV
50 DAV is 796,000
|
$1,378.96
-7.99%
|
12/18/2013
|
$1,156.20
|
PP = $1,198.85
|
|
MB = $1,258.79
|
Most Recent Note - 3/17/2014 12:14:38 PM
G - Halting its slide today after 2 consecutive big losses and closes near the session lows. Near-term support to watch is its 50 DMA line ($1,235).
>>> FEATURED STOCK ARTICLE : Perched At Highs With Volume Totals Cooling - 3/10/2014
View all notes |
Set NEW NOTE alert |
CANSLIM.net Company Profile |
SEC
News |
Chart |
Request a new note
C
A N
S L
I M
|
PSIX
-
NASDAQ
Power Solutions Intl Inc
Machinery-Gen Industrial
|
$79.96
|
-3.68
-4.40% |
$84.44
|
61,329
95.83% of 50 DAV
50 DAV is 64,000
|
$87.40
-8.51%
|
2/28/2014
|
$74.65
|
PP = $76.93
|
|
MB = $80.78
|
Most Recent Note - 3/21/2014 7:50:28 PM
Y - Pulled back below its "max buy" level again today and its color code is changed to yellow. Prior highs in the $78 area recently acted as support.
>>> FEATURED STOCK ARTICLE : Halted Slide After Undercutting Prior Highs on Pullback - 3/18/2014
View all notes |
Set NEW NOTE alert |
CANSLIM.net Company Profile |
SEC
News |
Chart |
Request a new note
C
A N
S L
I M
|
SILC
-
NASDAQ
Silicom Ltd
COMPUTER HARDWARE - Networking andamp; Communication Dev
|
$69.45
|
-0.47
-0.67% |
$70.32
|
78,165
88.82% of 50 DAV
50 DAV is 88,000
|
$73.44
-5.43%
|
12/23/2013
|
$44.62
|
PP = $46.25
|
|
MB = $48.56
|
Most Recent Note - 3/20/2014 5:57:12 PM
G - Posted a 5th consecutive small gain today with increasing volume. See the latest FSU analysis for more details and new annotated graphs. Previously noted - "Extended from any sound base. Patient investors may watch for a new base or secondary buy point to possibly develop and be noted in the weeks ahead."
>>> FEATURED STOCK ARTICLE : Traded Up +64.6% in Under 3 Months Since Featured in Mid-Day Report - 3/20/2014
View all notes |
Set NEW NOTE alert |
CANSLIM.net Company Profile |
SEC
News |
Chart |
Request a new note
C
A N
S L
I M
|
ULTI
-
NASDAQ
Ultimate Software Group
INTERNET - Internet Software and Services
|
$150.48
|
-4.07
-2.63% |
$157.25
|
310,996
146.21% of 50 DAV
50 DAV is 212,700
|
$171.96
-12.49%
|
1/27/2014
|
$153.75
|
PP = $162.98
|
|
MB = $171.13
|
Most Recent Note - 3/21/2014 7:52:51 PM
Slumped for a damaging loss on above average volume today. Its Relative Strength rating has slumped to 70, below the 80+ minimum guideline. It will be dropped from the Featured Stocks list tonight.
>>> FEATURED STOCK ARTICLE : Following Violation 50-Day Moving Average Acted as Resistance - 3/19/2014
View all notes |
Set NEW NOTE alert |
CANSLIM.net Company Profile |
SEC
News |
Chart |
Request a new note
C
A N
S L
I M
|
Symbol/Exchange
Company Name
Industry Group |
PRICE |
CHANGE
(%Change) |
Day High |
Volume
(% DAV)
(% 50 day avg vol) |
52 Wk Hi
% From Hi |
Featured
Date |
Price
Featured |
Pivot Featured |
|
Max Buy |
VRX
-
NYSE
Valeant Pharmaceuticals
DRUGS - Drug Manufacturers - Other
|
$135.55
|
-4.85
-3.45% |
$141.00
|
2,002,099
118.89% of 50 DAV
50 DAV is 1,684,000
|
$153.10
-11.46%
|
9/11/2013
|
$100.26
|
PP = $105.50
|
|
MB = $110.78
|
Most Recent Note - 3/21/2014 7:55:39 PM
G- Slumped below its 50 DMA line today amid weakness in pharmaceutical stocks with a damaging loss on higher volume triggering a technical sell signal. Only a prompt rebound above the 50 DMA line would help its outlook.
>>> FEATURED STOCK ARTICLE : Finding Support Above 50-Day Moving Average Line - 3/17/2014
View all notes |
Set NEW NOTE alert |
CANSLIM.net Company Profile |
SEC
News |
Chart |
Request a new note
C
A N
S L
I M
|
|
|
|
THESE ARE NOT BUY RECOMMENDATIONS!
Comments contained in the body of this report are technical
opinions only. The material herein has been obtained
from sources believed to be reliable and accurate, however,
its accuracy and completeness cannot be guaranteed.
This site is not an investment advisor, hence it does
not endorse or recommend any securities or other investments.
Any recommendation contained in this report may not
be suitable for all investors and it is not to be deemed
an offer or solicitation on our part with respect to
the purchase or sale of any securities. All trademarks,
service marks and trade names appearing in this report
are the property of their respective owners, and are
likewise used for identification purposes only.
This report is a service available
only to active Paid Premium Members.
You may opt-out of receiving report notifications
at any time. Questions or comments may be submitted
by writing to Premium Membership Services 665 S.E. 10 Street, Suite 201 Deerfield Beach, FL 33441-5634 or by calling 1-800-965-8307
or 954-785-1121.
|
|
|

