You are not logged in.
This means you
CAN ONLY VIEW reports that were published prior to Monday, April 14, 2025.
You
MUST UPGRADE YOUR MEMBERSHIP if you want to see any current reports.
AFTER MARKET UPDATE - WEDNESDAY, MARCH 23RD, 2011
Previous After Market Report Next After Market Report >>>
|
|
|
|
DOW |
+67.39 |
12,086.02 |
+0.56% |
|
Volume |
878,490,490 |
+7% |
|
Volume |
1,724,086,080 |
+8% |
|
NASDAQ |
+14.43 |
2,698.30 |
+0.54% |
|
Advancers |
1,642 |
53% |
|
Advancers |
1,397 |
51% |
|
S&P 500 |
+3.77 |
1,297.54 |
+0.29% |
|
Decliners |
1,345 |
43% |
|
Decliners |
1,228 |
45% |
|
Russell 2000 |
+2.58 |
811.24 |
+0.32% |
|
52 Wk Highs |
91 |
|
|
52 Wk Highs |
72 |
|
|
S&P 600 |
+0.65 |
429.76 |
+0.15% |
|
52 Wk Lows |
18 |
|
|
52 Wk Lows |
42 |
|
|
 |
Major Averages Ended Session With Upward Momentum
Kenneth J. Gruneisen - Passed the CAN SLIM® Master's Exam
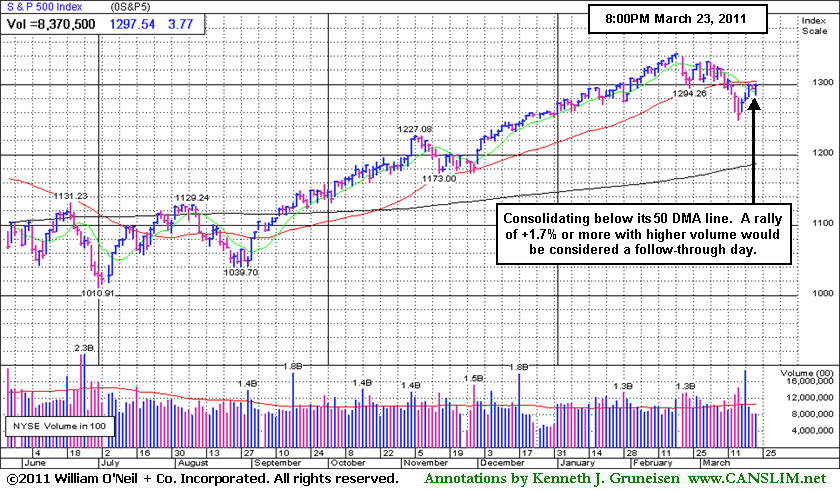
Momentum was positive, with the major averages hitting their highs for the day in the final hour on Wednesday. Volume on both exchanges picked up slightly from the prior session totals, but the percentage gains the major averages posted were not as big as the +1.7% gain needed to be considered a follow-through day. Advancing issues beat decliners by 7-6 on both the NYSE and the Nasdaq. New 52-week highs outnumbered new 52-week lows on the Nasdaq exchange and on the NYSE. There were 39 high-ranked companies from the CANSLIM.net Leaders List that made new 52-week highs and appeared on the CANSLIM.net BreakOuts Page, up from a total of 35 on the prior session. On the Featured Stocks Page only 3 of the 20 high-ranked market leaders currently listed ended the session lower.
Investors remained cautious in the face of global uncertainties. A report on February new home sales was much weaker than expected. Sales plunged 16.9% to a record low following a similar decrease in January. Oil prices rose to a two-week high as fighting in Libya continued. Gold increased to near a record in New York as unrest in the Middle East and concern about Europe's debt crisis spurred demand for an alternative investment. Silver rose to its highest settlement price since 1980. Copper advanced for a second day on a surge in stockpile orders. Metal and mining stocks took the lead as Wall Street bought into a global growth and reconstruction story.
Jabil Circuits Inc (JBL +10.88%) rallied after forecasting earnings will exceed analyst estimates. Adobe Systems Inc (ADBE -3.65%) lowered its second quarter revenue forecast due to the Japanese earthquake. Discover Financial Service Co (DFS +5.35%) rallied after the financial company posted profits above estimates and hiked its dividend. Meanwhile, Bank of America Corp (BAC -1.66%) said the Federal Reserve objected to its plan to increase dividends.
New buying efforts should be avoided until a new rally with a follow-through day (FTD) provides a fresh confirmation that buying demand from the institutional crowd is returning again. Even after a FTD, new buying efforts should be cautiously and carefully made when all of the investment system's key criteria are met.
PICTURED: The S&P 500 Index is still consolidating below its 50-day moving average (DMA) line after completing Day 5 of its new rally attempt. A solid gain of +1.7% or more with higher volume than the prior session would be considered a follow-through day confirming that the M criteria is again favorable for new buying efforts.
|
 Kenneth J. Gruneisen started out as a licensed stockbroker in August 1987, a couple of months prior to the historic stock market crash that took the Dow Jones Industrial Average down -22.6% in a single day. He has published daily fact-based fundamental and technical analysis on high-ranked stocks online for two decades. Through FACTBASEDINVESTING.COM, Kenneth provides educational articles, news, market commentary, and other information regarding proven investment systems that work in good times and bad.
Comments contained in the body of this report are technical opinions only and are not necessarily those of Gruneisen Growth Corp. The material herein has been obtained from sources believed to be reliable and accurate, however, its accuracy and completeness cannot be guaranteed. Our firm, employees, and customers may effect transactions, including transactions contrary to any recommendation herein, or have positions in the securities mentioned herein or options with respect thereto. Any recommendation contained in this report may not be suitable for all investors and it is not to be deemed an offer or solicitation on our part with respect to the purchase or sale of any securities. |
|
 |
Gold & Silver Index Posts 5th Consecutive Solid Gain
Kenneth J. Gruneisen - Passed the CAN SLIM® Master's Exam
The tech sector had a positive bias as the Semiconductor Index ($SOX +0.95%), Internet Index ($IIX +1.00%), and Networking Index ($NWX +1.11%) posted modest gains and the Biotechnology Index ($BTK +0.14%) edged higher. The Retail Index ($RLX +0.91%) was a positive influence on the major averages, and energy-related shares also inched higher as the Oil Services Index ($OSX +0.11%) and Integrated Oil Index ($XOI +0.35%) posted small gains. Financial shares were mixed as the Bank Index ($BKX -0.60%) lost ground but the Broker/Dealer Index ($XBD +0.18%) posted a small gain. The Healthcare Index ($HMO -0.25%) ended the session with a small loss.
Charts courtesy www.stockcharts.com
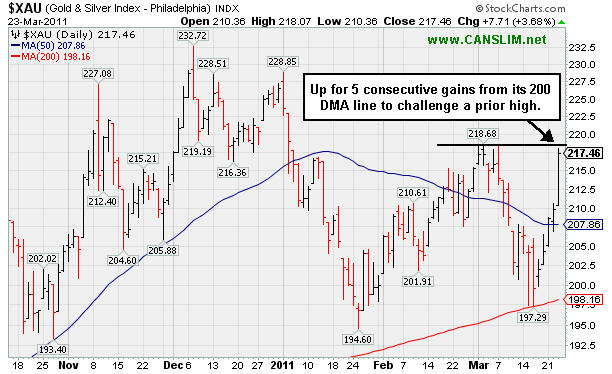
PICTURED: The Gold & Silver Index ($XAU +3.68%) was a standout gainer, rallying for a 5th consecutive gain from testing its 200-day moving average (DMA) line.
| Oil Services |
$OSX |
287.83 |
+0.33 |
+0.11% |
+17.42% |
| Healthcare |
$HMO |
2,042.20 |
-5.13 |
-0.25% |
+20.70% |
| Integrated Oil |
$XOI |
1,349.32 |
+4.71 |
+0.35% |
+11.22% |
| Semiconductor |
$SOX |
426.94 |
+4.03 |
+0.95% |
+3.67% |
| Networking |
$NWX |
315.67 |
+3.48 |
+1.11% |
+12.51% |
| Internet |
$IIX |
308.78 |
+3.06 |
+1.00% |
+0.34% |
| Broker/Dealer |
$XBD |
120.36 |
+0.22 |
+0.18% |
-0.95% |
| Retail |
$RLX |
503.36 |
+4.52 |
+0.91% |
-0.99% |
| Gold & Silver |
$XAU |
217.46 |
+7.71 |
+3.68% |
-4.03% |
| Bank |
$BKX |
51.40 |
-0.31 |
-0.60% |
-1.55% |
| Biotech |
$BTK |
1,278.12 |
+1.77 |
+0.14% |
-1.50% |
|
|
|
 |
Not Yet a Convincing New Breakout
Kenneth J. Gruneisen - Passed the CAN SLIM® Master's Exam
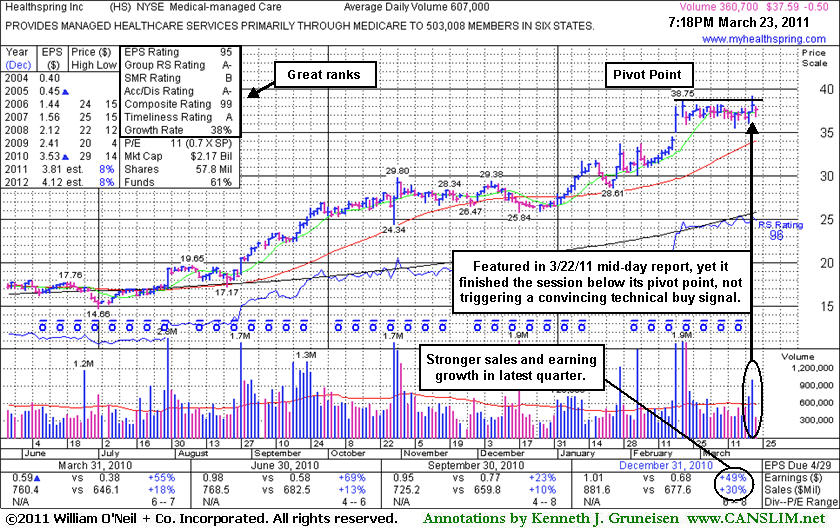
Healthspring Inc (HS -$1.16 or -2.97% to $36.96) pulled back today on lighter volume. It had failed to convincingly rally for a close above its pivot point after it touched a new 52-week high on the prior session and finished at a new high close with +69% above average volume behind its gain. After an orderly flat base near minimum length its color code was changed to yellow with pivot point cited based on its 52-week high plus 10 cents when featured in the 3/22/11 mid-day report (read here).
HS had traded up as much as +45% after it was first featured at $19.91 in the 8/27/10 mid-day report, and indeed it is much higher now than when it made its last appearance in this FSU section on December 10, 2010 with an annotated graph under the headline "Healthy Technically, But Deceleration Has Raised Concerns." Quarterly and annual earnings comparisons had shown strong +25% or greater increases (good C and A criteria) history. Concerns were raised because sales revenues growth had shown sequential deceleration from +25%, +18%, +13%, to +10% in the Dec '09 and Mar, Jun, Sep '10 quarters, respectively. It was later noted when dropped from the Featured Stocks list on 12/22/10 based on technical weakness and concerns raised by the weaker sales and earnings increases in the September quarter.
In light of its stronger sales and earnings increases in the latest quarter and other bullish characteristics, a subsequent breakout with conviction may justify new buying efforts. The number of top-rated funds owning its shares rose from 438 in March '10 to 479 in December '10, a reassuring sign concerning the I criteria. However, the M criteria argues against new buying efforts until a follow-through day confirms a new rally. Also, earnings estimates calling for EPS growth only in the +8% range in FY '11 and FY '12 were previously noted as a concern, as low Street estimates are not a very reassuring characteristic.
It was extended from an ideal base when recently noted in the 2/23/11 mid-day report - "It rebounded above its 50 DMA line and made an impressive rally after it was dropped from the Featured Stocks list on 12/22/10 based on fundamental and technical concerns. Reported earnings +49% on +30% sales revenues for the quarter ended December 31, 2010 versus the year ago period."
|
|
|
Color Codes Explained :
Y - Better candidates highlighted by our
staff of experts.
G - Previously featured
in past reports as yellow but may no longer be buyable under the
guidelines.
***Last / Change / Volume data in this table is the closing quote data***
Symbol/Exchange
Company Name
Industry Group |
PRICE |
CHANGE
(%Change) |
Day High |
Volume
(% DAV)
(% 50 day avg vol) |
52 Wk Hi
% From Hi |
Featured
Date |
Price
Featured |
Pivot Featured |
|
Max Buy |
BIDU
-
NASDAQ
Baidu Inc Ads
INTERNET - Internet Information Providers
|
$132.58
|
+5.49
4.32% |
$133.97
|
13,591,490
203.33% of 50 DAV
50 DAV is 6,684,600
|
$131.63
0.72%
|
3/17/2011
|
$121.97
|
PP = $131.73
|
|
MB = $138.32
|
 Most Recent Note - 3/23/2011 6:21:16 PM
Y - Gain today with 2 times average volume for a new all-time high, rallying above its pivot point triggering a technical buy signal after a riskier "late stage" set-up. Disciplined investors know that a follow-through day from at least one of the major averages (M criteria) is necessary in order to justify new (or add-on) buying efforts under the system's guidelines. Its 50 DMA line defines important chart support to watch.
>>> The latest Featured Stock Update with an annotated graph appeared on 3/9/2011. Click here.
View all notes |
Alert me of new notes |
CANSLIM.net Company Profile |
SEC |
Zacks Reports |
StockTalk |
News |
Chart |
Request a new note
C
A N
S L
I M


|
CMG
-
NYSE
Chipotle Mexican Grill
LEISURE - Restaurants
|
$246.98
|
+3.09
1.27% |
$247.46
|
713,508
66.71% of 50 DAV
50 DAV is 1,069,600
|
$275.00
-10.19%
|
2/11/2011
|
$271.15
|
PP = $262.87
|
|
MB = $276.01
|
Most Recent Note - 3/22/2011 6:49:31 PM
G - It has slumped -11.3% off its all-time high and it is testing support at its 50 DMA line. Its recent low ($234.48 on 3/02/11) defines another important nearby level for chart readers to watch closely. Subsequent violations and damaging losses would raise greater concerns and trigger technical sell signals.
>>> The latest Featured Stock Update with an annotated graph appeared on 3/14/2011. Click here.
View all notes |
Alert me of new notes |
CANSLIM.net Company Profile |
SEC |
Zacks Reports |
StockTalk |
News |
Chart |
Request a new note
C
A N
S L
I M
|
CTCT
-
NASDAQ
Constant Contact Inc
MEDIA - Advertising Services
|
$35.06
|
+1.23
3.64% |
$35.36
|
833,097
239.67% of 50 DAV
50 DAV is 347,600
|
$34.69
1.07%
|
3/22/2011
|
$33.59
|
PP = $32.49
|
|
MB = $34.11
|
Most Recent Note - 3/23/2011 6:17:44 PM
G - Posted a 3rd consecutive gain for a new high today following a technical breakout. Color code is changed to green after rallying beyond the "max buy" level. The bullish action warrants attention, however the M criteria remains an overriding concern until a follow-through day from at least one of the major averages confirms a new rally.
>>> The latest Featured Stock Update with an annotated graph appeared on 3/22/2011. Click here.
View all notes |
Alert me of new notes |
CANSLIM.net Company Profile |
SEC |
Zacks Reports |
StockTalk |
News |
Chart |
Request a new note
C
A N
S L
I M
|
CTSH
-
NASDAQ
Cognizant Tech Sol Cl A
COMPUTER SOFTWARE and SERVICES - Business Software and Services
|
$76.87
|
+0.00
0.00% |
$77.17
|
1,728,872
73.07% of 50 DAV
50 DAV is 2,366,200
|
$78.69
-2.31%
|
2/7/2011
|
$75.09
|
PP = $76.46
|
|
MB = $80.28
|
Most Recent Note - 3/22/2011 1:47:10 PM
Y - Rallying back above its 50 DMA line this week after briefly undercutting hat important short-term average and its previously noted low ($73.25 on 2/23/11) last week. It is perched only -2.0% off its 52-week high now. Color code is changed to yellow after showing resilience following the noted technical violations.
>>> The latest Featured Stock Update with an annotated graph appeared on 3/17/2011. Click here.
View all notes |
Alert me of new notes |
CANSLIM.net Company Profile |
SEC |
Zacks Reports |
StockTalk |
News |
Chart |
Request a new note
C
A N
S L
I M
|
DECK
-
NASDAQ
Deckers Outdoor Corp
CONSUMER NON-DURABLES - Textile - Apparel Footwear
|
$80.84
|
+0.31
0.38% |
$81.34
|
770,155
49.57% of 50 DAV
50 DAV is 1,553,600
|
$94.70
-14.64%
|
2/3/2011
|
$79.61
|
PP = $82.67
|
|
MB = $86.80
|
Most Recent Note - 3/21/2011 1:39:09 PM
G - Up today, yet still lingering below its 50 DMA line. A rebound above that important short-term average would technically help its outlook improve.
>>> The latest Featured Stock Update with an annotated graph appeared on 3/3/2011. Click here.
View all notes |
Alert me of new notes |
CANSLIM.net Company Profile |
SEC |
Zacks Reports |
StockTalk |
News |
Chart |
Request a new note
C
A N
S L
I M
|
Symbol/Exchange
Company Name
Industry Group |
PRICE |
CHANGE
(%Change) |
Day High |
Volume
(% DAV)
(% 50 day avg vol) |
52 Wk Hi
% From Hi |
Featured
Date |
Price
Featured |
Pivot Featured |
|
Max Buy |
EBIX
-
NASDAQ
Ebix Inc
COMPUTER SOFTWARE and SERVICES - Business Software and Services
|
$29.72
|
+0.64
2.20% |
$29.86
|
795,799
128.27% of 50 DAV
50 DAV is 620,400
|
$29.82
-0.34%
|
2/28/2011
|
$25.70
|
PP = $25.97
|
|
MB = $27.27
|
Most Recent Note - 3/23/2011 7:01:36 PM
G - Gain today with above average volume for a new all-time high. Extended from a sound base pattern. Prior highs in the $25-26 area define important chart support to watch along with its 50 DMA line.
>>> The latest Featured Stock Update with an annotated graph appeared on 2/28/2011. Click here.
View all notes |
Alert me of new notes |
CANSLIM.net Company Profile |
SEC |
Zacks Reports |
StockTalk |
News |
Chart |
Request a new note
C
A N
S L
I M
|
EZPW
-
NASDAQ
Ezcorp Inc Cl A
SPECIALTY RETAIL - Specialty Retail, Other
|
$30.19
|
+1.28
4.43% |
$30.61
|
621,913
169.92% of 50 DAV
50 DAV is 366,000
|
$29.94
0.84%
|
2/18/2011
|
$27.94
|
PP = $30.04
|
|
MB = $31.54
|
Most Recent Note - 3/23/2011 6:23:11 PM
Y - Gain today with +69% above average volume for a new 52-week high, rallying above its pivot point last cited triggering a technical buy signal. It announced a global strategic alliance with second hand goods retailer Cash Converters International. A follow-through day from at least one of the major averages (M criteria) is also necessary in order to justify new (or add-on) buying efforts under the system's guidelines.
>>> The latest Featured Stock Update with an annotated graph appeared on 3/10/2011. Click here.
View all notes |
Alert me of new notes |
CANSLIM.net Company Profile |
SEC |
Zacks Reports |
StockTalk |
News |
Chart |
Request a new note
C
A N
S L
I M
|
FOSL
-
NASDAQ
Fossil Inc
CONSUMER DURABLES - Recreational Goods, Other
|
$84.33
|
+1.29
1.55% |
$84.83
|
1,186,543
121.86% of 50 DAV
50 DAV is 973,700
|
$85.20
-1.02%
|
2/1/2011
|
$73.30
|
PP = $74.44
|
|
MB = $78.16
|
Most Recent Note - 3/21/2011 2:47:32 PM
G - Up today with lighter volume. It has not formed a sound base. It found support at its 50 DMA line while consolidating above prior resistance in the $74 area.
>>> The latest Featured Stock Update with an annotated graph appeared on 2/24/2011. Click here.
View all notes |
Alert me of new notes |
CANSLIM.net Company Profile |
SEC |
Zacks Reports |
StockTalk |
News |
Chart |
Request a new note
C
A N
S L
I M
|
HMSY
-
NASDAQ
H M S Holdings Corp
COMPUTER SOFTWARE and SERVICES - Healthcare Information Service
|
$80.95
|
-0.36
-0.44% |
$81.93
|
103,484
60.41% of 50 DAV
50 DAV is 171,300
|
$82.18
-1.50%
|
11/19/2010
|
$61.89
|
PP = $63.01
|
|
MB = $66.16
|
Most Recent Note - 3/21/2011 10:12:14 AM
G - Rallying within close striking distance of its 52-week high today after a brief consolidation, not a sound new base. Support to watch is its 50 DMA line.
>>> The latest Featured Stock Update with an annotated graph appeared on 2/16/2011. Click here.
View all notes |
Alert me of new notes |
CANSLIM.net Company Profile |
SEC |
Zacks Reports |
StockTalk |
News |
Chart |
Request a new note
C
A N
S L
I M
|
HS
-
NYSE
Healthspring Inc
HEALTH SERVICES - Health Care Plans
|
$37.59
|
-0.50
-1.31% |
$38.05
|
385,816
64.23% of 50 DAV
50 DAV is 600,700
|
$39.19
-4.08%
|
3/22/2011
|
$38.29
|
PP = $38.85
|
|
MB = $40.79
|
Most Recent Note - 3/23/2011 8:12:04 PM
Y - Pulled back today after failing to convincingly rally for a close above its pivot point. It touched a new 52-week high on the prior session and finished at a new high close with +69% above average volume behind its gain. After an orderly flat base near minimum length its color code was changed to yellow with pivot point cited based on its 52-week high plus 10 cents when featured in the 3/22/11 mid-day report. See the latest FSU analysis for more details and an annotated graph.
>>> The latest Featured Stock Update with an annotated graph appeared on 3/23/2011. Click here.
View all notes |
Alert me of new notes |
CANSLIM.net Company Profile |
SEC |
Zacks Reports |
StockTalk |
News |
Chart |
Request a new note
C
A N
S L
I M
|
Symbol/Exchange
Company Name
Industry Group |
PRICE |
CHANGE
(%Change) |
Day High |
Volume
(% DAV)
(% 50 day avg vol) |
52 Wk Hi
% From Hi |
Featured
Date |
Price
Featured |
Pivot Featured |
|
Max Buy |
LULU
-
NASDAQ
Lululemon Athletica
MANUFACTURING - Textile Manufacturing
|
$79.28
|
+2.07
2.68% |
$79.77
|
1,764,963
83.10% of 50 DAV
50 DAV is 2,123,800
|
$85.28
-7.04%
|
1/26/2011
|
$68.11
|
PP = $74.70
|
|
MB = $78.44
|
Most Recent Note - 3/23/2011 6:53:33 PM
G - Rising from support at its 50 DMA line, a classic chart support level. It has to look of a base-on-base type pattern and is perched -7.0% off its all-time high.
>>> The latest Featured Stock Update with an annotated graph appeared on 2/25/2011. Click here.
View all notes |
Alert me of new notes |
CANSLIM.net Company Profile |
SEC |
Zacks Reports |
StockTalk |
News |
Chart |
Request a new note
C
A N
S L
I M
|
MG
-
NYSE
Mistras Group Inc
DIVERSIFIED SERVICES - Bulding and Faci;ity Management Services
|
$17.00
|
-0.01
-0.06% |
$17.09
|
77,108
75.97% of 50 DAV
50 DAV is 101,500
|
$17.09
-0.53%
|
3/15/2011
|
$15.48
|
PP = $15.90
|
|
MB = $16.70
|
Most Recent Note - 3/22/2011 1:00:13 PM
G - Touched another new high today. After rallying beyond its "max buy" level its color code was changed to green. Prior highs near its pivot point define chart support to watch following last week's technical breakout. The M criteria argues against new buying efforts until a confirmed rally with follow-through day occurs.
>>> The latest Featured Stock Update with an annotated graph appeared on 3/15/2011. Click here.
View all notes |
Alert me of new notes |
CANSLIM.net Company Profile |
SEC |
Zacks Reports |
StockTalk |
News |
Chart |
Request a new note
C
A N
S L
I M
|
MWIV
-
NASDAQ
M W I Veterinary Supply
HEALTH SERVICES - Medical Instruments and; Supplies
|
$76.86
|
+0.12
0.16% |
$77.52
|
120,781
133.46% of 50 DAV
50 DAV is 90,500
|
$78.48
-2.06%
|
11/4/2010
|
$61.79
|
PP = $59.60
|
|
MB = $62.58
|
Most Recent Note - 3/23/2011 7:04:30 PM
G - Holding its ground in a tight range perched -2.1% off its all-time high. It is extended from any sound base pattern.
>>> The latest Featured Stock Update with an annotated graph appeared on 3/8/2011. Click here.
View all notes |
Alert me of new notes |
CANSLIM.net Company Profile |
SEC |
Zacks Reports |
StockTalk |
News |
Chart |
Request a new note
C
A N
S L
I M
|
OPEN
-
NASDAQ
Opentable Inc
INTERNET - Internet Software and Services
|
$95.19
|
+2.56
2.76% |
$95.56
|
1,066,217
96.83% of 50 DAV
50 DAV is 1,101,100
|
$95.97
-0.81%
|
3/17/2011
|
$90.71
|
PP = $96.07
|
|
MB = $100.87
|
Most Recent Note - 3/23/2011 6:55:52 PM
Y - Posted a 3rd consecutive gain today with average volume conviction.for a best-ever close. Color code was changed to yellow after it formed a sound new flat base pattern of sufficient length. Volume-driven gains above the new pivot point cited and a confirmed rally with follow-through day may eventually justify new (or add-on) buying efforts under the investment system guidelines. Important support to watch in the meanwhile is at its 50 DMA line and prior chart highs.
>>> The latest Featured Stock Update with an annotated graph appeared on 2/15/2011. Click here.
View all notes |
Alert me of new notes |
CANSLIM.net Company Profile |
SEC |
Zacks Reports |
StockTalk |
News |
Chart |
Request a new note
C
A N
S L
I M
|
PAY
-
NYSE
Verifone Systems Inc
COMPUTER HARDWARE - Transaction Automation Systems
|
$53.41
|
+1.03
1.97% |
$53.75
|
1,092,807
57.22% of 50 DAV
50 DAV is 1,909,800
|
$54.00
-1.09%
|
1/27/2011
|
$41.77
|
PP = $44.97
|
|
MB = $47.22
|
Most Recent Note - 3/23/2011 7:02:47 PM
G - Gain today on light volume for a new high close. Repeatedly noted - "No resistance remains due to overhead supply, but it is extended from a sound base pattern. Its 50 DMA line defines chart support to watch."
>>> The latest Featured Stock Update with an annotated graph appeared on 3/2/2011. Click here.
View all notes |
Alert me of new notes |
CANSLIM.net Company Profile |
SEC |
Zacks Reports |
StockTalk |
News |
Chart |
Request a new note
C
A N
S L
I M
|
Symbol/Exchange
Company Name
Industry Group |
PRICE |
CHANGE
(%Change) |
Day High |
Volume
(% DAV)
(% 50 day avg vol) |
52 Wk Hi
% From Hi |
Featured
Date |
Price
Featured |
Pivot Featured |
|
Max Buy |
PCLN
-
NASDAQ
Priceline.Com Inc
INTERNET - Internet Software and Services
|
$466.26
|
+10.56
2.32% |
$467.99
|
1,175,490
102.71% of 50 DAV
50 DAV is 1,144,500
|
$474.74
-1.79%
|
1/3/2011
|
$399.55
|
PP = $428.20
|
|
MB = $449.61
|
Most Recent Note - 3/23/2011 6:58:37 PM
G - Consolidating above support at its 50 DMA line, perched only -1.8% off its 52-week high, but it has not built a sound new base pattern.
>>> The latest Featured Stock Update with an annotated graph appeared on 3/21/2011. Click here.
View all notes |
Alert me of new notes |
CANSLIM.net Company Profile |
SEC |
Zacks Reports |
StockTalk |
News |
Chart |
Request a new note
C
A N
S L
I M
|
RAX
-
NYSE
Rackspace Hosting Inc
INTERNET - Internet Software and; Services
|
$36.89
|
+0.20
0.55% |
$37.08
|
1,112,290
60.40% of 50 DAV
50 DAV is 1,841,400
|
$40.62
-9.18%
|
3/16/2011
|
$36.28
|
PP = $40.72
|
|
MB = $42.76
|
Most Recent Note - 3/23/2011 7:07:53 PM
Y - Positive reversal today while testing support at its 50 DMA line. Its recent low ($34.22 on 3/15/11) defines another near-term support level to watch. The M criteria is an overriding concern arguing against new buying efforts until a rally with follow-through day occurs.
>>> The latest Featured Stock Update with an annotated graph appeared on 3/16/2011. Click here.
View all notes |
Alert me of new notes |
CANSLIM.net Company Profile |
SEC |
Zacks Reports |
StockTalk |
News |
Chart |
Request a new note
C
A N
S L
I M
|
TIBX
-
NASDAQ
Tibco Software Inc
COMPUTER SOFTWARE and SERVICES - Business Software and Services
|
$24.80
|
+0.19
0.77% |
$24.92
|
1,150,852
45.76% of 50 DAV
50 DAV is 2,515,200
|
$25.94
-4.39%
|
3/18/2011
|
$23.88
|
PP = $26.04
|
|
MB = $27.34
|
Most Recent Note - 3/23/2011 7:10:14 PM
Y - Posted a 4th consecutive small gain today, closing perched -4.4% off its 52-week high. Currently consolidating above support at its 50 DMA line and recent chart lows defining support above its old resistance area.
>>> The latest Featured Stock Update with an annotated graph appeared on 3/18/2011. Click here.
View all notes |
Alert me of new notes |
CANSLIM.net Company Profile |
SEC |
Zacks Reports |
StockTalk |
News |
Chart |
Request a new note
C
A N
S L
I M
|
UA
-
NYSE
Under Armour Inc Cl A
CONSUMER NON-DURABLES - Textile - Apparel Clothing
|
$64.92
|
+0.73
1.14% |
$65.30
|
465,942
58.42% of 50 DAV
50 DAV is 797,600
|
$70.69
-8.16%
|
1/27/2011
|
$58.31
|
PP = $56.99
|
|
MB = $59.84
|
Most Recent Note - 3/22/2011 6:41:58 PM
G - Down today with light volume, slumping toward its 50 DMA line and recent lows defining important chart support. It may be forming a base-on-base pattern, but more damaging losses would hurt its outlook.
>>> The latest Featured Stock Update with an annotated graph appeared on 3/7/2011. Click here.
View all notes |
Alert me of new notes |
CANSLIM.net Company Profile |
SEC |
Zacks Reports |
StockTalk |
News |
Chart |
Request a new note
C
A N
S L
I M
|
ULTA
-
NASDAQ
Ulta Salon Cosm & Frag
SPECIALTY RETAIL - Specialty Retail, Other
|
$47.27
|
+0.80
1.72% |
$47.53
|
549,820
87.47% of 50 DAV
50 DAV is 628,600
|
$47.93
-1.38%
|
1/6/2011
|
$36.12
|
PP = $37.34
|
|
MB = $39.21
|
Most Recent Note - 3/22/2011 6:43:51 PM
G - Hovering near its all-time high, quietly holding its ground after a spurt of volume-driven gains. Support to watch is at its 50 DMA line and recent chart lows near the $40 level.
>>> The latest Featured Stock Update with an annotated graph appeared on 2/17/2011. Click here.
View all notes |
Alert me of new notes |
CANSLIM.net Company Profile |
SEC |
Zacks Reports |
StockTalk |
News |
Chart |
Request a new note
C
A N
S L
I M
|
Symbol/Exchange
Company Name
Industry Group |
PRICE |
CHANGE
(%Change) |
Day High |
Volume
(% DAV)
(% 50 day avg vol) |
52 Wk Hi
% From Hi |
Featured
Date |
Price
Featured |
Pivot Featured |
|
Max Buy |
|
|
|
THESE ARE NOT BUY RECOMMENDATIONS!
Comments contained in the body of this report are technical
opinions only. The material herein has been obtained
from sources believed to be reliable and accurate, however,
its accuracy and completeness cannot be guaranteed.
This site is not an investment advisor, hence it does
not endorse or recommend any securities or other investments.
Any recommendation contained in this report may not
be suitable for all investors and it is not to be deemed
an offer or solicitation on our part with respect to
the purchase or sale of any securities. All trademarks,
service marks and trade names appearing in this report
are the property of their respective owners, and are
likewise used for identification purposes only.
This report is a service available
only to active Paid Premium Members.
You may opt-out of receiving report notifications
at any time. Questions or comments may be submitted
by writing to Premium Membership Services 665 S.E. 10 Street, Suite 201 Deerfield Beach, FL 33441-5634 or by calling 1-800-965-8307
or 954-785-1121.
|
|
|

