***Last / Change / Volume data in this table is the closing quote data***
Symbol/Exchange
Company Name
Industry Group |
PRICE |
CHANGE
(%Change) |
Day High |
Volume
(% DAV)
(% 50 day avg vol) |
52 Wk Hi
% From Hi |
Featured
Date |
Price
Featured |
Pivot Featured |
|
Max Buy |
ADS
-
NYSE
Alliance Data Sys Corp
COMPUTER SOFTWARE and SERVICES - Information and Delivery Service
|
$124.78
|
+0.17
0.14% |
$125.36
|
596,069
88.07% of 50 DAV
50 DAV is 676,800
|
$126.56
-1.41%
|
1/17/2012
|
$108.24
|
PP = $107.43
|
|
MB = $112.80
|
 Most Recent Note - 3/20/2012 4:30:28 PM
G - Perched near its all-time high, extended from any sound base pattern. Fundamental concerns were raised by earnings reported +9%, well below the +25% minimum guideline in the latest quarter ended December 31, 2011.
>>> The latest Featured Stock Update with an annotated graph appeared on 2/29/2012. Click here.
View all notes |
Alert me of new notes |
CANSLIM.net Company Profile |
SEC |
Zacks Reports |
StockTalk |
News |
Chart |
Request a new note
C
A N
S L
I M


|
ALLT
-
NASDAQ
Allot Communications Ltd
COMPUTER SOFTWARE andamp; SERVICES - Technical andamp; System Software
|
$21.00
|
+0.32
1.55% |
$21.07
|
348,812
100.35% of 50 DAV
50 DAV is 347,600
|
$21.25
-1.18%
|
3/13/2012
|
$19.72
|
PP = $18.91
|
|
MB = $19.86
|
Most Recent Note - 3/19/2012 5:33:23 PM
G - Holding its ground near its 52-week high, extended from its prior base. Disciplined investors do not chase extended stocks and always limit losses if ever any stock falls more than -7% from their purchase price. A considerable gain on more than 7 times average volume helped ALLT rise from an orderly 13-week base and trigger a technical buy signal as it was featured in the 3/13/12 mid-day report (read here) with pivot point cited based on its 2/23/12 high plus 10 cents. See the latest FSU analysis for more details and a new annotated weekly graph.
>>> The latest Featured Stock Update with an annotated graph appeared on 3/19/2012. Click here.
View all notes |
Alert me of new notes |
CANSLIM.net Company Profile |
SEC |
Zacks Reports |
StockTalk |
News |
Chart |
Request a new note
C
A N
S L
I M
|
ALXN
-
NASDAQ
Alexion Pharmaceuticals
DRUGS - Drug Manufacturers - Other
|
$90.02
|
+0.21
0.23% |
$90.53
|
1,509,747
120.88% of 50 DAV
50 DAV is 1,249,000
|
$89.90
0.13%
|
3/12/2012
|
$87.87
|
PP = $87.73
|
|
MB = $92.12
|
Most Recent Note - 3/19/2012 6:07:22 PM
Y - Hit a new all-time high with today's small gain on light volume. Stubbornly holding is ground since its 3/12/12 gain cleared an advanced "3-weeks tight" base, albeit a risker late-stage breakout, technically triggering a new (or add-on) buy signal. Support to watch on pullbacks is its 50 DMA line.
>>> The latest Featured Stock Update with an annotated graph appeared on 2/24/2012. Click here.
View all notes |
Alert me of new notes |
CANSLIM.net Company Profile |
SEC |
Zacks Reports |
StockTalk |
News |
Chart |
Request a new note
C
A N
S L
I M
|
BODY
-
NASDAQ
Body Central Corp
RETAIL - Catalog andamp; Mail Order Houses
|
$26.27
|
-0.46
-1.72% |
$26.59
|
216,488
102.46% of 50 DAV
50 DAV is 211,300
|
$29.49
-10.92%
|
1/27/2012
|
$26.69
|
PP = $25.46
|
|
MB = $26.73
|
Most Recent Note - 3/19/2012 6:14:14 PM
G - Sputtering near support at its 50 DMA line and prior highs in the $26 area. Subsequent damaging losses may trigger a more worrisome technical sell signal
>>> The latest Featured Stock Update with an annotated graph appeared on 3/13/2012. Click here.
View all notes |
Alert me of new notes |
CANSLIM.net Company Profile |
SEC |
Zacks Reports |
StockTalk |
News |
Chart |
Request a new note
C
A N
S L
I M
|
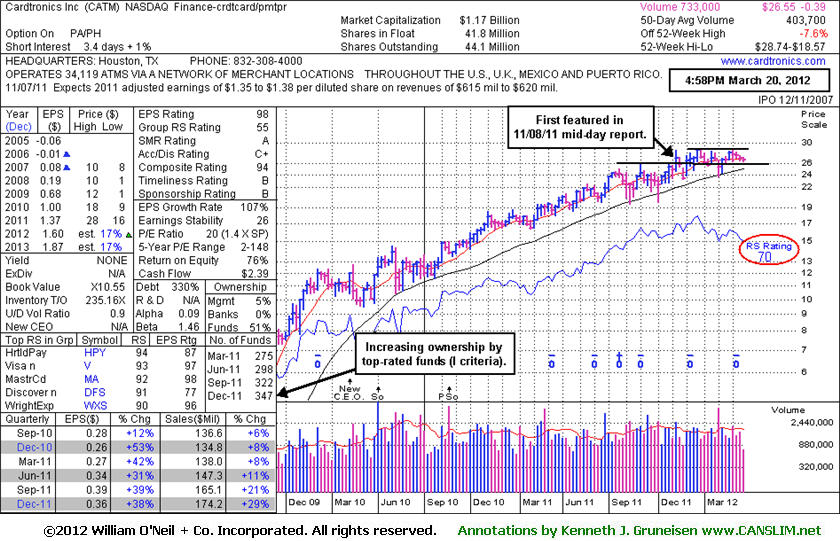
CATM
-
NASDAQ
Cardtronics Inc
DIVERSIFIED SERVICES - Business/Management Services
|
$26.55
|
-0.18
-0.67% |
$27.01
|
350,518
86.83% of 50 DAV
50 DAV is 403,700
|
$28.74
-7.62%
|
2/24/2012
|
$27.94
|
PP = $28.30
|
|
MB = $29.72
|
Most Recent Note - 3/20/2012 5:27:23 PM
G - Its Relative Strength rating has slumped to 70, below the 80+ guideline for buy candidates, and color code is changed to green while sputtering below its 50 DMA line and under its pivot point cited without triggering a proper technical buy signal. See the latest FSU analysis for more details and a new annotated weekly graph.
>>> The latest Featured Stock Update with an annotated graph appeared on 3/20/2012. Click here.
View all notes |
Alert me of new notes |
CANSLIM.net Company Profile |
SEC |
Zacks Reports |
StockTalk |
News |
Chart |
Request a new note
C
A N
S L
I M
|
Symbol/Exchange
Company Name
Industry Group |
PRICE |
CHANGE
(%Change) |
Day High |
Volume
(% DAV)
(% 50 day avg vol) |
52 Wk Hi
% From Hi |
Featured
Date |
Price
Featured |
Pivot Featured |
|
Max Buy |
CDNS
-
NASDAQ
Cadence Design Systems
COMPUTER SOFTWARE and SERVICES - Technical and System Software
|
$12.19
|
-0.23
-1.85% |
$12.36
|
3,042,931
89.78% of 50 DAV
50 DAV is 3,389,400
|
$12.60
-3.25%
|
2/3/2012
|
$11.66
|
PP = $11.15
|
|
MB = $11.71
|
Most Recent Note - 3/19/2012 6:22:01 PM
G - Small gain on lighter volume today for a new 52-week high. Color code was changed to green after getting extended from the most ideal range for accumulating shares under the fact based system following an earlier technical breakout.
>>> The latest Featured Stock Update with an annotated graph appeared on 2/3/2012. Click here.
View all notes |
Alert me of new notes |
CANSLIM.net Company Profile |
SEC |
Zacks Reports |
StockTalk |
News |
Chart |
Request a new note
C
A N
S L
I M
|
CELG
-
NASDAQ
Celgene Corp
DRUGS - Drug Manufacturers - Major
|
$75.53
|
+0.00
0.00% |
$76.01
|
1,796,712
56.38% of 50 DAV
50 DAV is 3,186,700
|
$77.43
-2.45%
|
2/2/2012
|
$74.16
|
PP = $75.21
|
|
MB = $78.97
|
Most Recent Note - 3/16/2012 11:41:06 AM
Y - Perched near its 52-week high today, rising from a test of support at its 50 DMA line last week. Currently perched within striking distance of its all-time high ($77.39 in Aug '08). Any subsequent volume-driven gains would be a reassuring sign of fresh institutional demand.
>>> The latest Featured Stock Update with an annotated graph appeared on 2/2/2012. Click here.
View all notes |
Alert me of new notes |
CANSLIM.net Company Profile |
SEC |
Zacks Reports |
StockTalk |
News |
Chart |
Request a new note
C
A N
S L
I M
|
COO
-
NYSE
Cooper Companies Inc
HEALTH SERVICES - Medical Instruments and Supplies
|
$78.40
|
-1.16
-1.46% |
$79.38
|
334,705
81.83% of 50 DAV
50 DAV is 409,000
|
$84.20
-6.88%
|
3/9/2012
|
$83.05
|
PP = $81.02
|
|
MB = $85.07
|
Most Recent Note - 3/19/2012 7:12:45 PM
G - Down today on higher volume, indicating distributional pressure, and its color code is changed to green. Its Relative Strength rating has quickly slumped to a mediocre 60, below the 80+ guideline for buy candidates, while sputtering back below the pivot point. Confirming gains with above average volume for additional new high closes would help its outlook.
>>> The latest Featured Stock Update with an annotated graph appeared on 3/9/2012. Click here.
View all notes |
Alert me of new notes |
CANSLIM.net Company Profile |
SEC |
Zacks Reports |
StockTalk |
News |
Chart |
Request a new note
C
A N
S L
I M
|
DISH
-
NASDAQ
Dish Network Corp Cl A
CONSUMER DURABLES - Electronic Equipment
|
$31.20
|
-0.23
-0.73% |
$31.27
|
1,519,291
58.91% of 50 DAV
50 DAV is 2,578,800
|
$32.57
-4.19%
|
3/7/2012
|
$30.83
|
PP = $30.10
|
|
MB = $31.61
|
Most Recent Note - 3/19/2012 7:15:07 PM
Y - Down today on lighter volume. It is still not too extended from its latest base. Prior highs in the $30 area define initial support to watch on pullbacks.
>>> The latest Featured Stock Update with an annotated graph appeared on 3/14/2012. Click here.
View all notes |
Alert me of new notes |
CANSLIM.net Company Profile |
SEC |
Zacks Reports |
StockTalk |
News |
Chart |
Request a new note
C
A N
S L
I M
|
ECHO
-
NASDAQ
Echo Global Logistics
DIVERSIFIED SERVICES - Business/Management Services
|
$17.31
|
-0.91
-4.99% |
$18.04
|
108,869
135.24% of 50 DAV
50 DAV is 80,500
|
$19.38
-10.68%
|
2/22/2012
|
$18.50
|
PP = $18.63
|
|
MB = $19.56
|
Most Recent Note - 3/20/2012 11:48:23 AM
G - Gapped down today and violated its 50 DMA line. Its color code is changed to green while the technical deterioration raises concerns. A prompt show of support near its recent low would help its outlook improve.
>>> The latest Featured Stock Update with an annotated graph appeared on 2/23/2012. Click here.
View all notes |
Alert me of new notes |
CANSLIM.net Company Profile |
SEC |
Zacks Reports |
StockTalk |
News |
Chart |
Request a new note
C
A N
S L
I M
|
Symbol/Exchange
Company Name
Industry Group |
PRICE |
CHANGE
(%Change) |
Day High |
Volume
(% DAV)
(% 50 day avg vol) |
52 Wk Hi
% From Hi |
Featured
Date |
Price
Featured |
Pivot Featured |
|
Max Buy |
FEIC
-
NASDAQ
F E I Co
ELECTRONICS - Diversified Electronics
|
$45.49
|
-0.46
-1.00% |
$45.89
|
123,995
39.31% of 50 DAV
50 DAV is 315,400
|
$48.31
-5.84%
|
12/7/2011
|
$41.41
|
PP = $42.35
|
|
MB = $44.47
|
Most Recent Note - 3/20/2012 4:32:57 PM
G - Quietly consolidating above its 50 DMA and only -5.8% off its 52-week high. No resistance remains due to overhead supply, however the latest quarterly report showed +21% earnings for the Dec '11 quarter, below the +25% minimum guideline for earnings growth.
>>> The latest Featured Stock Update with an annotated graph appeared on 3/12/2012. Click here.
View all notes |
Alert me of new notes |
CANSLIM.net Company Profile |
SEC |
Zacks Reports |
StockTalk |
News |
Chart |
Request a new note
C
A N
S L
I M
|
GNC
-
NYSE
G N C Holdings Inc
RETAIL - Drug Stores
|
$34.21
|
+0.32
0.94% |
$34.36
|
1,661,513
115.86% of 50 DAV
50 DAV is 1,434,100
|
$34.71
-1.44%
|
1/19/2012
|
$28.99
|
PP = $29.60
|
|
MB = $31.08
|
Most Recent Note - 3/19/2012 12:35:06 PM
G - Holding its ground since a considerable gap up gain on 3/13/12 after raising guidance based on stronger same store sales than previously expected. Recent low ($30.75 on 3/07/12) and its 50 DMA line define near-term chart support to watch.
>>> The latest Featured Stock Update with an annotated graph appeared on 3/5/2012. Click here.
View all notes |
Alert me of new notes |
CANSLIM.net Company Profile |
SEC |
Zacks Reports |
StockTalk |
News |
Chart |
Request a new note
C
A N
S L
I M
|
HLF
-
NYSE
Herbalife Ltd
DRUGS - Nutrition and Weight Management
|
$71.13
|
-0.49
-0.68% |
$71.72
|
907,958
68.19% of 50 DAV
50 DAV is 1,331,500
|
$72.00
-1.21%
|
2/22/2012
|
$65.90
|
PP = $63.50
|
|
MB = $66.68
|
Most Recent Note - 3/19/2012 6:24:29 PM
G - Small gap up gain today on average volume for a new all-time high, getting more extended from its prior base pattern. Prior highs in the $63 area define support to watch on pullbacks.
>>> The latest Featured Stock Update with an annotated graph appeared on 2/22/2012. Click here.
View all notes |
Alert me of new notes |
CANSLIM.net Company Profile |
SEC |
Zacks Reports |
StockTalk |
News |
Chart |
Request a new note
C
A N
S L
I M
|
ISRG
-
NASDAQ
Intuitive Surgical Inc
HEALTH SERVICES - Medical Appliances and Equipment
|
$531.63
|
+2.09
0.39% |
$531.92
|
148,323
41.33% of 50 DAV
50 DAV is 358,900
|
$533.00
-0.26%
|
12/20/2011
|
$442.43
|
PP = $449.16
|
|
MB = $471.62
|
Most Recent Note - 3/19/2012 6:31:22 PM
G - ISRG may produce more climactic gains, however it is extended from any sound base pattern, and the December '11 quarterly earnings increased by just below the borderline +25% minimum guideline for ideal buy candidates. Rather than compromise, disciplined investors may sooner consider another Featured Stock when a fresh technical buy signal occurs.
>>> The latest Featured Stock Update with an annotated graph appeared on 3/1/2012. Click here.
View all notes |
Alert me of new notes |
CANSLIM.net Company Profile |
SEC |
Zacks Reports |
StockTalk |
News |
Chart |
Request a new note
C
A N
S L
I M
|
LULU
-
NASDAQ
Lululemon Athletica
MANUFACTURING - Textile Manufacturing
|
$72.89
|
-0.16
-0.22% |
$73.25
|
2,085,357
91.76% of 50 DAV
50 DAV is 2,272,500
|
$74.50
-2.16%
|
1/10/2012
|
$60.97
|
PP = $59.46
|
|
MB = $62.43
|
Most Recent Note - 3/16/2012 5:52:06 PM
G - Touched a new all-time high today then reversed for a loss with slightly higher volume. It is extended from any sound base. Prior highs in the $61-64 area and its 50 DMA line define chart support to watch on pullbacks.
>>> The latest Featured Stock Update with an annotated graph appeared on 2/21/2012. Click here.
View all notes |
Alert me of new notes |
CANSLIM.net Company Profile |
SEC |
Zacks Reports |
StockTalk |
News |
Chart |
Request a new note
C
A N
S L
I M
|
Symbol/Exchange
Company Name
Industry Group |
PRICE |
CHANGE
(%Change) |
Day High |
Volume
(% DAV)
(% 50 day avg vol) |
52 Wk Hi
% From Hi |
Featured
Date |
Price
Featured |
Pivot Featured |
|
Max Buy |
MA
-
NYSE
Mastercard Inc Cl A
DIVERSIFIED SERVICES - Business/Management Services
|
$418.98
|
-6.11
-1.44% |
$423.92
|
595,612
56.45% of 50 DAV
50 DAV is 1,055,100
|
$428.57
-2.24%
|
3/12/2012
|
$419.86
|
PP = $428.67
|
|
MB = $450.10
|
Most Recent Note - 3/16/2012 5:53:46 PM
Y - Still quietly hovering near its all-time high. After forming an advanced "3-weeks tight" base a new pivot point was cited based on its 2/29/12 high plus 10 cents while its color code was changed to yellow. Volume-driven gains may trigger a new (or add-on) technical buy signal, meanwhile its prior highs in the $381-384 area define support to watch on pullbacks along with its 50 DMA line.
>>> The latest Featured Stock Update with an annotated graph appeared on 2/17/2012. Click here.
View all notes |
Alert me of new notes |
CANSLIM.net Company Profile |
SEC |
Zacks Reports |
StockTalk |
News |
Chart |
Request a new note
C
A N
S L
I M
|
MELI
-
NASDAQ
Mercadolibre Inc
INTERNET - Internet Software and; Services
|
$97.29
|
-0.35
-0.35% |
$97.60
|
262,020
51.27% of 50 DAV
50 DAV is 511,100
|
$104.50
-6.90%
|
2/6/2012
|
$97.09
|
PP = $95.58
|
|
MB = $100.36
|
Most Recent Note - 3/20/2012 4:28:59 PM
Y - Finished near the session high today with a small loss on light volume. Quietly consolidating, staying above its 50 DMA line and above the recent low ($91.38 on 3/06/12) defining important support areas to watch.
>>> The latest Featured Stock Update with an annotated graph appeared on 2/6/2012. Click here.
View all notes |
Alert me of new notes |
CANSLIM.net Company Profile |
SEC |
Zacks Reports |
StockTalk |
News |
Chart |
Request a new note
C
A N
S L
I M
|
MKTX
-
NASDAQ
Marketaxess Holdings Inc
FINANCIAL SERVICES - Investment Brokerage - Nationa
|
$36.41
|
-0.09
-0.25% |
$36.50
|
161,393
63.37% of 50 DAV
50 DAV is 254,700
|
$37.06
-1.75%
|
3/8/2012
|
$35.80
|
PP = $35.52
|
|
MB = $37.30
|
Most Recent Note - 3/16/2012 6:03:36 PM
Y - Up today with +77% above average volume while rallying above its pivot point for its second-best close ever. The solid volume-driven gain helped clinch a technical buy signal.
>>> The latest Featured Stock Update with an annotated graph appeared on 3/8/2012. Click here.
View all notes |
Alert me of new notes |
CANSLIM.net Company Profile |
SEC |
Zacks Reports |
StockTalk |
News |
Chart |
Request a new note
C
A N
S L
I M
|
NTES
-
NASDAQ
Netease.Com Inc Adr
INTERNET - Internet Information Providers
|
$56.30
|
-0.44
-0.78% |
$56.52
|
904,421
148.02% of 50 DAV
50 DAV is 611,000
|
$56.82
-0.92%
|
3/19/2012
|
$56.18
|
PP = $55.10
|
|
MB = $57.86
|
Most Recent Note - 3/20/2012 12:43:31 PM
Y - Pulling back today following a volume-driven gain into new high territory and strong close on the prior session that clinched a technical buy signal. It was featured in the prior mid-day report highlighted in yellow with a pivot point based on its 4/19/11 high plus 10 cents. Volume-driven gains on 2/27 & 2/28 cleared an earlier base pattern. Fundamentals are strong, however the Computer Software - Gaming group has a low rank (not good concerning L criteria) and waning ownership by top-rated funds is a concern with respect to the I criteria. The 4/19/11 mid-day report noted - "Since long ago dropped from the Featured Stocks list on 10/09/09 it went through a long consolidation including slumps below its 200 DMA line before rebounding with volume-driven gains in recent weeks to challenge and rise above its 2009 highs. This China-based Computer Software - Gaming firm has a strong annual earnings (A criteria) history."

>>> The latest Featured Stock Update with an annotated graph appeared on 10/9/2009. Click here.
View all notes |
Alert me of new notes |
CANSLIM.net Company Profile |
SEC |
Zacks Reports |
StockTalk |
News |
Chart |
Request a new note
C
A N
S L
I M
|
RAX
-
NYSE
Rackspace Hosting Inc
INTERNET - Internet Software and; Services
|
$56.68
|
-0.59
-1.03% |
$57.08
|
1,307,514
63.69% of 50 DAV
50 DAV is 2,052,800
|
$57.77
-1.89%
|
2/2/2012
|
$46.69
|
PP = $45.55
|
|
MB = $47.83
|
Most Recent Note - 3/19/2012 6:55:10 PM
G - Wedged up to a new 52-week high with today's gain lacking volume conviction. Its recent consolidation is a little short of the 5-week minimum length for it to be considered a new flat base pattern. Its 50 DMA line coincides with the prior low in the $49 area, defining an important near-term support level to watch.
>>> The latest Featured Stock Update with an annotated graph appeared on 2/16/2012. Click here.
View all notes |
Alert me of new notes |
CANSLIM.net Company Profile |
SEC |
Zacks Reports |
StockTalk |
News |
Chart |
Request a new note
C
A N
S L
I M
|
Symbol/Exchange
Company Name
Industry Group |
PRICE |
CHANGE
(%Change) |
Day High |
Volume
(% DAV)
(% 50 day avg vol) |
52 Wk Hi
% From Hi |
Featured
Date |
Price
Featured |
Pivot Featured |
|
Max Buy |
RRTS
-
NYSE
Roadrunner Trans Systems
TRANSPORTATION - Air Delivery and Freight Service
|
$17.97
|
-0.23
-1.26% |
$18.24
|
47,378
31.67% of 50 DAV
50 DAV is 149,600
|
$18.59
-3.34%
|
2/10/2012
|
$17.40
|
PP = $17.50
|
|
MB = $18.38
|
Most Recent Note - 3/19/2012 7:00:36 PM
Y - Managed a positive reversal today and closed near the session high. A new pivot point is not cited, yet it has built a base-on-base pattern while consolidating above prior highs in the $17 area and well above its 50 DMA line defining support to watch on pullbacks.
>>> The latest Featured Stock Update with an annotated graph appeared on 2/13/2012. Click here.
View all notes |
Alert me of new notes |
CANSLIM.net Company Profile |
SEC |
Zacks Reports |
StockTalk |
News |
Chart |
Request a new note
C
A N
S L
I M
|
SHFL
-
NASDAQ
Shuffle Master Inc
MANUFACTURING - Diversified Machinery
|
$17.68
|
-0.32
-1.78% |
$17.97
|
341,365
58.28% of 50 DAV
50 DAV is 585,700
|
$18.38
-3.81%
|
3/6/2012
|
$17.07
|
PP = $15.25
|
|
MB = $16.01
|
Most Recent Note - 3/19/2012 7:03:54 PM
G - Hit another new 52-week high today with its 10th gain in the span of 11 sessions. It may produce more climactic gains, but it is extended from any sound base pattern. Its 50 DMA line defines support to watch on pullbacks.
>>> The latest Featured Stock Update with an annotated graph appeared on 3/15/2012. Click here.
View all notes |
Alert me of new notes |
CANSLIM.net Company Profile |
SEC |
Zacks Reports |
StockTalk |
News |
Chart |
Request a new note
C
A N
S L
I M
|
SWI
-
NYSE
Solarwinds Inc
COMPUTER SOFTWARE and SERVICES - Application Software
|
$38.04
|
+0.12
0.32% |
$38.09
|
502,654
43.26% of 50 DAV
50 DAV is 1,162,000
|
$39.75
-4.30%
|
1/26/2012
|
$32.36
|
PP = $33.78
|
|
MB = $35.47
|
Most Recent Note - 3/16/2012 6:13:21 PM
G - Pulled back today with light volume, finishing -4.4% off its all-time high. Earnings below the +25% guideline for the Dec '11 quarter raised fundamental concerns. See the latest FSU analysis for more details and a new annotated graph.
>>> The latest Featured Stock Update with an annotated graph appeared on 3/16/2012. Click here.
View all notes |
Alert me of new notes |
CANSLIM.net Company Profile |
SEC |
Zacks Reports |
StockTalk |
News |
Chart |
Request a new note
C
A N
S L
I M
|
SXCI
-
NASDAQ
S X C Health Solutions
COMPUTER SOFTWARE and SERVICES - Healthcare Information Service
|
$71.59
|
-0.70
-0.97% |
$72.20
|
258,168
61.59% of 50 DAV
50 DAV is 419,200
|
$76.42
-6.32%
|
2/23/2012
|
$68.24
|
PP = $66.05
|
|
MB = $69.35
|
Most Recent Note - 3/19/2012 6:35:20 PM
G - Hovering in a tight range for the past 3 weeks, and it is extended from its prior base. Prior highs in the $66 area define support to watch on pullbacks.
>>> The latest Featured Stock Update with an annotated graph appeared on 3/6/2012. Click here.
View all notes |
Alert me of new notes |
CANSLIM.net Company Profile |
SEC |
Zacks Reports |
StockTalk |
News |
Chart |
Request a new note
C
A N
S L
I M
|
TDG
-
NYSE
Transdigm Group Inc
AEROSPACE/DEFENSE - Aerospace/Defense Products and; Services
|
$113.25
|
+0.10
0.09% |
$113.55
|
430,806
107.49% of 50 DAV
50 DAV is 400,800
|
$121.48
-6.77%
|
2/29/2012
|
$120.10
|
PP = $118.93
|
|
MB = $124.88
|
Most Recent Note - 3/19/2012 1:28:05 PM
Y - Sputtering since its 3/06/12 gap down, and it remains below its latest pivot point after encountering distributional pressure. Its recent low ($111.03 on 3/06/12) and its 50 DMA line define important chart support to watch above prior highs in the $102 area.
>>> The latest Featured Stock Update with an annotated graph appeared on 2/10/2012. Click here.
View all notes |
Alert me of new notes |
CANSLIM.net Company Profile |
SEC |
Zacks Reports |
StockTalk |
News |
Chart |
Request a new note
C
A N
S L
I M
|
Symbol/Exchange
Company Name
Industry Group |
PRICE |
CHANGE
(%Change) |
Day High |
Volume
(% DAV)
(% 50 day avg vol) |
52 Wk Hi
% From Hi |
Featured
Date |
Price
Featured |
Pivot Featured |
|
Max Buy |
TNGO
-
NASDAQ
Tangoe Inc
COMPUTER SOFTWARE and SERVICES - Technical and System Software
|
$17.47
|
-0.24
-1.36% |
$17.79
|
262,469
74.65% of 50 DAV
50 DAV is 351,600
|
$19.90
-12.21%
|
2/13/2012
|
$15.39
|
PP = $16.51
|
|
MB = $17.34
|
Most Recent Note - 3/19/2012 7:05:50 PM
G - Prior highs in the $16 area and its 50 DMA line coincide and define important chart support to watch while consolidating.
>>> The latest Featured Stock Update with an annotated graph appeared on 2/14/2012. Click here.
View all notes |
Alert me of new notes |
CANSLIM.net Company Profile |
SEC |
Zacks Reports |
StockTalk |
News |
Chart |
Request a new note
C
A N
S L
I M
|
TSCO
-
NASDAQ
Tractor Supply Co
SPECIALTY RETAIL - Specialty Retail, Other
|
$86.87
|
+0.55
0.64% |
$87.00
|
358,975
50.37% of 50 DAV
50 DAV is 712,700
|
$88.65
-2.01%
|
1/12/2012
|
$79.12
|
PP = $75.58
|
|
MB = $79.36
|
Most Recent Note - 3/16/2012 5:56:51 PM
G - Pulled back today for a loss on higher (near average) volume. Its 50 DMA line defines support to watch on pullbacks.
>>> The latest Featured Stock Update with an annotated graph appeared on 2/27/2012. Click here.
View all notes |
Alert me of new notes |
CANSLIM.net Company Profile |
SEC |
Zacks Reports |
StockTalk |
News |
Chart |
Request a new note
C
A N
S L
I M
|
UA
-
NYSE
Under Armour Inc Cl A
CONSUMER NON-DURABLES - Textile - Apparel Clothing
|
$96.58
|
+0.80
0.84% |
$96.92
|
517,541
40.02% of 50 DAV
50 DAV is 1,293,200
|
$99.10
-2.54%
|
2/15/2012
|
$85.77
|
PP = $84.86
|
|
MB = $89.10
|
Most Recent Note - 3/16/2012 5:58:08 PM
G - Pulled back today for a 3rd consecutive loss today. Recent gains above its pivot point did not have volume sufficient to trigger a proper technical buy signal. Pyramiding into a position can help investors avoid chasing stocks too far above their pivot point.
>>> The latest Featured Stock Update with an annotated graph appeared on 2/15/2012. Click here.
View all notes |
Alert me of new notes |
CANSLIM.net Company Profile |
SEC |
Zacks Reports |
StockTalk |
News |
Chart |
Request a new note
C
A N
S L
I M
|
UBNT
-
NASDAQ
Ubiquiti Networks Inc
TELECOMMUNICATIONS - Diversified Communication Serv
|
$27.04
|
-0.06
-0.22% |
$28.14
|
158,353
52.04% of 50 DAV
50 DAV is 304,300
|
$28.97
-6.66%
|
1/27/2012
|
$22.25
|
PP = $23.14
|
|
MB = $24.30
|
Most Recent Note - 3/16/2012 6:00:32 PM
Y - Quietly consolidating within close striking distance of its 52-week high. They teach in the Certification that a stock may be bought from its 10-week moving average (WMA) up to +5% above the latest high (in this case $28.97 on 2/28/12 plus another 5%) following an earlier technical breakout.
>>> The latest Featured Stock Update with an annotated graph appeared on 2/1/2012. Click here.
View all notes |
Alert me of new notes |
CANSLIM.net Company Profile |
SEC |
Zacks Reports |
StockTalk |
News |
Chart |
Request a new note
C
A N
S L
I M
|
ULTA
-
NASDAQ
Ulta Salon Cosm & Frag
SPECIALTY RETAIL - Specialty Retail, Other
|
$90.61
|
+1.01
1.13% |
$91.01
|
684,483
94.45% of 50 DAV
50 DAV is 724,700
|
$92.00
-1.51%
|
1/11/2012
|
$71.97
|
PP = $75.80
|
|
MB = $79.59
|
Most Recent Note - 3/19/2012 6:43:49 PM
G - ULTA may produce more climactic gains, however, while hovering near its all-time high it has been repeatedly noted - "Extended from any sound base pattern, meanwhile its prior highs near $75 and its 50 DMA line define important chart support."
>>> The latest Featured Stock Update with an annotated graph appeared on 2/28/2012. Click here.
View all notes |
Alert me of new notes |
CANSLIM.net Company Profile |
SEC |
Zacks Reports |
StockTalk |
News |
Chart |
Request a new note
C
A N
S L
I M
|
Symbol/Exchange
Company Name
Industry Group |
PRICE |
CHANGE
(%Change) |
Day High |
Volume
(% DAV)
(% 50 day avg vol) |
52 Wk Hi
% From Hi |
Featured
Date |
Price
Featured |
Pivot Featured |
|
Max Buy |
V
-
NYSE
Visa Inc Cl A
DIVERSIFIED SERVICES - Business/Management Services
|
$116.52
|
-2.32
-1.95% |
$118.60
|
2,646,383
68.21% of 50 DAV
50 DAV is 3,879,500
|
$119.72
-2.67%
|
3/12/2012
|
$116.53
|
PP = $119.46
|
|
MB = $125.43
|
Most Recent Note - 3/19/2012 6:46:14 PM
Y - Touched a new all-time high with a gain on average volume today. Volume-driven gains may trigger a new (or add-on) technical buy signal, meanwhile its 50 DMA line defines support to watch above prior highs in the $103-104 area.
>>> The latest Featured Stock Update with an annotated graph appeared on 3/7/2012. Click here.
View all notes |
Alert me of new notes |
CANSLIM.net Company Profile |
SEC |
Zacks Reports |
StockTalk |
News |
Chart |
Request a new note
C
A N
S L
I M
|