You are not logged in.
This means you
CAN ONLY VIEW reports that were published prior to Monday, April 14, 2025.
You
MUST UPGRADE YOUR MEMBERSHIP if you want to see any current reports.
AFTER MARKET UPDATE - FRIDAY, MARCH 19TH, 2010
Previous After Market Report Next After Market Report >>>
|
|
|
|
DOW |
-37.19 |
10,741.98 |
-0.35% |
|
Volume |
1,978,595,410 |
+114% |
|
Volume |
3,147,559,330 |
+50% |
|
NASDAQ |
-16.87 |
2,374.41 |
-0.71% |
|
Advancers |
896 |
29% |
|
Advancers |
1,050 |
37% |
|
S&P 500 |
-5.93 |
1,159.90 |
-0.51% |
|
Decliners |
2,135 |
68% |
|
Decliners |
1,670 |
59% |
|
Russell 2000 |
-7.72 |
673.89 |
-1.13% |
|
52 Wk Highs |
257 |
|
|
52 Wk Highs |
160 |
|
|
S&P 600 |
-3.32 |
359.43 |
-0.92% |
|
52 Wk Lows |
9 |
|
|
52 Wk Lows |
19 |
|
|
 |
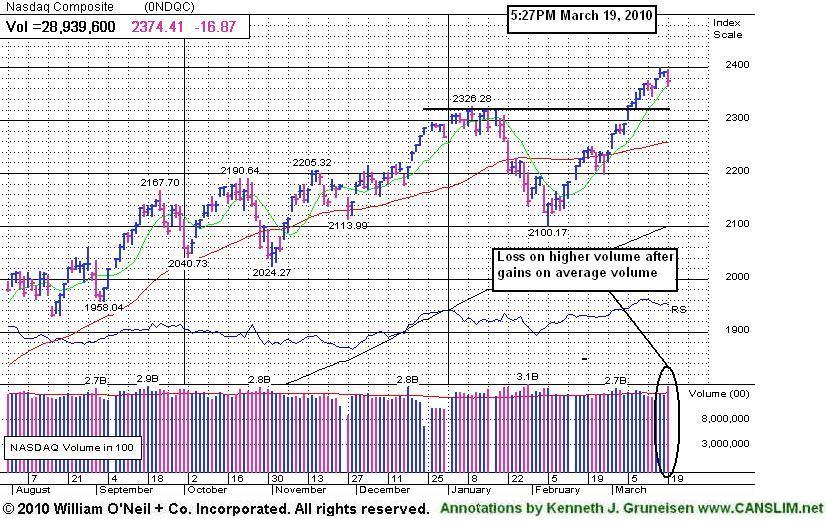
Indices Fall on Higher Volume After Recent Surge To Recovery Highs
Adam Sarhan, Contributing Writer,
The major averages ended unanimously lower on Friday's session, but they were up for the week after hitting fresh multi-month highs. As expected, volume totals were reported higher on the Nasdaq exchange and on the NYSE compared to the prior session due to Friday's quadruple witching options expirations. Decliners led advancers by more than a 2-to-1 ratio on the NYSE and by a 3-to-2 ratio on the Nasdaq exchange. There were 37 high-ranked companies from the CANSLIM.net Leaders List that made a new 52-week high and appeared on the CANSLIM.net BreakOuts Page, lower than the 46 issues that appeared on the prior session. New 52-week highs again overwhelmingly trumped new lows on both exchanges.
On Monday, stocks ended mixed as rumor spread that the Chinese or Indian Central Bank would raise rates. On Tuesday, the Fed decided to hold rates steady near record lows and reiterated their stance to keep rates low as the economy continues to recover. Elsewhere, February housing starts were reported slightly better than expected, even though starts declined -5.9% from January. Prices of goods imported into the U.S. in February fell more than forecast, signaling there is mild inflationary pressure coming from abroad. Health care stocks overcame modest pressure after House Speaker Nancy Pelosi said there will be enough votes in the House to pass health care reform. Meanwhile, European markets advanced as European leaders worked out a plan for emergency aid to Greece if needed.
On Wednesday, stocks rose, sending the Dow Jones Industrial Average and the benchmark S&P 500 Index to fresh 18 month highs and boosting the Nasdaq Composite Index to a fresh 19 month high after the latest round of healthy economic data was released. Producer prices slid by a larger than expected -0.6% which eased inflation woes and eased pressure on the Federal Reserve to raise rates in the foreseeable future. Overseas, the Bank of Japan doubled its lending program aimed at increasing its credit growth to $222 billion. In Europe, investor confidence rose after the latest round of stronger than expected earnings were released.
Stocks ended mixed on Thursday after the latest round of mixed economic data was released: consumer prices were mild, leading economic indicators rose +0.1% last month while jobless claims slid. On Friday, Monday's fears were confirmed when the Indian Central Bank raised rates to curtail their robust economy and inflation. The fact that we have not seen any serious distribution days since the FTD bodes well for this nascent rally. It is also a welcome sign to see the market continue to improve as investors digest the latest round of stronger than expected economic and earnings data. Remember that now that a new rally has been confirmed, the window is open to start buying high quality breakouts. Trade accordingly.
Professional Money Management Services - A Winning System - Inquire today!
Our skilled team of portfolio managers knows how to follow the rules of this fact-based investment system. We do not follow opinion or the "conviction list" of some large Wall Street institution which would have us fully invested even during horrific bear markets. Instead, we remain fluid and only buy the best stocks when they are triggering proper technical buy signals. If you are not completely satisfied with the way your portfolio is being managed, Click here to get connected with one of our portfolio managers. *Accounts over $250,000 please. ** Serious inquires only, please
PICTURED: The Nasdaq Composite Index's loss Friday on higher volume followed recent gains for new recovery highs on near average volume. Friday's volume totals were inflated due to options expirations.
|
|
|
 |
Commodity-Linked Groups, Financial, and Tech Shares Pull Back
Kenneth J. Gruneisen - Passed the CAN SLIM® Master's Exam
Commodity-linked areas traded with a negative bias on Friday as the Oil Services Index ($OSX -2.74%), Integrated Oil Index ($XOI -0.78%), and Gold & Silver Index ($XAU -1.55%) lost ground. The tech sector was mostly weaker as the Semiconductor Index ($SOX -1.65%), Networking Index ($NWX -1.37%), and Internet Index ($IIX -1.09%) sufffered losses. Financial shares also had a negativ influence on the majkor averages as the Broker/Dealer Index ($XBD -1.20%) and Bank Index ($BKX -0.97%) fell. The Retail Index ($RLX -0.27%) did a better job of holding its ground, meanwhile the Biotechnology Index ($BTK -0.00%) ended flat.
Charts courtesy www.stockcharts.com
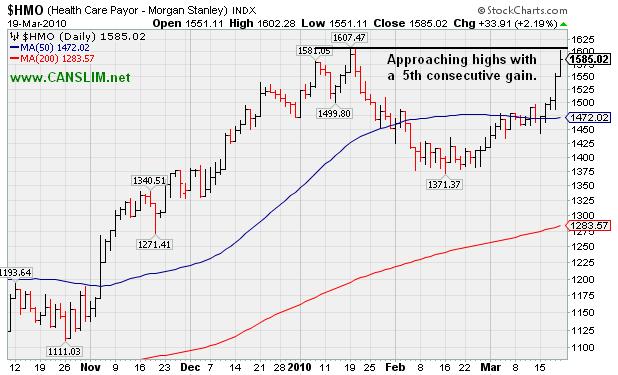
PICTURED: The Healthcare Index ($HMO +2.19%) was the standout gainer for a second consecutive session while approaching its highs with a 5th consecutive gain.
| Oil Services |
$OSX |
203.81 |
-5.74 |
-2.74% |
+4.56% |
| Healthcare |
$HMO |
1,585.01 |
+33.91 |
+2.19% |
+7.61% |
| Integrated Oil |
$XOI |
1,075.26 |
-8.43 |
-0.78% |
+0.66% |
| Semiconductor |
$SOX |
355.67 |
-5.97 |
-1.65% |
-1.18% |
| Networking |
$NWX |
254.67 |
-3.53 |
-1.37% |
+10.22% |
| Internet |
$IIX |
245.64 |
-2.81 |
-1.13% |
+5.08% |
| Broker/Dealer |
$XBD |
118.11 |
-1.47 |
-1.23% |
+2.69% |
| Retail |
$RLX |
445.48 |
-1.20 |
-0.27% |
+8.36% |
| Gold & Silver |
$XAU |
165.99 |
-2.61 |
-1.55% |
-1.34% |
| Bank |
$BKX |
51.13 |
-0.50 |
-0.97% |
+19.71% |
| Biotech |
$BTK |
1,221.29 |
-0.02 |
-0.00% |
+29.63% |
|
|
|
 |
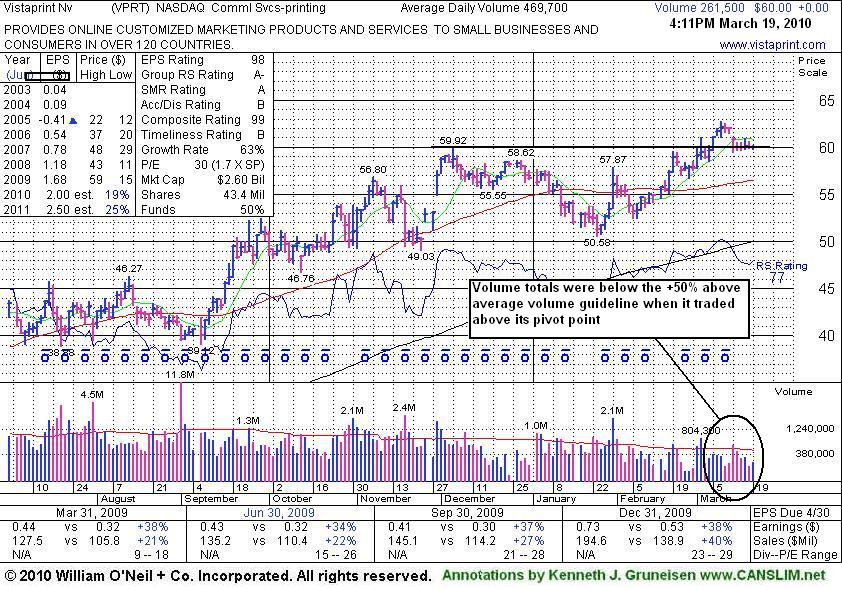
Printed Recent Highs Without Volume Conviction
Kenneth J. Gruneisen - Passed the CAN SLIM® Master's Exam
Vistaprint Nv. (VPRT $60.00) traded with mostly light volume this week while consolidating in a tight trading range and closing only -4.4% from its 3/09/10 all-time high. It did not trigger a technical buy signal, and its Relative Strength rank has slumped to 77 from 82 since it was featured in the March 2010 CANSLIM.net News monthly newsletter (read here). The market produced a follow-through-day from at least one of the major averages to satisfy the M criteria, giving disciplined investors a green light to accumulate shares of companies that have met the guidelines. However, as previously noted, "Its gain on 3/02/10 was below the volume guidelines for buyable breakouts under the investment system. The stock needs to produce gains above its $59.70 pivot point (previously cited) with +50% above average volume or greater to trigger a solid technical buy signal.
The Netherlands headquartered high-ranked Commercial Services - Printing firm is known for its aggressive online advertising for a small order of free business cards. The C and A criteria are satisfied as the company has demonstrated solid quarterly sales revenues and earnings increases (above the +25% minimum guideline) and it has a good annual earnings history. Volume totals have been generally cooling off in recent weeks. The quiet action suggests that very few shareholders are exiting while it hovers near all-time highs, which is reassuring.
|
|
|
Color Codes Explained :
Y - Better candidates highlighted by our
staff of experts.
G - Previously featured
in past reports as yellow but may no longer be buyable under the
guidelines.
***Last / Change / Volume quote data in this table corresponds with the timestamp on the note***
Symbol/Exchange
Company Name
Industry Group |
Last |
Chg. |
Vol
% DAV |
Date Featured |
Price Featured |
Latest Pivot Point
Featured |
Status |
| Latest Max Buy Price |
ARUN
- NASDAQ
Aruba Networks Inc
COMPUTER HARDWARE - Networking & Communication Dev
|
$12.55
|
-0.24
|
2,080,093
138% DAV
1,507,700
|
2/19/2010
(Date
Featured) |
$12.71
(Price
Featured) |
PP = $11.94 |
G |
| MB = $12.54 |
Most Recent Note - 3/19/2010 4:33:25 PM
G - Third consecutive loss today on higher volume was indicative of distributional pressure while consolidating after recent gains on high volume. It closed a penny above its "max buy" level, pulling back toward support defined by prior chart highs and its 50 DMA line.
>>> The latest Featured Stock Update with an annotated graph appeared on 3/11/2010. click here.
|
|
C
A
S
I |
News |
Chart |
SEC
View all notes Alert
me of new notes
Company
Profile
|
BIDU
- NASDAQ
Baidu Inc Ads
INTERNET - Internet Information Providers
|
$569.65
|
+4.99
|
1,890,240
91% DAV
2,085,900
|
1/13/2010
(Date
Featured) |
$431.25
(Price
Featured) |
PP = $426.75 |
G |
| MB = $448.09 |
Most Recent Note - 3/19/2010 4:34:41 PM
G - Closed near the session low while posting a small gain on near average volume. Still quietly consolidating following its 3/15/10 considerable gap up gain with heavy volume, very extended from any sound base.
>>> The latest Featured Stock Update with an annotated graph appeared on 3/4/2010. click here.
|
|
C
A
S
I |
News |
Chart |
SEC
View all notes Alert
me of new notes
Company
Profile
|
BRLI
- NASDAQ
Bio Reference Labs Inc
HEALTH SERVICES - Medical Laboratories & Researc
|
$43.85
|
-0.31
|
88,118
92% DAV
96,300
|
2/12/2010
(Date
Featured) |
$39.02
(Price
Featured) |
PP = $40.97 |
G |
| MB = $43.02 |
Most Recent Note - 3/19/2010 4:36:00 PM
G - Quietly consolidating very near its 52-week high since its negative reversal on 3/12/10. It is slightly extended from its prior base, and prior chart highs and its 50 DMA line now coincide in the $40 area defining important support to watch.
>>> The latest Featured Stock Update with an annotated graph appeared on 3/1/2010. click here.
|
|
C
A
S
I |
News |
Chart |
SEC
View all notes Alert
me of new notes
Company
Profile
|
CISG
- NASDAQ
Cninsure Inc Ads
INSURANCE - Insurance Brokers
|
$25.28
|
-0.22
|
141,146
63% DAV
223,300
|
3/3/2010
(Date
Featured) |
$24.38
(Price
Featured) |
PP = $23.10 |
G |
| MB = $24.26 |
Most Recent Note - 3/19/2010 4:36:34 PM
G - Stubbornly holding its ground -3.5% off its 52-week high. No overhead supply remains to act as resistance. It rose from a 20-week double bottom base with 8 times average volume as it was featured in the 3/03/10 mid-day report (read here).
>>> The latest Featured Stock Update with an annotated graph appeared on 3/3/2010. click here.
|
|
C
A
S
I |
News |
Chart |
SEC
View all notes Alert
me of new notes
Company
Profile
|
CRM
- NYSE
Salesforce.com Inc
INTERNET - Internet Software & Services
|
$76.02
|
-0.89
|
1,543,710
77% DAV
2,007,400
|
3/5/2010
(Date
Featured) |
$72.28
(Price
Featured) |
PP = $75.53 |
Y |
| MB = $79.31 |
Most Recent Note - 3/19/2010 4:38:18 PM
Y - Small loss today with below average volume, remaining above its pivot point. Wedging higher, rising from a 9-week base without the required volume to trigger a proper technical buy signal. Its 50 DMA line and recent chart low ($64.77 on 2/25/10) define important support.
>>> The latest Featured Stock Update with an annotated graph appeared on 3/5/2010. click here.
|
|
C
A
S
I |
News |
Chart |
SEC
View all notes Alert
me of new notes
Company
Profile
|
CTRP
- NASDAQ
Ctrip.com Intl Ltd Adr
LEISURE - Resorts & Casinos
|
$36.00
|
-0.92
|
1,266,476
59% DAV
2,162,800
|
3/1/2010
(Date
Featured) |
$38.23
(Price
Featured) |
PP = $38.50 |
G |
| MB = $40.43 |
Most Recent Note - 3/19/2010 4:40:34 PM
G - Loss today with light volume, slumping below its pivot point toward its 50 DMA line. Color code is changed to green based on recent weakness. A gain above its pivot point or its most recent chart highs is still needed to confirm a fresh technical buy signal with +50% above average volume or more. Completed an offering of additional shares on 3/03/10, shortly after featured in the March 2010 issue of CANSLIM.net News (read here).
>>> The latest Featured Stock Update with an annotated graph appeared on 3/18/2010. click here.
|
|
C
A
S
I |
News |
Chart |
SEC
View all notes Alert
me of new notes
Company
Profile
|
EZPW
- NASDAQ
Ezcorp Inc Cl A
SPECIALTY RETAIL - Specialty Retail, Other
|
$20.43
|
-0.30
|
523,759
98% DAV
535,000
|
2/19/2010
(Date
Featured) |
$19.03
(Price
Featured) |
PP = $18.80 |
G |
| MB = $19.74 |
Most Recent Note - 3/19/2010 4:42:42 PM
G - Loss today with average volume, falling toward its 50 DMA line - important support to watch. Its positive reversal on 3/16/10 was a reassuring sign of support after its 3/15/10 a loss with volume nearly 4 times average volume indicated distributional pressure. .
>>> The latest Featured Stock Update with an annotated graph appeared on 3/8/2010. click here.
|
|
C
A
S
I |
News |
Chart |
SEC
View all notes Alert
me of new notes
Company
Profile
|
GMCR
- NASDAQ
Green Mtn Coffee Roastrs
FOOD & BEVERAGE - Processed & Packaged Goods
|
$93.90
|
-2.90
|
1,140,065
88% DAV
1,295,100
|
2/26/2010
(Date
Featured) |
$84.39
(Price
Featured) |
PP = $88.75 |
G |
| MB = $93.19 |
Most Recent Note - 3/19/2010 4:44:34 PM
G - Loss today on below average volume, consolidating after a recent streak of 6 consecutive gains. Its high volume gain on 3/08/10 triggered a new technical buy signal. It is slightly extended from its latest sound base, and initial support to watch is prior chart highs in the $86-88 area.
>>> The latest Featured Stock Update with an annotated graph appeared on 3/12/2010. click here.
|
|
C
A
S
I |
News |
Chart |
SEC
View all notes Alert
me of new notes
Company
Profile
|
ISRG
- NASDAQ
Intuitive Surgical Inc
HEALTH SERVICES - Medical Appliances & Equipment
|
$349.18
|
-4.41
|
869,126
170% DAV
512,400
|
1/22/2010
(Date
Featured) |
$340.40
(Price
Featured) |
PP = $314.00 |
G |
| MB = $329.70 |
Most Recent Note - 3/19/2010 4:46:56 PM
G - Negative reversal today for a loss on above average volume raises some concerns. Meanwhile, it has not triggered a sound technical buy signal in recent weeks. Prior chart highs near $346 are an initial support level to watch.
>>> The latest Featured Stock Update with an annotated graph appeared on 3/16/2010. click here.
|
|
C
A
S
I |
News |
Chart |
SEC
View all notes Alert
me of new notes
Company
Profile
|
PCLN
- NASDAQ
Priceline.com Inc
INTERNET - Internet Software & Services
|
$399.55
|
-4.72
|
584,812
N/A
|
11/1/2002
(Date
Featured) |
$399.55
(Price
Featured) |
PP = $428.20 |
Y |
| MB = $449.61 |
Most Recent Note - 1/2/2011
Y - Returns to Featured Stocks list with its appearance in the January 2011 CANSLIM.net News including detailed analysis and annotated daily and weekly graphs.
>>> The latest Featured Stock Update with an annotated graph appeared on 3/10/2010. click here.
|
|
C
A
S
I |
News |
Chart |
SEC
View all notes Alert
me of new notes
Company
Profile
|
PEGA
- NASDAQ
Pegasystems Inc
COMPUTER SOFTWARE & SERVICES - Business Software & Services
|
$37.77
|
-0.72
|
153,551
70% DAV
219,800
|
2/26/2010
(Date
Featured) |
$36.00
(Price
Featured) |
PP = $38.55 |
Y |
| MB = $40.48 |
Most Recent Note - 3/19/2010 4:49:17 PM
Y - Loss today on light volume was its 4th consecutive loss, closing further below its latest pivot point. Consolidating in a tight range near all-time highs since a considerable gap up gain on 3/15/10 triggered a technical buy signal. Recently found support at its 50 DMA line, while prior chart lows in the $32 area are the next support level.
>>> The latest Featured Stock Update with an annotated graph appeared on 3/15/2010. click here.
|
|
C
A
S
I |
News |
Chart |
SEC
View all notes Alert
me of new notes
Company
Profile
|
ROVI
- NASDAQ
Rovi Corp
COMPUTER SOFTWARE & SERVICES - Security Software & Services
|
$37.43
|
-0.05
|
1,431,442
105% DAV
1,363,000
|
2/25/2010
(Date
Featured) |
$33.54
(Price
Featured) |
PP = $34.87 |
G |
| MB = $36.61 |
Most Recent Note - 3/19/2010 4:50:41 PM
G - This week it consolidated in a very tight trading range near all-time highs. It remains extended from its latest base, and prior chart highs in the $34 area define an important support level to watch on pullbacks.
>>> The latest Featured Stock Update with an annotated graph appeared on 3/17/2010. click here.
|
|
C
A
S
I |
News |
Chart |
SEC
View all notes Alert
me of new notes
Company
Profile
|
SIRO
- NASDAQ
Sirona Dental Systems
HEALTH SERVICES - Medical Instruments & Supplies
|
$37.72
|
-0.08
|
700,915
123% DAV
570,500
|
2/16/2010
(Date
Featured) |
$36.43
(Price
Featured) |
PP = $36.15 |
Y |
| MB = $37.96 |
Most Recent Note - 3/19/2010 4:51:52 PM
Y - Small loss today on average volume, perched very near its max buy level. Prior chart highs and its 50 DMA line in the $35-36 area define important support to watch.
>>> The latest Featured Stock Update with an annotated graph appeared on 3/9/2010. click here.
|
|
C
A
S
I |
News |
Chart |
SEC
View all notes Alert
me of new notes
Company
Profile
|
ULTA
- NASDAQ
Ulta Salon Cosm & Frag
SPECIALTY RETAIL - Specialty Retail, Other
|
$21.70
|
-0.94
|
447,946
114% DAV
393,500
|
3/12/2010
(Date
Featured) |
$22.81
(Price
Featured) |
PP = $21.72 |
Y |
| MB = $22.81 |
Most Recent Note - 3/19/2010 4:54:50 PM
Y - Gapped down and closed near its pivot point and near the session low today for a loss on average volume. It found prompt support following a loss on 3/15/10 after an analyst downgrade. Prior chart highs in the $21 area now define a very important technical support level. A detailed Stock Bulletin with annotated graph was published soon after it was featured in the 3/12/10 mid-day report.
>>> The latest Featured Stock Update with an annotated graph appeared on 3/12/2010. click here.
|
|
C
A
S
I |
News |
Chart |
SEC
View all notes Alert
me of new notes
Company
Profile
|
VPRT
- NASDAQ
Vistaprint Nv
DIVERSIFIED SERVICES - Business/Management Services
|
$60.00
|
+0.00
|
267,525
57% DAV
469,700
|
3/1/2010
(Date
Featured) |
$57.72
(Price
Featured) |
PP = $59.70 |
Y |
| MB = $62.69 |
Most Recent Note - 3/19/2010 4:56:57 PM
Y - Volume totals have been cooling in recent weeks while consolidating in a tight trading range, now only -4.4% from its 3/09/10 all-time high. It did not trigger a technical buy signal since it was featured in the March 2010 CANSLIM.net News monthly newsletter (read here). As previously noted, "Its gain on 3/02/10 was below the volume guidelines for buyable breakouts under the investment system."
>>> The latest Featured Stock Update with an annotated graph appeared on 3/19/2010. click here.
|
|
C
A
S
I |
News |
Chart |
SEC
View all notes Alert
me of new notes
Company
Profile
|
|
|
|
THESE ARE NOT BUY RECOMMENDATIONS!
Comments contained in the body of this report are technical
opinions only. The material herein has been obtained
from sources believed to be reliable and accurate, however,
its accuracy and completeness cannot be guaranteed.
This site is not an investment advisor, hence it does
not endorse or recommend any securities or other investments.
Any recommendation contained in this report may not
be suitable for all investors and it is not to be deemed
an offer or solicitation on our part with respect to
the purchase or sale of any securities. All trademarks,
service marks and trade names appearing in this report
are the property of their respective owners, and are
likewise used for identification purposes only.
This report is a service available
only to active Paid Premium Members.
You may opt-out of receiving report notifications
at any time. Questions or comments may be submitted
by writing to Premium Membership Services 665 S.E. 10 Street, Suite 201 Deerfield Beach, FL 33441-5634 or by calling 1-800-965-8307
or 954-785-1121.
|
|
|


