You are not logged in.
This means you
CAN ONLY VIEW reports that were published prior to Sunday, April 13, 2025.
You
MUST UPGRADE YOUR MEMBERSHIP if you want to see any current reports.
AFTER MARKET UPDATE - THURSDAY, MARCH 18TH, 2010
Previous After Market Report Next After Market Report >>>
|
|
|
|
DOW |
+45.50 |
10,779.17 |
+0.42% |
|
Volume |
923,353,200 |
-10% |
|
Volume |
2,096,242,330 |
-6% |
|
NASDAQ |
+2.19 |
2,391.28 |
+0.09% |
|
Advancers |
1,283 |
41% |
|
Advancers |
1,163 |
41% |
|
S&P 500 |
-0.38 |
1,165.83 |
-0.03% |
|
Decliners |
1,735 |
55% |
|
Decliners |
1,534 |
54% |
|
Russell 2000 |
-2.37 |
681.61 |
-0.35% |
|
52 Wk Highs |
367 |
|
|
52 Wk Highs |
161 |
|
|
S&P 600 |
-1.03 |
362.75 |
-0.28% |
|
52 Wk Lows |
1 |
|
|
52 Wk Lows |
13 |
|
|
 |
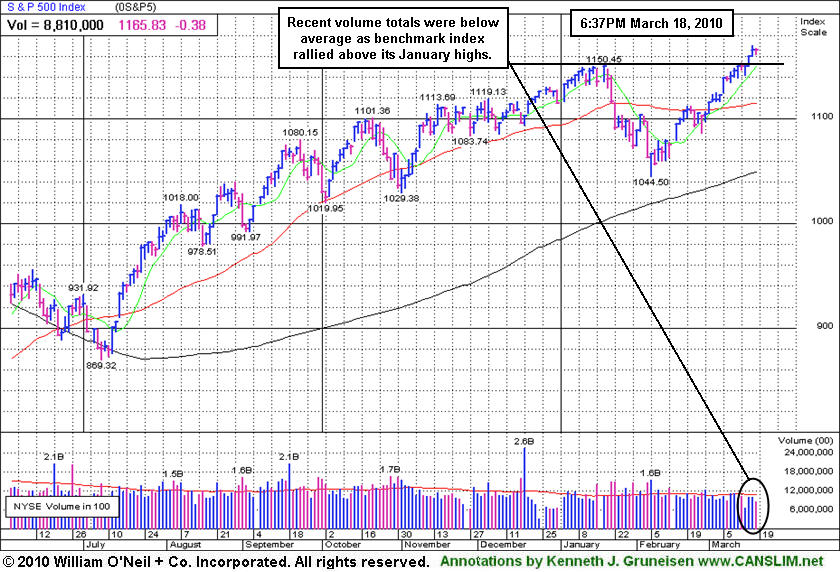
Volume Totals Cool As Indices Finish Little Changed
Adam Sarhan, Contributing Writer,
The major averages traded between positive and negative territory for most of the day after the dollar rose and investors digested a slew of economic data. Volume totals were reported lower on the Nasdaq exchange and on the NYSE compared to the prior session. Decliners led advancers by nearly a 3-to-2 ratio on the NYSE and on the Nasdaq exchange. There were 46 high-ranked companies from the CANSLIM.net Leaders List that made a new 52-week high and appeared on the CANSLIM.net BreakOuts Page, lower than the 77 issues that appeared on the prior session. New 52-week highs again overwhelmingly trumped new lows on both exchanges.
The US dollar rallied after speculation increased that the Federal Reserve will raise its discount rate in the near future. The discount rate is the rate the Fed uses to charge banks for direct loans, was last raised after the market closed on Feb. 18, 2010. The Fed raised its discount rate by a quarter percentage point to +0.75% and said the move would encourage banks to rely more on money markets for short-term liquidity needs which would help stimulate the system.
Economic news was mixed: consumer prices were mild, leading economic indicators rose +0.1% last month while jobless claims slid. The Labor Department said weekly jobless claims dropped by -5,000 to 457,000 last week. Meanwhile, consumer prices were unchanged for the first time since March 2009. The Conference Board said the index of leading indicators rose +0.1% in February which was the 11th consecutive gain.
The fact that we have not seen any serious distribution days since the FTD bodes well for this nascent rally. It is also a welcome sign to see the market continue to improve as investors digest the latest round of stronger than expected economic and earnings data. Remember that now that a new rally has been confirmed, the window is open to start buying high quality breakouts. Trade accordingly.
Professional Money Management Services - A Winning System - Inquire today!
Our skilled team of portfolio managers knows how to follow the rules of this fact-based investment system. We do not follow opinion or the "conviction list" of some large Wall Street institution which would have us fully invested even during horrific bear markets. Instead, we remain fluid and only buy the best stocks when they are triggering proper technical buy signals. If you are not completely satisfied with the way your portfolio is being managed, Click here to get connected with one of our portfolio managers. *Accounts over $250,000 please. ** Serious inquires only, please
PICTURED: The recent volume totals were below average as benchmark S&P 500 Index rallied above its January highs.
|
|
|
 |
Broker/Dealer Index Challenging Resistance Level
Kenneth J. Gruneisen - Passed the CAN SLIM® Master's Exam
The Healthcare Index ($HMO +3.07%) was a standout gainer Thursday, yet a very important vote among policymakers in Washington DC on healthcare reform is approaching, and uncertainty looms large over the impact it may have on corporate earnings in the healthcare and insurance industries. Energy-related shares were among session's laggards as the Oil Services Index ($OSX -2.76%) and Integrated Oil Index ($XOI -0.85%) fell, and the Gold & Silver Index ($XAU -0.69%) ended with a small loss. The Bank Index ($BKX -1.22%) and Broker/Dealer Index ($XBD -0.57%) traded with a slightly negative bias, and the Retail Index ($RLX +0.04%) ended virtually unchanged. The tech sector was mixed, with modest gains from the Internet Index ($IIX +0.20%) and Biotechnology Index ($BTK +0.30%) offset by slightly bigger losses for the Networking Index ($NWX -1.14%) and Semiconductor Index ($SOX -0.66%).
Charts courtesy www.stockcharts.com
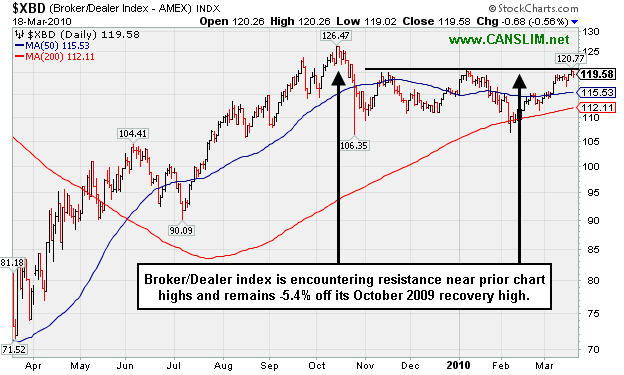
PICTURED: The Broker/Dealer Index ($XBD -0.57%) is encountering resistance near prior chart highs and remains -5.4% off its October 2009 recovery high. Financial stocks are important leading indicators that regular readers of this report know weigh heavily into the assessment of the overall market outlook. By comparison, the Bank Index has rallied about +5% above its October 2009 highs and clearly outpaced the Broker/Dealer Index. In the near term we will watch closely to see if the Broker/Dealer Index can make more progress which, technically, would bode well for the outlook.
| Oil Services |
$OSX |
209.55 |
-5.95 |
-2.76% |
+7.51% |
| Healthcare |
$HMO |
1,551.10 |
+46.25 |
+3.07% |
+5.31% |
| Integrated Oil |
$XOI |
1,083.69 |
-9.34 |
-0.85% |
+1.45% |
| Semiconductor |
$SOX |
361.64 |
-2.42 |
-0.66% |
+0.48% |
| Networking |
$NWX |
258.20 |
-2.98 |
-1.14% |
+11.75% |
| Internet |
$IIX |
248.45 |
+0.50 |
+0.20% |
+6.24% |
| Broker/Dealer |
$XBD |
119.58 |
-0.68 |
-0.57% |
+3.94% |
| Retail |
$RLX |
446.68 |
+0.16 |
+0.04% |
+8.65% |
| Gold & Silver |
$XAU |
168.60 |
-1.17 |
-0.69% |
+0.21% |
| Bank |
$BKX |
51.63 |
-0.64 |
-1.22% |
+20.89% |
| Biotech |
$BTK |
1,221.31 |
+3.61 |
+0.30% |
+29.63% |
|
|
|
 |
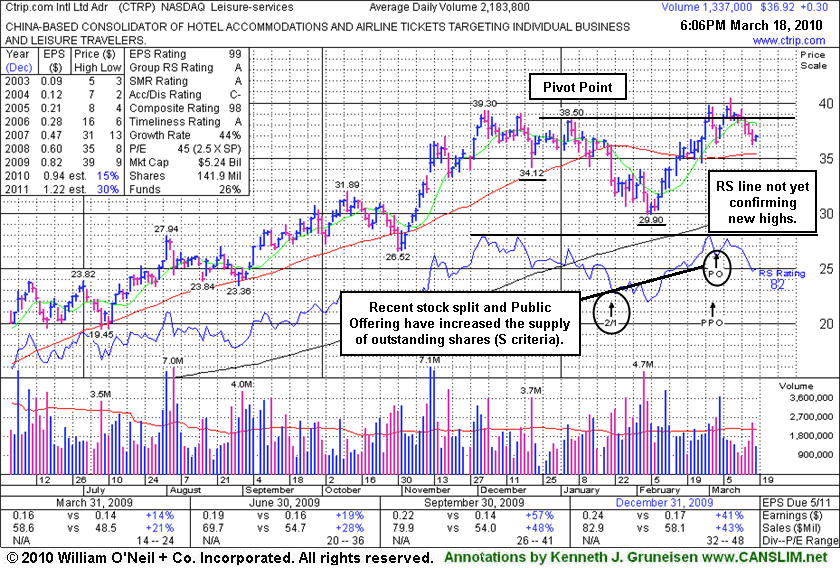
Recent Offering And Split Increased Supply of Shares
Kenneth J. Gruneisen - Passed the CAN SLIM® Master's Exam
Ctrip.com Int'l Ltd. (CTRP +0.30 or +0.82% to $36.92) halted its slide today with a small gain on light volume following 5 consecutive losses. It has been slumping below its pivot point toward its 50-day moving average (DMA) line. A gain above its pivot point or its most recent chart highs is still needed to confirm a fresh technical buy signal with +50% above average volume or more. Any subsequent slump below its 50-day moving average (DMA) line would raise concerns and trigger technical sell signals.
It completed an offering of additional shares on 3/03/10, shortly after it was featured under the headline "Leisure Services Firm Building Double Bottom Base" in the March 2010 issue of CANSLIM.net News. That offering, and a recent 2:1 stock split, had the effect of increasing the supply of shares outstanding (S criteria) for this high-ranked China-based firm in the strong-performing Leisure - Services industry. It has maintained a strong and steady annual earnings (A criteria) history. Fundamentally, its sales revenues and earnings increases have been strong in the 3 most recent quarterly comparisons and solidly above the +25% guideline (C criteria). Another very encouraging sign with respect to the investment system guidelines is that the number of top-rated funds owning its shares increased from 51 in Mar '09 to 126 in Dec '09, which helps satisfy the I criteria. Return On Equity is reported at 32%, well above the 17% minimum.
While the stock is currently trading within close striking range of its pivot point and all-time highs it is important to remain disciplined. It could be accumulated under the investment system guidelines only if a proper technical buy signal occurs. The stock did not trigger a technical buy signal and only encountered resistance since the "double bottom" type base was identified and it returned to the Featured Stocks list. Now it faces some resistance up through the $39-40 area, yet it does not have a lot of overhead supply to hinder its progress. Patient and disciplined investors will avoid the temptation to get in "early" and be on the watch for a fresh indication that more serious institutional accumulation is taking place which could lead to a sustainable advance into new high ground.
|
|
|
Color Codes Explained :
Y - Better candidates highlighted by our
staff of experts.
G - Previously featured
in past reports as yellow but may no longer be buyable under the
guidelines.
***Last / Change / Volume quote data in this table corresponds with the timestamp on the note***
Symbol/Exchange
Company Name
Industry Group |
Last |
Chg. |
Vol
% DAV |
Date Featured |
Price Featured |
Latest Pivot Point
Featured |
Status |
| Latest Max Buy Price |
ARUN
- NASDAQ
Aruba Networks Inc
COMPUTER HARDWARE - Networking & Communication Dev
|
$12.79
|
-0.20
|
1,294,462
86% DAV
1,505,200
|
2/19/2010
(Date
Featured) |
$12.71
(Price
Featured) |
PP = $11.94 |
G |
| MB = $12.54 |
Most Recent Note - 3/18/2010 5:29:41 PM
G - Second consecutive small loss today on near average volume. Consolidating in a healthy fashion after recent gains on high volume, it is still above its "max buy" level. Patient investors may watch for opportunities to accumulate shares on light volume pullbacks toward support defined by prior chart highs and its 50 DMA line.
>>> The latest Featured Stock Update with an annotated graph appeared on 3/11/2010. click here.
|
|
C
A
S
I |
News |
Chart |
SEC
View all notes Alert
me of new notes
Company
Profile
|
BIDU
- NASDAQ
Baidu Inc Ads
INTERNET - Internet Information Providers
|
$564.66
|
-2.29
|
956,473
46% DAV
2,097,700
|
1/13/2010
(Date
Featured) |
$431.25
(Price
Featured) |
PP = $426.75 |
G |
| MB = $448.09 |
Most Recent Note - 3/18/2010 5:30:52 PM
G - Loss today on very light volume. Still quietly consolidating following its 3/15/10 considerable gap up gain with heavy volume, very extended from any sound base.
>>> The latest Featured Stock Update with an annotated graph appeared on 3/4/2010. click here.
|
|
C
A
S
I |
News |
Chart |
SEC
View all notes Alert
me of new notes
Company
Profile
|
BRLI
- NASDAQ
Bio Reference Labs Inc
HEALTH SERVICES - Medical Laboratories & Researc
|
$44.16
|
+0.09
|
68,932
70% DAV
98,200
|
2/12/2010
(Date
Featured) |
$39.02
(Price
Featured) |
PP = $40.97 |
G |
| MB = $43.02 |
Most Recent Note - 3/18/2010 5:32:41 PM
G - Quietly hold its ground in a tight range, consolidating near its 52-week high following a negative reversal on 3/12/10. It is extended from its prior base, and prior chart highs and its 50 DMA line now coincide in the $40 area defining important support to watch.
>>> The latest Featured Stock Update with an annotated graph appeared on 3/1/2010. click here.
|
|
C
A
S
I |
News |
Chart |
SEC
View all notes Alert
me of new notes
Company
Profile
|
CISG
- NASDAQ
Cninsure Inc Ads
INSURANCE - Insurance Brokers
|
$25.50
|
+0.15
|
191,213
86% DAV
221,600
|
3/3/2010
(Date
Featured) |
$24.38
(Price
Featured) |
PP = $23.10 |
G |
| MB = $24.26 |
Most Recent Note - 3/18/2010 5:34:40 PM
G - Positively reversed today for a gain after early weakness. Stubbornly holding its ground -3% off its 52-week high. No overhead supply remains to act as resistance. It rose from a 20-week double bottom base with 8 times average volume as it was featured in the 3/03/10 mid-day report (read here).
>>> The latest Featured Stock Update with an annotated graph appeared on 3/3/2010. click here.
|
|
C
A
S
I |
News |
Chart |
SEC
View all notes Alert
me of new notes
Company
Profile
|
CRM
- NYSE
Salesforce.com Inc
INTERNET - Internet Software & Services
|
$76.91
|
+0.17
|
1,373,313
68% DAV
2,019,600
|
3/5/2010
(Date
Featured) |
$72.28
(Price
Featured) |
PP = $75.53 |
Y |
| MB = $79.31 |
Most Recent Note - 3/18/2010 5:36:21 PM
Y - Inched higher on light volume yet again today, rising above its pivot point to a new high close. Wedging higher, rising from a 9-week base without the required volume to trigger a proper technical buy signal. Its 50 DMA line and recent chart low ($64.77 on 2/25/10) define important support.
>>> The latest Featured Stock Update with an annotated graph appeared on 3/5/2010. click here.
|
|
C
A
S
I |
News |
Chart |
SEC
View all notes Alert
me of new notes
Company
Profile
|
CTRP
- NASDAQ
Ctrip.com Intl Ltd Adr
LEISURE - Resorts & Casinos
|
$36.92
|
+0.30
|
1,338,662
61% DAV
2,183,800
|
3/1/2010
(Date
Featured) |
$38.23
(Price
Featured) |
PP = $38.50 |
Y |
| MB = $40.43 |
Most Recent Note - 3/18/2010 5:38:36 PM
Y - Halted its slide today with a small gain on light volume following 5 consecutive losses. It has been slumping below its pivot point toward its 50 DMA line. A gain above its pivot point or its most recent chart highs is still needed to confirm a fresh technical buy signal with +50% above average volume or more. Completed an offering of additional shares on 3/03/10, shortly after featured in the March 2010 issue of CANSLIM.net News (read here).
>>> The latest Featured Stock Update with an annotated graph appeared on 3/18/2010. click here.
|
|
C
A
S
I |
News |
Chart |
SEC
View all notes Alert
me of new notes
Company
Profile
|
EZPW
- NASDAQ
Ezcorp Inc Cl A
SPECIALTY RETAIL - Specialty Retail, Other
|
$20.73
|
+0.04
|
377,094
69% DAV
542,800
|
2/19/2010
(Date
Featured) |
$19.03
(Price
Featured) |
PP = $18.80 |
G |
| MB = $19.74 |
Most Recent Note - 3/18/2010 5:42:09 PM
G - Quietly held its ground today. Its positive reversal on 3/16/10 was a reassuring sign of support after its 3/15/10 a loss with volume nearly 4 times average volume indicated distributional pressure. Extended from any sound base, its 50 DMA line defines important support to watch.
>>> The latest Featured Stock Update with an annotated graph appeared on 3/8/2010. click here.
|
|
C
A
S
I |
News |
Chart |
SEC
View all notes Alert
me of new notes
Company
Profile
|
GMCR
- NASDAQ
Green Mtn Coffee Roastrs
FOOD & BEVERAGE - Processed & Packaged Goods
|
$96.80
|
-0.81
|
764,315
58% DAV
1,316,400
|
2/26/2010
(Date
Featured) |
$84.39
(Price
Featured) |
PP = $88.75 |
G |
| MB = $93.19 |
Most Recent Note - 3/18/2010 5:45:03 PM
G - Small loss today on light volume after 6 consecutive gains. Its high volume gain on 3/08/10 triggered a new technical buy signal. Extended from its latest sound base, initial support to watch is prior chart highs in the $86-88 area.
>>> The latest Featured Stock Update with an annotated graph appeared on 3/12/2010. click here.
|
|
C
A
S
I |
News |
Chart |
SEC
View all notes Alert
me of new notes
Company
Profile
|
ISRG
- NASDAQ
Intuitive Surgical Inc
HEALTH SERVICES - Medical Appliances & Equipment
|
$353.59
|
-2.59
|
299,113
58% DAV
514,600
|
1/22/2010
(Date
Featured) |
$340.40
(Price
Featured) |
PP = $314.00 |
G |
| MB = $329.70 |
Most Recent Note - 3/18/2010 5:46:21 PM
G - Small loss today on light volume. Still continuing its consolidation in a tight range on very light volume near all-time highs. It has not triggered a sound technical buy signal in recent weeks, meanwhile prior chart highs near $346 are an initial support level to watch.
>>> The latest Featured Stock Update with an annotated graph appeared on 3/16/2010. click here.
|
|
C
A
S
I |
News |
Chart |
SEC
View all notes Alert
me of new notes
Company
Profile
|
PCLN
- NASDAQ
Priceline.com Inc
INTERNET - Internet Software & Services
|
$399.55
|
-4.72
|
584,812
N/A
|
11/1/2002
(Date
Featured) |
$399.55
(Price
Featured) |
PP = $428.20 |
Y |
| MB = $449.61 |
Most Recent Note - 1/2/2011
Y - Returns to Featured Stocks list with its appearance in the January 2011 CANSLIM.net News including detailed analysis and annotated daily and weekly graphs.
>>> The latest Featured Stock Update with an annotated graph appeared on 3/10/2010. click here.
|
|
C
A
S
I |
News |
Chart |
SEC
View all notes Alert
me of new notes
Company
Profile
|
PEGA
- NASDAQ
Pegasystems Inc
COMPUTER SOFTWARE & SERVICES - Business Software & Services
|
$38.49
|
-0.40
|
115,089
52% DAV
220,100
|
2/26/2010
(Date
Featured) |
$36.00
(Price
Featured) |
PP = $38.55 |
Y |
| MB = $40.48 |
Most Recent Note - 3/18/2010 5:51:28 PM
Y - Small loss today on light volume led to a close just below its latest pivot point. Consolidating in a tight range near all-time highs since a considerable gap up gain on 3/15/10 triggered a technical buy signal Recently found support at its 50 DMA line, while prior chart lows in the $32 area are the next support level.
>>> The latest Featured Stock Update with an annotated graph appeared on 3/15/2010. click here.
|
|
C
A
S
I |
News |
Chart |
SEC
View all notes Alert
me of new notes
Company
Profile
|
ROVI
- NASDAQ
Rovi Corp
COMPUTER SOFTWARE & SERVICES - Security Software & Services
|
$37.48
|
-0.20
|
695,808
51% DAV
1,363,900
|
2/25/2010
(Date
Featured) |
$33.54
(Price
Featured) |
PP = $34.87 |
G |
| MB = $36.61 |
Most Recent Note - 3/18/2010 5:54:05 PM
G - This week it has been consolidating quietly in a tight trading range near all-time highs. It is extended from its latest base, and prior chart highs in the $34 area define an important support level to watch on pullbacks.
>>> The latest Featured Stock Update with an annotated graph appeared on 3/17/2010. click here.
|
|
C
A
S
I |
News |
Chart |
SEC
View all notes Alert
me of new notes
Company
Profile
|
SIRO
- NASDAQ
Sirona Dental Systems
HEALTH SERVICES - Medical Instruments & Supplies
|
$37.80
|
+0.72
|
435,518
76% DAV
576,300
|
2/16/2010
(Date
Featured) |
$36.43
(Price
Featured) |
PP = $36.15 |
Y |
| MB = $37.96 |
Most Recent Note - 3/18/2010 5:56:23 PM
Y - Small gain today on light volume for a new high close near its max buy level. Prior chart highs and its 50 DMA line in the $35-36 area define important support to watch.
>>> The latest Featured Stock Update with an annotated graph appeared on 3/9/2010. click here.
|
|
C
A
S
I |
News |
Chart |
SEC
View all notes Alert
me of new notes
Company
Profile
|
ULTA
- NASDAQ
Ulta Salon Cosm & Frag
SPECIALTY RETAIL - Specialty Retail, Other
|
$22.64
|
+0.15
|
237,096
59% DAV
398,800
|
3/12/2010
(Date
Featured) |
$22.81
(Price
Featured) |
PP = $21.72 |
Y |
| MB = $22.81 |
Most Recent Note - 3/18/2010 5:57:46 PM
Y - Overcame early weakness today and closed near the session high for a small gain on light volume. It found prompt support following a loss on 3/15/10 after an analyst downgrade. Prior chart highs in the $21 area now define a very important technical support level. A detailed Stock Bulletin with annotated graph was published soon after it was featured in the 3/12/10 mid-day report.
>>> The latest Featured Stock Update with an annotated graph appeared on 3/12/2010. click here.
|
|
C
A
S
I |
News |
Chart |
SEC
View all notes Alert
me of new notes
Company
Profile
|
VPRT
- NASDAQ
Vistaprint Nv
DIVERSIFIED SERVICES - Business/Management Services
|
$60.00
|
-0.10
|
208,779
43% DAV
485,400
|
3/1/2010
(Date
Featured) |
$57.72
(Price
Featured) |
PP = $59.70 |
Y |
| MB = $62.69 |
Most Recent Note - 3/18/2010 6:00:07 PM
Y - Volume totals have been cooling while consolidating in a tight trading range only -4.4% from its 3/09/10 all-time high. It did not trigger a technical buy signal since it was featured in the March 2010 CANSLIM.net News monthly newsletter (read here). As previously noted, "Its gain on 3/02/10 was below the volume guidelines for buyable breakouts under the investment system."
>>> The latest Featured Stock Update with an annotated graph appeared on 2/28/2010. click here.
|
|
C
A
S
I |
News |
Chart |
SEC
View all notes Alert
me of new notes
Company
Profile
|
|
|
|
THESE ARE NOT BUY RECOMMENDATIONS!
Comments contained in the body of this report are technical
opinions only. The material herein has been obtained
from sources believed to be reliable and accurate, however,
its accuracy and completeness cannot be guaranteed.
This site is not an investment advisor, hence it does
not endorse or recommend any securities or other investments.
Any recommendation contained in this report may not
be suitable for all investors and it is not to be deemed
an offer or solicitation on our part with respect to
the purchase or sale of any securities. All trademarks,
service marks and trade names appearing in this report
are the property of their respective owners, and are
likewise used for identification purposes only.
This report is a service available
only to active Paid Premium Members.
You may opt-out of receiving report notifications
at any time. Questions or comments may be submitted
by writing to Premium Membership Services 665 S.E. 10 Street, Suite 201 Deerfield Beach, FL 33441-5634 or by calling 1-800-965-8307
or 954-785-1121.
|
|
|


