You are not logged in.
This means you
CAN ONLY VIEW reports that were published prior to Sunday, April 13, 2025.
You
MUST UPGRADE YOUR MEMBERSHIP if you want to see any current reports.
AFTER MARKET UPDATE - MONDAY, MARCH 22ND, 2010
Previous After Market Report Next After Market Report >>>
|
|
|
|
DOW |
+43.91 |
10,785.89 |
+0.41% |
|
Volume |
953,875,310 |
-52% |
|
Volume |
2,356,848,380 |
-25% |
|
NASDAQ |
+20.99 |
2,395.40 |
+0.88% |
|
Advancers |
2,001 |
63% |
|
Advancers |
1,750 |
62% |
|
S&P 500 |
+5.91 |
1,165.81 |
+0.51% |
|
Decliners |
1,014 |
32% |
|
Decliners |
986 |
35% |
|
Russell 2000 |
+9.02 |
682.91 |
+1.34% |
|
52 Wk Highs |
241 |
|
|
52 Wk Highs |
170 |
|
|
S&P 600 |
+4.96 |
364.39 |
+1.38% |
|
52 Wk Lows |
9 |
|
|
52 Wk Lows |
14 |
|
|
 |
Major Averages Post Gains After Healthcare Bill Passes
Adam Sarhan, Contributing Writer,
The major averages ended higher as the dollar fell after Congress passed the historic health care bill. As expected, volume totals contracted compared to Friday's options inflated levels on both major exchanges. Advancers led decliners by nearly a 2-to-1 ratio on the NYSE and the Nasdaq exchange. There were 45 high-ranked companies from the CANSLIM.net Leaders List that made a new 52-week high and appeared on the CANSLIM.net BreakOuts Page, higher than the 37 issues that appeared on the prior session. New 52-week highs again overwhelmingly trumped new lows on both exchanges.
Late Sunday night, the US House of Representatives passed the historic health-care bill which will allow uninsured Americans to get medical coverage and add a whopping $940 billion in debt over the next decade. To pay for the plan, in 2013 the government wants to initiate new Medicare taxes on individuals who earn more than $200,000 per year and joint filers who earn more than $250,000 per year. Taxes will increase to 2.35% from 1.45% and a new 3.8% tax on unearned income such as dividends and interest will be created. Finally, there will be an excise tax of 2.3% on the sale of medical devices.
The fact that there has only been one distribution day since the follow-though-day (FTD) bodes well for this nascent rally. It is also a welcome sign to see the market continue to improve as investors digest the latest round of stronger than expected economic and earnings data. Remember that now that a new rally has been confirmed, the window is open to proactively be buying high quality breakouts meeting the investment system guidelines. Trade accordingly.
Professional Money Management Services - A Winning System - Inquire today!
Our skilled team of portfolio managers knows how to follow the rules of this fact-based investment system. We do not follow opinion or the "conviction list" of some large Wall Street institution which would have us fully invested even during horrific bear markets. Instead, we remain fluid and only buy the best stocks when they are triggering proper technical buy signals. If you are not completely satisfied with the way your portfolio is being managed, Click here to get connected with one of our portfolio managers. *Accounts over $250,000 please. ** Serious inquires only, please
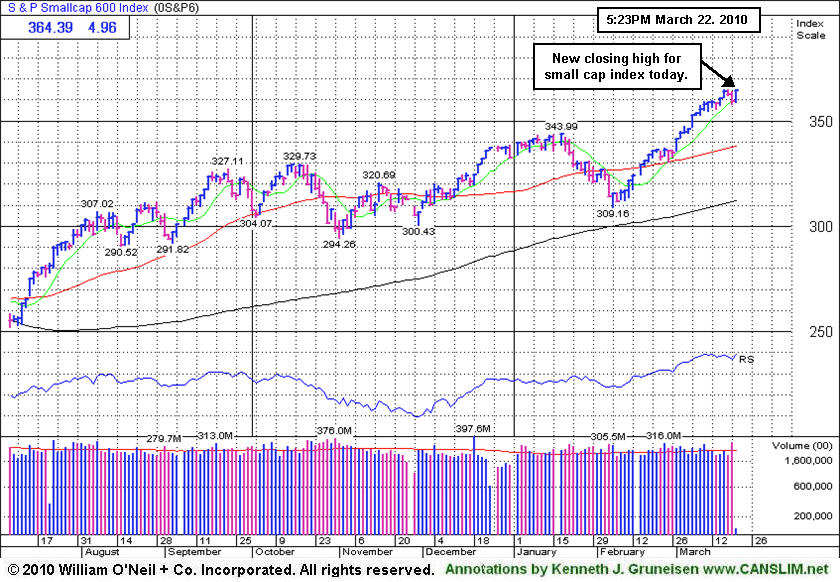
PICTURED: The S&P 600 Small Cap Index closed at a new recovery high. Volume was lighter than Friday's high total, however the chart above does not show the correct volume plotted corresponding to Monday's action.
|
|
|
 |
Healthcare, Tech, Retail, and Bank Indexes Rise
Kenneth J. Gruneisen - Passed the CAN SLIM® Master's Exam
The Healthcare Index ($HMO +1.26%) and Biotechnology Index ($BTK +0.94%) posted small gains after the healthcare reform bill passed the House. Tech share rose as the Networking Index ($NWX +1.16%) and Internet Index ($IIX +0.50%) tacked on modest gains. Gains for the Retail Index ($RLX +1.24%) and Bank Index ($BKX +1.13%) also had a positive influence on the major averages while the Broker/Dealer Index ($XBD -0.14%) edged lower. Commodity-linked groups were little changed as the Gold & Silver Index ($XAU +0.30%) posted a small gain, the Oil Services Index ($OSX +0.06%) and Integrated Oil Index ($XOI -0.17%) had very quiet sessions.
Charts courtesy www.stockcharts.com
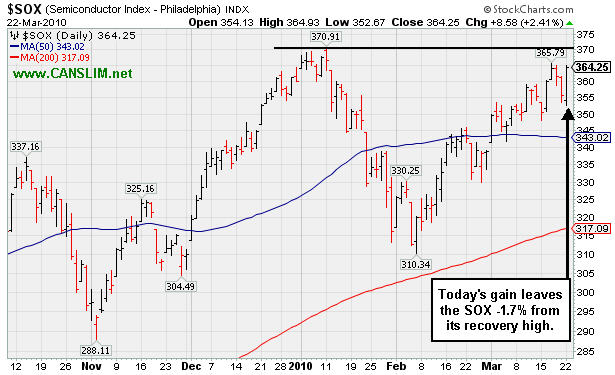
PICTURED: The Semiconductor Index ($SOX +2.41%) was a standout gainer on Monday, rallying to within -1.7% of its recovery high.
| Oil Services |
$OSX |
203.93 |
+0.12 |
+0.06% |
+4.62% |
| Healthcare |
$HMO |
1,605.02 |
+20.01 |
+1.26% |
+8.97% |
| Integrated Oil |
$XOI |
1,073.43 |
-1.83 |
-0.17% |
+0.49% |
| Semiconductor |
$SOX |
364.25 |
+8.58 |
+2.41% |
+1.21% |
| Networking |
$NWX |
257.63 |
+2.96 |
+1.16% |
+11.50% |
| Internet |
$IIX |
246.90 |
+1.15 |
+0.47% |
+5.61% |
| Broker/Dealer |
$XBD |
117.93 |
-0.22 |
-0.19% |
+2.55% |
| Retail |
$RLX |
450.99 |
+5.51 |
+1.24% |
+9.70% |
| Gold & Silver |
$XAU |
166.49 |
+0.50 |
+0.30% |
-1.05% |
| Bank |
$BKX |
51.71 |
+0.58 |
+1.13% |
+21.07% |
| Biotech |
$BTK |
1,231.92 |
+10.62 |
+0.87% |
+30.85% |
|
|
|
 |
High-Ranked Medical Firm Now Extended From Its Prior Base
Kenneth J. Gruneisen - Passed the CAN SLIM® Master's Exam
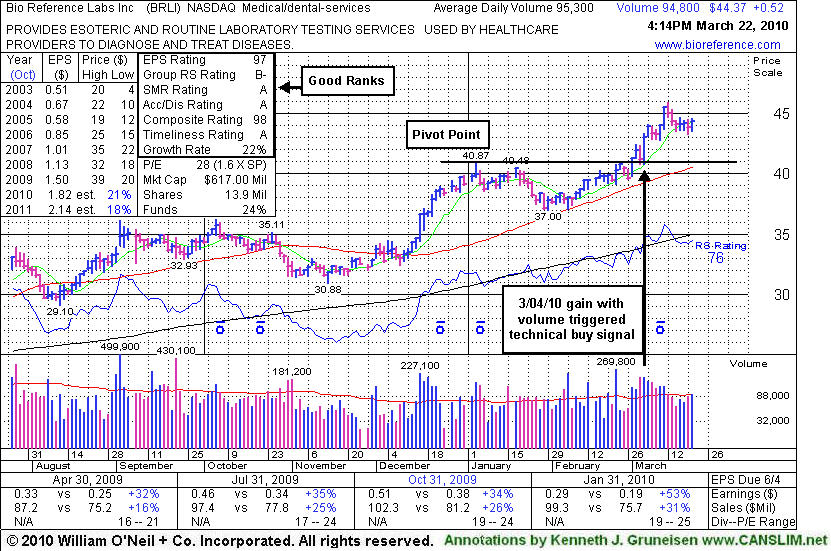
Bio-Reference Laboratories, Inc. (BRLI +$0.52 or +1.19% to $44.37) has been consolidating very near its 52-week high since its negative reversal on 3/12/10. This high-ranked Medical-Dental - Services firm is slightly extended from its prior base, and prior chart highs and its 50-day moving average (DMA) line now coincide in the $40 area defining important support to watch. Any subsequent deterioration below those levels would raise concerns and trigger technical sell signals.
A gain on 3/04/10 with 2 times average volume lifted it solidly above its pivot point, confirming a technical buy signal. Its weekly chart is marked by many up weeks with above average volume and few down weeks on volume - very bullish characteristics. No resistance remains due to overhead supply now, which could allow for a significant sprint higher. Earnings growth and sales revenues growth has accelerated, with increases better than the +25% minimum guideline in recent quarters. Fundamentals are favorable with respect to the C and A criteria of the investment system. BRLI has only 13.9 million shares outstanding (S criteria) and has average daily volume under 100,000 shares, which could contribute to greater price volatility in the event of more decisive institutional buying or selling. The number of top-rated funds owning its shares rose from 77 in Mar '09 to 87 in Dec '09 which is somewhat reassuring in regard to the I criteria of the investment system.
|
|
|
Color Codes Explained :
Y - Better candidates highlighted by our
staff of experts.
G - Previously featured
in past reports as yellow but may no longer be buyable under the
guidelines.
***Last / Change / Volume quote data in this table corresponds with the timestamp on the note***
Symbol/Exchange
Company Name
Industry Group |
Last |
Chg. |
Vol
% DAV |
Date Featured |
Price Featured |
Latest Pivot Point
Featured |
Status |
| Latest Max Buy Price |
ARUN
- NASDAQ
Aruba Networks Inc
COMPUTER HARDWARE - Networking & Communication Dev
|
$12.52
|
-0.03
|
1,065,270
70% DAV
1,529,300
|
2/19/2010
(Date
Featured) |
$12.71
(Price
Featured) |
PP = $11.94 |
G |
| MB = $12.54 |
Most Recent Note - 3/22/2010 4:08:39 PM
G - Today marked its 4th consecutive small loss while consolidating after recent gains on heavy volume. Pulling back toward support defined by prior chart highs and its 50 DMA line.
>>> The latest Featured Stock Update with an annotated graph appeared on 3/11/2010. click here.
|
|
C
A
S
I |
News |
Chart |
SEC
View all notes Alert
me of new notes
Company
Profile
|
BIDU
- NASDAQ
Baidu Inc Ads
INTERNET - Internet Information Providers
|
$579.72
|
+10.07
|
3,232,956
156% DAV
2,077,000
|
1/13/2010
(Date
Featured) |
$431.25
(Price
Featured) |
PP = $426.75 |
G |
| MB = $448.09 |
Most Recent Note - 3/22/2010 4:10:31 PM
G - Gain today with above average volume for a new high close. Held its ground following its 3/15/10 considerable gap up gain with heavy volume. It is extended from any sound base now.
>>> The latest Featured Stock Update with an annotated graph appeared on 3/4/2010. click here.
|
|
C
A
S
I |
News |
Chart |
SEC
View all notes Alert
me of new notes
Company
Profile
|
BRLI
- NASDAQ
Bio Reference Labs Inc
HEALTH SERVICES - Medical Laboratories & Researc
|
$44.37
|
+0.52
|
94,845
100% DAV
95,300
|
2/12/2010
(Date
Featured) |
$39.02
(Price
Featured) |
PP = $40.97 |
G |
| MB = $43.02 |
Most Recent Note - 3/22/2010 4:26:51 PM
G - Consolidating very near its 52-week high since its negative reversal on 3/12/10. It is slightly extended from its prior base, and prior chart highs and its 50 DMA line now coincide in the $40 area defining important support to watch.
>>> The latest Featured Stock Update with an annotated graph appeared on 3/22/2010. click here.
|
|
C
A
S
I |
News |
Chart |
SEC
View all notes Alert
me of new notes
Company
Profile
|
CISG
- NASDAQ
Cninsure Inc Ads
INSURANCE - Insurance Brokers
|
$25.59
|
+0.31
|
131,381
59% DAV
221,000
|
3/3/2010
(Date
Featured) |
$24.38
(Price
Featured) |
PP = $23.10 |
G |
| MB = $24.26 |
Most Recent Note - 3/22/2010 4:29:11 PM
G - Small gain today on light volume, stubbornly holding its ground -2.7% off its 52-week high. No overhead supply remains to act as resistance. It rose from a 20-week double bottom base with 8 times average volume as it was featured in the 3/03/10 mid-day report (read here).
>>> The latest Featured Stock Update with an annotated graph appeared on 3/3/2010. click here.
|
|
C
A
S
I |
News |
Chart |
SEC
View all notes Alert
me of new notes
Company
Profile
|
CRM
- NYSE
Salesforce.com Inc
INTERNET - Internet Software & Services
|
$77.51
|
+1.49
|
1,622,311
81% DAV
2,012,700
|
3/5/2010
(Date
Featured) |
$72.28
(Price
Featured) |
PP = $75.53 |
Y |
| MB = $79.31 |
Most Recent Note - 3/22/2010 4:31:59 PM
Y - Positive reversal after a small gap down today, closing at a new high above its pivot point. Wedging higher, rising from a 9-week base without the required volume to trigger a proper technical buy signal. Its 50 DMA line and recent chart low ($64.77 on 2/25/10) define important support.
>>> The latest Featured Stock Update with an annotated graph appeared on 3/5/2010. click here.
|
|
C
A
S
I |
News |
Chart |
SEC
View all notes Alert
me of new notes
Company
Profile
|
CTRP
- NASDAQ
Ctrip.com Intl Ltd Adr
LEISURE - Resorts & Casinos
|
$36.77
|
+0.77
|
2,833,683
132% DAV
2,154,100
|
3/1/2010
(Date
Featured) |
$38.23
(Price
Featured) |
PP = $38.50 |
G |
| MB = $40.43 |
Most Recent Note - 3/22/2010 4:35:00 PM
G - Positive reversal today for a gain with above average volume, rebounding after early losses nearly tested its 50 DMA line. Color code was changed to green based on recent weakness. A gain above its pivot point or its most recent chart highs with +50% above average volume or more is still needed to confirm a fresh technical buy signal. Completed an offering of additional shares on 3/03/10, shortly after featured in the March 2010 issue of CANSLIM.net News (read here).
>>> The latest Featured Stock Update with an annotated graph appeared on 3/18/2010. click here.
|
|
C
A
S
I |
News |
Chart |
SEC
View all notes Alert
me of new notes
Company
Profile
|
EZPW
- NASDAQ
Ezcorp Inc Cl A
SPECIALTY RETAIL - Specialty Retail, Other
|
$20.77
|
+0.34
|
540,731
102% DAV
531,700
|
2/19/2010
(Date
Featured) |
$19.03
(Price
Featured) |
PP = $18.80 |
G |
| MB = $19.74 |
Most Recent Note - 3/22/2010 4:36:03 PM
G - Gain today with average volume, consolidating well above its 50 DMA line - important support to watch. Its positive reversal on 3/16/10 was a reassuring sign of support after its 3/15/10 a loss with volume nearly 4 times average volume indicated distributional pressure. .
>>> The latest Featured Stock Update with an annotated graph appeared on 3/8/2010. click here.
|
|
C
A
S
I |
News |
Chart |
SEC
View all notes Alert
me of new notes
Company
Profile
|
GMCR
- NASDAQ
Green Mtn Coffee Roastrs
FOOD & BEVERAGE - Processed & Packaged Goods
|
$95.79
|
+1.89
|
971,751
75% DAV
1,297,800
|
2/26/2010
(Date
Featured) |
$84.39
(Price
Featured) |
PP = $88.75 |
G |
| MB = $93.19 |
Most Recent Note - 3/22/2010 4:37:26 PM
G - Gain today on below average volume, still consolidating near all-time highs after a recent streak of 6 consecutive gains. Its high volume gain on 3/08/10 triggered a new technical buy signal. It is slightly extended from its latest sound base, and initial support to watch is prior chart highs in the $86-88 area.
>>> The latest Featured Stock Update with an annotated graph appeared on 3/12/2010. click here.
|
|
C
A
S
I |
News |
Chart |
SEC
View all notes Alert
me of new notes
Company
Profile
|
ISRG
- NASDAQ
Intuitive Surgical Inc
HEALTH SERVICES - Medical Appliances & Equipment
|
$347.80
|
-1.38
|
579,576
112% DAV
518,800
|
1/22/2010
(Date
Featured) |
$340.40
(Price
Featured) |
PP = $314.00 |
G |
| MB = $329.70 |
Most Recent Note - 3/22/2010 4:42:55 PM
G - Closed near the session high today after early weakness briefly undercut prior chart highs near $346 and nearly tested its 50 DMA line - important support levels to watch. As recently noted, it did not trigger a technical buy signal in recent weeks.
>>> The latest Featured Stock Update with an annotated graph appeared on 3/16/2010. click here.
|
|
C
A
S
I |
News |
Chart |
SEC
View all notes Alert
me of new notes
Company
Profile
|
PCLN
- NASDAQ
Priceline.com Inc
INTERNET - Internet Software & Services
|
$399.55
|
-4.72
|
584,812
N/A
|
11/1/2002
(Date
Featured) |
$399.55
(Price
Featured) |
PP = $428.20 |
Y |
| MB = $449.61 |
Most Recent Note - 1/2/2011
Y - Returns to Featured Stocks list with its appearance in the January 2011 CANSLIM.net News including detailed analysis and annotated daily and weekly graphs.
>>> The latest Featured Stock Update with an annotated graph appeared on 3/10/2010. click here.
|
|
C
A
S
I |
News |
Chart |
SEC
View all notes Alert
me of new notes
Company
Profile
|
PEGA
- NASDAQ
Pegasystems Inc
COMPUTER SOFTWARE & SERVICES - Business Software & Services
|
$38.97
|
+1.20
|
139,172
63% DAV
221,000
|
2/26/2010
(Date
Featured) |
$36.00
(Price
Featured) |
PP = $38.55 |
Y |
| MB = $40.48 |
Most Recent Note - 3/22/2010 4:46:07 PM
Y - Gapped up today for a gain on below average volume, rebounding for a close back above its latest pivot point. Consolidating in a tight range near all-time highs since a considerable gap up gain on 3/15/10 triggered a technical buy signal. Recently found support at its 50 DMA line, while prior chart lows in the $32 area are the next support level.
>>> The latest Featured Stock Update with an annotated graph appeared on 3/15/2010. click here.
|
|
C
A
S
I |
News |
Chart |
SEC
View all notes Alert
me of new notes
Company
Profile
|
ROVI
- NASDAQ
Rovi Corp
COMPUTER SOFTWARE & SERVICES - Security Software & Services
|
$37.52
|
+0.09
|
609,657
44% DAV
1,372,500
|
2/25/2010
(Date
Featured) |
$33.54
(Price
Featured) |
PP = $34.87 |
G |
| MB = $36.61 |
Most Recent Note - 3/22/2010 4:47:22 PM
G - Small gain today on light volume, consolidating in a very tight trading range near all-time highs. It remains extended from its latest base, while prior chart highs in the $34 area define an important support level to watch on pullbacks.
>>> The latest Featured Stock Update with an annotated graph appeared on 3/17/2010. click here.
|
|
C
A
S
I |
News |
Chart |
SEC
View all notes Alert
me of new notes
Company
Profile
|
SIRO
- NASDAQ
Sirona Dental Systems
HEALTH SERVICES - Medical Instruments & Supplies
|
$37.50
|
-0.22
|
492,435
85% DAV
579,700
|
2/16/2010
(Date
Featured) |
$36.43
(Price
Featured) |
PP = $36.15 |
Y |
| MB = $37.96 |
Most Recent Note - 3/22/2010 4:48:02 PM
Y - Small loss today on below average volume, perched very near its max buy level. Prior chart highs and its 50 DMA line in the $35-36 area define important support to watch.
>>> The latest Featured Stock Update with an annotated graph appeared on 3/9/2010. click here.
|
|
C
A
S
I |
News |
Chart |
SEC
View all notes Alert
me of new notes
Company
Profile
|
ULTA
- NASDAQ
Ulta Salon Cosm & Frag
SPECIALTY RETAIL - Specialty Retail, Other
|
$22.07
|
+0.37
|
339,615
86% DAV
395,700
|
3/12/2010
(Date
Featured) |
$22.81
(Price
Featured) |
PP = $21.72 |
Y |
| MB = $22.81 |
Most Recent Note - 3/22/2010 4:49:15 PM
Y - Small gain today on average volume, closing above its pivot point again. It found prompt support following a loss on 3/15/10 after an analyst downgrade. Prior chart highs in the $21 area now define a very important technical support level. A detailed Stock Bulletin with annotated graph was published soon after it was featured in the 3/12/10 mid-day report.
>>> The latest Featured Stock Update with an annotated graph appeared on 3/12/2010. click here.
|
|
C
A
S
I |
News |
Chart |
SEC
View all notes Alert
me of new notes
Company
Profile
|
VPRT
- NASDAQ
Vistaprint Nv
DIVERSIFIED SERVICES - Business/Management Services
|
$61.61
|
+1.61
|
370,003
79% DAV
467,200
|
3/1/2010
(Date
Featured) |
$57.72
(Price
Featured) |
PP = $59.70 |
Y |
| MB = $62.69 |
Most Recent Note - 3/22/2010 4:50:17 PM
Y - Gain today on below average volume, closing only -1.8% from its 3/09/10 all-time high. It did not trigger a technical buy signal since it was featured in the March 2010 CANSLIM.net News monthly newsletter (read here). As previously noted, "Its gain on 3/02/10 was below the volume guidelines for buyable breakouts under the investment system."
>>> The latest Featured Stock Update with an annotated graph appeared on 3/19/2010. click here.
|
|
C
A
S
I |
News |
Chart |
SEC
View all notes Alert
me of new notes
Company
Profile
|
|
|
|
THESE ARE NOT BUY RECOMMENDATIONS!
Comments contained in the body of this report are technical
opinions only. The material herein has been obtained
from sources believed to be reliable and accurate, however,
its accuracy and completeness cannot be guaranteed.
This site is not an investment advisor, hence it does
not endorse or recommend any securities or other investments.
Any recommendation contained in this report may not
be suitable for all investors and it is not to be deemed
an offer or solicitation on our part with respect to
the purchase or sale of any securities. All trademarks,
service marks and trade names appearing in this report
are the property of their respective owners, and are
likewise used for identification purposes only.
This report is a service available
only to active Paid Premium Members.
You may opt-out of receiving report notifications
at any time. Questions or comments may be submitted
by writing to Premium Membership Services 665 S.E. 10 Street, Suite 201 Deerfield Beach, FL 33441-5634 or by calling 1-800-965-8307
or 954-785-1121.
|
|
|


