Symbol/Exchange
Company Name
Industry Group |
PRICE |
CHANGE
(%Change) |
Day High |
Volume
(% DAV)
(% 50 day avg vol) |
52 Wk Hi
% From Hi |
Featured
Date |
Price
Featured |
Pivot Featured |
|
Max Buy |
BIDU
-
NASDAQ
Baidu Inc Ads
INTERNET - Internet Information Providers
|
$121.64
|
+1.08
0.90% |
$123.95
|
6,131,774
89.98% of 50 DAV
50 DAV is 6,814,900
|
$131.63
-7.59%
|
3/17/2011
|
$121.97
|
PP = $131.73
|
|
MB = $138.32
|
 Most Recent Note - 3/17/2011 3:47:26 PM
Y - Color code is changed to yellow with new pivot point cited based on its 52-week high plus 10 cents after consolidating for the past 5 weeks above support at its 50 DMA line. Volume-driven gains above its pivot point and a new rally with follow-through day from at least one of the major averages (M criteria) are necessary first in order to justify new (or add-on) buying efforts under the system's guidelines. Its recent chart low ($112.95 on 2/23/11) is the next important chart support to watch below its short-term average.
>>> The latest Featured Stock Update with an annotated graph appeared on 3/9/2011. Click here.
View all notes |
Alert me of new notes |
CANSLIM.net Company Profile |
SEC |
Zacks Reports |
StockTalk |
News |
Chart |
Request a new note
C
A N
S L
I M


|
CMG
-
NYSE
Chipotle Mexican Grill
LEISURE - Restaurants
|
$251.66
|
-6.56
-2.54% |
$263.00
|
1,003,042
93.49% of 50 DAV
50 DAV is 1,072,900
|
$275.00
-8.49%
|
2/11/2011
|
$271.15
|
PP = $262.87
|
|
MB = $276.01
|
Most Recent Note - 3/17/2011 3:49:40 PM
G - Perched -8% of its all-time high today. Reassuring signs of support have been noted while consolidating above its 50 DMA line and prior highs in the $237 area. Subsequent violations and damaging losses would raise greater concerns and trigger technical sell signals. See the latest FSU analysis for more details and a new annotated graph.
>>> The latest Featured Stock Update with an annotated graph appeared on 3/14/2011. Click here.
View all notes |
Alert me of new notes |
CANSLIM.net Company Profile |
SEC |
Zacks Reports |
StockTalk |
News |
Chart |
Request a new note
C
A N
S L
I M
|
CRUS
-
NASDAQ
Cirrus Logic Inc
ELECTRONICS - Semiconductor - Specialized
|
$20.45
|
+0.14
0.69% |
$21.14
|
2,372,213
61.37% of 50 DAV
50 DAV is 3,865,300
|
$25.48
-19.74%
|
1/28/2011
|
$20.69
|
PP = $19.17
|
|
MB = $20.13
|
Most Recent Note - 3/17/2011 11:24:02 AM
G - Up today, but still trading below its 50 DMA line, and the longer it lingers below that important short-term average the worse its outlook gets. Further deterioration under recent lows near $20 and more damaging losses would trigger more worrisome technical sell signals.
>>> The latest Featured Stock Update with an annotated graph appeared on 3/4/2011. Click here.
View all notes |
Alert me of new notes |
CANSLIM.net Company Profile |
SEC |
Zacks Reports |
StockTalk |
News |
Chart |
Request a new note
C
A N
S L
I M
|
CTSH
-
NASDAQ
Cognizant Tech Sol Cl A
COMPUTER SOFTWARE and SERVICES - Business Software and Services
|
$74.70
|
+1.77
2.43% |
$74.87
|
2,085,754
87.82% of 50 DAV
50 DAV is 2,375,100
|
$78.69
-5.07%
|
2/7/2011
|
$75.09
|
PP = $76.46
|
|
MB = $80.28
|
Most Recent Note - 3/17/2011 3:42:07 PM
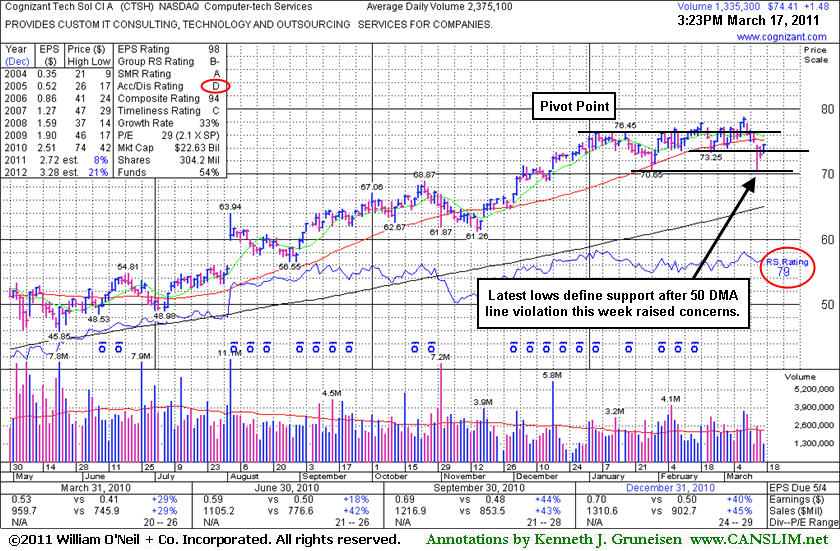
G - Halted its slide today after 3 consecutive losses violated its 50 DMA line and its previously noted chart low ($73.25 on 2/23/11). Color code was changed to green after the damaging technical violations. See the latest FSU analysis for more details and a new annotated graph.
>>> The latest Featured Stock Update with an annotated graph appeared on 3/17/2011. Click here.
View all notes |
Alert me of new notes |
CANSLIM.net Company Profile |
SEC |
Zacks Reports |
StockTalk |
News |
Chart |
Request a new note
C
A N
S L
I M
|
DECK
-
NASDAQ
Deckers Outdoor Corp
CONSUMER NON-DURABLES - Textile - Apparel Footwear
|
$79.51
|
-0.61
-0.76% |
$81.50
|
1,321,645
83.94% of 50 DAV
50 DAV is 1,574,500
|
$94.70
-16.04%
|
2/3/2011
|
$79.61
|
PP = $82.67
|
|
MB = $86.80
|
Most Recent Note - 3/16/2011 7:52:17 PM
G - Down again today with below average volume. Slumping further below its 50 DMA line raises greater concerns and hurts its technical outlook.
>>> The latest Featured Stock Update with an annotated graph appeared on 3/3/2011. Click here.
View all notes |
Alert me of new notes |
CANSLIM.net Company Profile |
SEC |
Zacks Reports |
StockTalk |
News |
Chart |
Request a new note
C
A N
S L
I M
|
Symbol/Exchange
Company Name
Industry Group |
PRICE |
CHANGE
(%Change) |
Day High |
Volume
(% DAV)
(% 50 day avg vol) |
52 Wk Hi
% From Hi |
Featured
Date |
Price
Featured |
Pivot Featured |
|
Max Buy |
EBIX
-
NASDAQ
Ebix Inc
COMPUTER SOFTWARE and SERVICES - Business Software and Services
|
$27.60
|
-0.14
-0.50% |
$28.38
|
464,643
76.06% of 50 DAV
50 DAV is 610,900
|
$29.61
-6.79%
|
2/28/2011
|
$25.70
|
PP = $25.97
|
|
MB = $27.27
|
Most Recent Note - 3/15/2011 4:23:30 PM
G - Overcame early weakness today and managed a positive reversal for a gain with above average volume. Wider than usual intra-day swings are a sign of uncertainty while distributional action recently raised concerns. Prior highs in the $25-26 area define important chart support to watch along with its 50 DMA line.
>>> The latest Featured Stock Update with an annotated graph appeared on 2/28/2011. Click here.
View all notes |
Alert me of new notes |
CANSLIM.net Company Profile |
SEC |
Zacks Reports |
StockTalk |
News |
Chart |
Request a new note
C
A N
S L
I M
|
EZCH
-
NASDAQ
Ezchip Semiconductor Ltd
ELECTRONICS - Semiconductor - Specialized
|
$27.78
|
+0.15
0.54% |
$28.30
|
344,723
84.68% of 50 DAV
50 DAV is 407,100
|
$33.48
-17.03%
|
12/2/2010
|
$27.53
|
PP = $26.00
|
|
MB = $27.30
|
Most Recent Note - 3/16/2011 7:43:42 PM
Slumped to a lower close today raising greater concerns after intra-day trading on the prior session below the neckline (at $27.00) of the previously noted head-and-shoulders pattern. Its rising 200 DMA line and earlier lows define the next support. Based on weakness it will be dropped from the Featured Stocks list tonight.
>>> The latest Featured Stock Update with an annotated graph appeared on 3/1/2011. Click here.
View all notes |
Alert me of new notes |
CANSLIM.net Company Profile |
SEC |
Zacks Reports |
StockTalk |
News |
Chart |
Request a new note
C
A N
S L
I M
|
EZPW
-
NASDAQ
Ezcorp Inc Cl A
SPECIALTY RETAIL - Specialty Retail, Other
|
$27.00
|
+0.09
0.33% |
$27.42
|
162,602
43.31% of 50 DAV
50 DAV is 375,400
|
$29.94
-9.82%
|
2/18/2011
|
$27.94
|
PP = $30.04
|
|
MB = $31.54
|
Most Recent Note - 3/16/2011 8:00:55 PM
G - Down today for a 6th consecutive loss without great volume conviction while slumping further below its 50 DMA line. The recent low ($25.56 on 1/25/11) defines the next important support level.
>>> The latest Featured Stock Update with an annotated graph appeared on 3/10/2011. Click here.
View all notes |
Alert me of new notes |
CANSLIM.net Company Profile |
SEC |
Zacks Reports |
StockTalk |
News |
Chart |
Request a new note
C
A N
S L
I M
|
FOSL
-
NASDAQ
Fossil Inc
CONSUMER DURABLES - Recreational Goods, Other
|
$81.04
|
-0.73
-0.89% |
$83.84
|
874,228
91.74% of 50 DAV
50 DAV is 952,900
|
$85.20
-4.88%
|
2/1/2011
|
$73.30
|
PP = $74.44
|
|
MB = $78.16
|
Most Recent Note - 3/15/2011 10:18:21 AM
G - Pulling back from its all-time high with today's 4th consecutive small loss following a spurt of volume-driven gains. It is still extended from its prior base. It found support at its 50 DMA line while consolidating above prior resistance in the $74 area.
>>> The latest Featured Stock Update with an annotated graph appeared on 2/24/2011. Click here.
View all notes |
Alert me of new notes |
CANSLIM.net Company Profile |
SEC |
Zacks Reports |
StockTalk |
News |
Chart |
Request a new note
C
A N
S L
I M
|
HMSY
-
NASDAQ
H M S Holdings Corp
COMPUTER SOFTWARE and SERVICES - Healthcare Information Service
|
$79.01
|
+0.23
0.29% |
$79.67
|
133,064
76.61% of 50 DAV
50 DAV is 173,700
|
$81.36
-2.89%
|
11/19/2010
|
$61.89
|
PP = $63.01
|
|
MB = $66.16
|
Most Recent Note - 3/15/2011 10:20:31 AM
G - Pulling back from its all-time high with today's 4th consecutive loss. It is extended from any sound base pattern. Support to watch is defined by prior chart highs and its 50 DMA line in the $67 area.
>>> The latest Featured Stock Update with an annotated graph appeared on 2/16/2011. Click here.
View all notes |
Alert me of new notes |
CANSLIM.net Company Profile |
SEC |
Zacks Reports |
StockTalk |
News |
Chart |
Request a new note
C
A N
S L
I M
|
Symbol/Exchange
Company Name
Industry Group |
PRICE |
CHANGE
(%Change) |
Day High |
Volume
(% DAV)
(% 50 day avg vol) |
52 Wk Hi
% From Hi |
Featured
Date |
Price
Featured |
Pivot Featured |
|
Max Buy |
JOBS
-
NASDAQ
Fifty One Job Inc Ads
DIVERSIFIED SERVICES - Staffing and; Outsourcing Service
|
$54.46
|
+1.44
2.72% |
$56.26
|
248,085
181.08% of 50 DAV
50 DAV is 137,000
|
$64.55
-15.63%
|
2/7/2011
|
$59.23
|
PP = $61.38
|
|
MB = $64.45
|
Most Recent Note - 3/16/2011 7:56:53 PM
Finished near the session low with an 8th loss in 9 sessions today. Slumping to a close further below its 50 DMA line after intra-day lows on the prior session violated a previously noted low ($52.58 on 1/28/11) raising concerns. Based on weak action it will be dropped from the Featured Stocks list tonight.
>>> The latest Featured Stock Update with an annotated graph appeared on 3/11/2011. Click here.
View all notes |
Alert me of new notes |
CANSLIM.net Company Profile |
SEC |
Zacks Reports |
StockTalk |
News |
Chart |
Request a new note
C
A N
S L
I M
|
LULU
-
NASDAQ
Lululemon Athletica
MANUFACTURING - Textile Manufacturing
|
$76.37
|
-2.98
-3.76% |
$80.77
|
7,881,979
389.10% of 50 DAV
50 DAV is 2,025,700
|
$85.28
-10.45%
|
1/26/2011
|
$68.11
|
PP = $74.70
|
|
MB = $78.44
|
Most Recent Note - 3/17/2011 11:20:45 AM
G - Down today with heavy volume after reporting earnings per share +60% on +53% revenues for the quarter ended January 31, 2011 versus the year ago period. Volume and volatility often increase near earnings news. It is again testing its 50 DMA line, a classic chart support level. As previously noted - "A close below a significant prior high close ($73.51 on 12/21/10) would completely negate its latest breakout, raising more serious concerns."
>>> The latest Featured Stock Update with an annotated graph appeared on 2/25/2011. Click here.
View all notes |
Alert me of new notes |
CANSLIM.net Company Profile |
SEC |
Zacks Reports |
StockTalk |
News |
Chart |
Request a new note
C
A N
S L
I M
|
MG
-
NYSE
Mistras Group Inc
DIVERSIFIED SERVICES - Bulding and Faci;ity Management Services
|
$16.32
|
+0.13
0.80% |
$16.51
|
73,149
74.87% of 50 DAV
50 DAV is 97,700
|
$16.60
-1.69%
|
3/15/2011
|
$15.48
|
PP = $15.90
|
|
MB = $16.70
|
Most Recent Note - 3/16/2011 1:38:52 PM
Y - Holding its ground today. It triggered a technical buy signal after noted in the 3/15/11 mid-day report - "Finding support at its 50 DMA line this week while still holding its ground stubbornly in a tight trading range since a considerable 'breakaway gap' on 1/12/11 for new highs. No resistance remains due to overhead supply. Color code is changed to yellow with pivot point cited based on its 52-week high plus 10 cents. Market conditions (M criteria) argue against new buying efforts until a new confirmed rally with follow-through day, meanwhile it is poised for a possible breakout. Recent quarterly comparisons showed solid sales and earnings increases versus the year earlier." See the FSU analysis for additional details and an annotated graph.
>>> The latest Featured Stock Update with an annotated graph appeared on 3/15/2011. Click here.
View all notes |
Alert me of new notes |
CANSLIM.net Company Profile |
SEC |
Zacks Reports |
StockTalk |
News |
Chart |
Request a new note
C
A N
S L
I M
|
MWIV
-
NASDAQ
M W I Veterinary Supply
HEALTH SERVICES - Medical Instruments and; Supplies
|
$74.63
|
+0.06
0.08% |
$75.99
|
26,813
29.69% of 50 DAV
50 DAV is 90,300
|
$78.48
-4.91%
|
11/4/2010
|
$61.79
|
PP = $59.60
|
|
MB = $62.58
|
Most Recent Note - 3/16/2011 8:03:31 PM
G - Today's 5th consecutive loss leaves its -5% off its all-time high, still extended from any sound base.
>>> The latest Featured Stock Update with an annotated graph appeared on 3/8/2011. Click here.
View all notes |
Alert me of new notes |
CANSLIM.net Company Profile |
SEC |
Zacks Reports |
StockTalk |
News |
Chart |
Request a new note
C
A N
S L
I M
|
OPEN
-
NASDAQ
Opentable Inc
INTERNET - Internet Software and Services
|
$90.33
|
+1.87
2.11% |
$91.14
|
951,020
83.35% of 50 DAV
50 DAV is 1,141,000
|
$95.97
-5.88%
|
3/17/2011
|
$90.71
|
PP = $96.07
|
|
MB = $100.87
|
Most Recent Note - 3/17/2011 11:31:02 AM
Y - Color code is changed to yellow after it has formed a sound new flat base pattern of sufficient length. Volume-driven gains above the new pivot point cited and a confirmed rally with follow-through day may eventually justify new (or add-on) buying efforts under the investment system guidelines. Important support to watch in the meanwhile is at its 50 DMA line and prior chart highs.
>>> The latest Featured Stock Update with an annotated graph appeared on 2/15/2011. Click here.
View all notes |
Alert me of new notes |
CANSLIM.net Company Profile |
SEC |
Zacks Reports |
StockTalk |
News |
Chart |
Request a new note
C
A N
S L
I M
|
Symbol/Exchange
Company Name
Industry Group |
PRICE |
CHANGE
(%Change) |
Day High |
Volume
(% DAV)
(% 50 day avg vol) |
52 Wk Hi
% From Hi |
Featured
Date |
Price
Featured |
Pivot Featured |
|
Max Buy |
ORCL
-
NASDAQ
Oracle Corp
COMPUTER SOFTWARE and SERVICES - Application Software
|
$30.55
|
+0.35
1.16% |
$31.05
|
31,492,517
124.06% of 50 DAV
50 DAV is 25,385,300
|
$33.71
-9.37%
|
1/20/2011
|
$32.31
|
PP = $32.37
|
|
MB = $33.99
|
Most Recent Note - 3/16/2011 7:50:39 PM
Down again today with heavier volume indicative of distributional pressure, slumping further below its 50 DMA line after violating the prior low previously noted ($30.80 on 1/10/11). Its Relative Strength rank (now 69) has fallen below the 80+ guideline required of proper buy candidates. It faces overhead supply up through $33 now after 3 months of trading at higher levels. Based on weak action it will be dropped from the Featured Stocks list tonight.
>>> The latest Featured Stock Update with an annotated graph appeared on 2/22/2011. Click here.
View all notes |
Alert me of new notes |
CANSLIM.net Company Profile |
SEC |
Zacks Reports |
StockTalk |
News |
Chart |
Request a new note
C
A N
S L
I M
|
PAY
-
NYSE
Verifone Systems Inc
COMPUTER HARDWARE - Transaction Automation Systems
|
$52.39
|
+0.14
0.27% |
$53.85
|
2,728,007
145.39% of 50 DAV
50 DAV is 1,876,400
|
$52.77
-0.72%
|
1/27/2011
|
$41.77
|
PP = $44.97
|
|
MB = $47.22
|
Most Recent Note - 3/16/2011 1:44:15 PM
G - Perched at its all-time high today after overcoming early weakness on the prior session and finishing strong. Repeatedly noted - "No resistance remains due to overhead supply, but it is extended from a sound base pattern. Its 50 DMA line defines chart support to watch."
>>> The latest Featured Stock Update with an annotated graph appeared on 3/2/2011. Click here.
View all notes |
Alert me of new notes |
CANSLIM.net Company Profile |
SEC |
Zacks Reports |
StockTalk |
News |
Chart |
Request a new note
C
A N
S L
I M
|
PCLN
-
NASDAQ
Priceline.Com Inc
INTERNET - Internet Software and Services
|
$452.19
|
-3.77
-0.83% |
$462.50
|
914,762
77.45% of 50 DAV
50 DAV is 1,181,100
|
$474.74
-4.75%
|
1/3/2011
|
$399.55
|
PP = $428.20
|
|
MB = $449.61
|
Most Recent Note - 3/15/2011 10:25:27 AM
G - Consolidating above support at its 50 DMA line, stubbornly holding its ground just -4.5% off its 52-week high. It has not built a sound base pattern recently.
>>> The latest Featured Stock Update with an annotated graph appeared on 2/14/2011. Click here.
View all notes |
Alert me of new notes |
CANSLIM.net Company Profile |
SEC |
Zacks Reports |
StockTalk |
News |
Chart |
Request a new note
C
A N
S L
I M
|
RAX
-
NYSE
Rackspace Hosting Inc
INTERNET - Internet Software and; Services
|
$36.41
|
+0.13
0.36% |
$37.69
|
1,429,264
75.90% of 50 DAV
50 DAV is 1,883,100
|
$40.62
-10.36%
|
3/16/2011
|
$36.28
|
PP = $40.72
|
|
MB = $42.76
|
Most Recent Note - 3/17/2011 11:33:10 AM
Y - Up today after testing prior highs near $35 and its 50 DMA line defining chart support to watch. Color code was changed to yellow with new pivot point cited after a new 5-week flat base pattern was identified. However, the negative market environment (M criteria) is an overriding concern for now arguing against new buying efforts until a rally with follow-through day occurs. See the latest FSU analysis for more details and a new annotated graph.
>>> The latest Featured Stock Update with an annotated graph appeared on 3/16/2011. Click here.
View all notes |
Alert me of new notes |
CANSLIM.net Company Profile |
SEC |
Zacks Reports |
StockTalk |
News |
Chart |
Request a new note
C
A N
S L
I M
|
TIBX
-
NASDAQ
Tibco Software Inc
COMPUTER SOFTWARE and SERVICES - Business Software and Services
|
$23.76
|
-0.02
-0.08% |
$24.39
|
1,384,953
54.82% of 50 DAV
50 DAV is 2,526,300
|
$25.94
-8.40%
|
2/1/2011
|
$24.35
|
PP = $22.18
|
|
MB = $23.29
|
Most Recent Note - 3/15/2011 10:30:13 AM
G - Down today, testing support at its 50 DMA line and matching its recent chart low ($22.87) earlier in the session. More damaging losses would raise concerns and trigger more worrisome technical sell signals.
>>> The latest Featured Stock Update with an annotated graph appeared on 2/10/2011. Click here.
View all notes |
Alert me of new notes |
CANSLIM.net Company Profile |
SEC |
Zacks Reports |
StockTalk |
News |
Chart |
Request a new note
C
A N
S L
I M
|
Symbol/Exchange
Company Name
Industry Group |
PRICE |
CHANGE
(%Change) |
Day High |
Volume
(% DAV)
(% 50 day avg vol) |
52 Wk Hi
% From Hi |
Featured
Date |
Price
Featured |
Pivot Featured |
|
Max Buy |
UA
-
NYSE
Under Armour Inc Cl A
CONSUMER NON-DURABLES - Textile - Apparel Clothing
|
$67.08
|
-0.06
-0.09% |
$68.34
|
412,683
53.75% of 50 DAV
50 DAV is 767,800
|
$70.69
-5.11%
|
1/27/2011
|
$58.31
|
PP = $56.99
|
|
MB = $59.84
|
Most Recent Note - 3/15/2011 10:32:22 AM
G -Gapped down today amid widespread market weakness. Its current consolidation has been healthy while forming a base-on-base type pattern.
>>> The latest Featured Stock Update with an annotated graph appeared on 3/7/2011. Click here.
View all notes |
Alert me of new notes |
CANSLIM.net Company Profile |
SEC |
Zacks Reports |
StockTalk |
News |
Chart |
Request a new note
C
A N
S L
I M
|
ULTA
-
NASDAQ
Ulta Salon Cosm & Frag
SPECIALTY RETAIL - Specialty Retail, Other
|
$46.42
|
+0.22
0.48% |
$47.48
|
545,192
88.78% of 50 DAV
50 DAV is 614,100
|
$47.93
-3.15%
|
1/6/2011
|
$36.12
|
PP = $37.34
|
|
MB = $39.21
|
Most Recent Note - 3/16/2011 7:58:51 PM
G - Pulling back from its all-time high today after a spurt of volume-driven gains. Its recent 4-week consolidation was too short to be considered a sound new base pattern. Support to watch is at its 50 DMA line and recent chart lows near the $40 level.
>>> The latest Featured Stock Update with an annotated graph appeared on 2/17/2011. Click here.
View all notes |
Alert me of new notes |
CANSLIM.net Company Profile |
SEC |
Zacks Reports |
StockTalk |
News |
Chart |
Request a new note
C
A N
S L
I M
|