You are not logged in.
This means you
CAN ONLY VIEW reports that were published prior to Monday, April 14, 2025.
You
MUST UPGRADE YOUR MEMBERSHIP if you want to see any current reports.
AFTER MARKET UPDATE - WEDNESDAY, MARCH 16TH, 2011
Previous After Market Report Next After Market Report >>>
|
|
|
|
DOW |
-242.12 |
11,613.30 |
-2.04% |
|
Volume |
1,461,005,710 |
+13% |
|
Volume |
2,549,384,420 |
+11% |
|
NASDAQ |
-50.51 |
2,616.82 |
-1.89% |
|
Advancers |
675 |
22% |
|
Advancers |
727 |
27% |
|
S&P 500 |
-24.99 |
1,256.88 |
-1.95% |
|
Decliners |
2,380 |
76% |
|
Decliners |
1,920 |
70% |
|
Russell 2000 |
-9.43 |
781.90 |
-1.19% |
|
52 Wk Highs |
31 |
|
|
52 Wk Highs |
31 |
|
|
S&P 600 |
-5.19 |
415.25 |
-1.23% |
|
52 Wk Lows |
38 |
|
|
52 Wk Lows |
74 |
|
|
Since last Thursday's market commentary headline announced "Market Dives Into Correction Prompting Investors To Raise Cash" the major averages have fallen another -3% while many individual issues have been hit even harder. Keep in mind that corrections are normal during a Bull Market, and while the recent action has prompted investors to take a more cautious stance for now, the next confirmed rally with a follow-through day (FTD) could always be as near as just 4 days away. This is an important time to remain focused on the market's strongest leaders (stocks staying within -10% of their 52-week highs) and to be maintaining a watchlist so you will be ready for whenever the rally may eventually resume.
If you have any questions about our services or the investment system we support that you would like to have answered, please submit them (click here). We look forward to the opportunity to clarify any matters we can for you in the upcoming Q1 2011 Webcast which is scheduled for March 30th at 8PM EST. Despite the current headlines, we are optimistic that 2011 and 2012 are still going to offer a lot of great winners for investors who are patient and selective. In the meanwhile, don't fight the tape! Always limit losses at -7% to preserve your precious investment capital.
|
 |
Major Averages Endure Heavier Distributional Pressure
Kenneth J. Gruneisen - Passed the CAN SLIM® Master's Exam
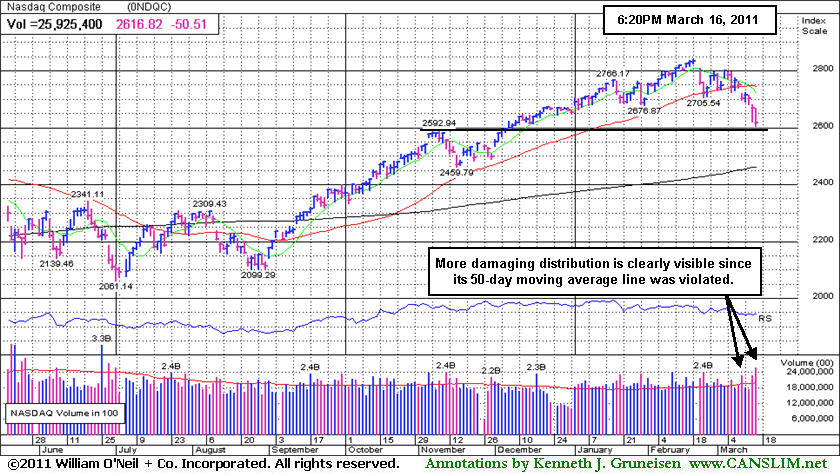
The small-cap indexes fared better than their big-cap peers on Wednesday while the major averages sank deeper into their latest correction. Higher volume totals were reported again on the NYSE and on the Nasdaq exchange versus the prior session's totals, a clear sign of more intense distributional selling pressure from the institutional crowd. Declining issues beat advancers by more than 3-1 on the NYSE and by 8-3 on the Nasdaq exchange. New 52-week lows outnumbered new 52-week highs on the Nasdaq exchange and on the NYSE. There were 16 high-ranked companies from the CANSLIM.net Leaders List that made new 52-week highs and appeared on the CANSLIM.net BreakOuts Page, up from a total of 13 on the prior session. On the Featured Stocks Page there were gains from only 5 of the 22 high-ranked market leaders currently listed.
Economic reports were no help for stocks. U.S. housing starts decreased more than forecast in February to the lowest level since April 2009. Attention remained focused on Japan, and a sharp sell-off came as the European Union energy chief warned that Japan's nuclear crisis could turn catastrophic. The U.S. government recommended Americans within 50 miles of the broken nuclear reactors evacuate or stay indoors to avoid fallout. Increasing violence in Saudi Arabia's neighbor Bahrain contributed investors' concerns.
International Business Machines Corp (IBM -3.8%) was the weakest Dow component, falling after an analyst downgrade. Meanwhile, coal companies profited on prospects for increased demand including Peabody Energy (BTU +3.9%), which was mentioned in Monday evening's commentary (read here).
Treasuries yields dropped to their lowest of the year as investors bought US Treasuries as a "safe-haven" investment, the 10-year Treasury note was up 25/32 to yield 3.21%. The S&P 500 Index fell to its worst level of the year before a very mild rebound in the final hour, and it has slumped into negative territory for the year.
More damaging distributional action has the potential to lead to a much more substantial correction for the major averages (bad M criteria). During a correction investors should raise their cash levels and reduce stock market exposure. New buying efforts should be avoided until a new rally with a follow-through day (FTD) provides a fresh confirmation that buying demand from the institutional crowd is returning again. Even after a FTD, marked by an expansion in volume and stocks hitting new highs with higher volume, buying efforts should only be cautiously and carefully made when all of the investment system's key criteria are met.
PICTURED: Another volatile day pushed the Nasdaq Composite Index also into negative territory for the year.
|
 Kenneth J. Gruneisen started out as a licensed stockbroker in August 1987, a couple of months prior to the historic stock market crash that took the Dow Jones Industrial Average down -22.6% in a single day. He has published daily fact-based fundamental and technical analysis on high-ranked stocks online for two decades. Through FACTBASEDINVESTING.COM, Kenneth provides educational articles, news, market commentary, and other information regarding proven investment systems that work in good times and bad.
Comments contained in the body of this report are technical opinions only and are not necessarily those of Gruneisen Growth Corp. The material herein has been obtained from sources believed to be reliable and accurate, however, its accuracy and completeness cannot be guaranteed. Our firm, employees, and customers may effect transactions, including transactions contrary to any recommendation herein, or have positions in the securities mentioned herein or options with respect thereto. Any recommendation contained in this report may not be suitable for all investors and it is not to be deemed an offer or solicitation on our part with respect to the purchase or sale of any securities. |
|
 |
Financial, Tech, Retail, Energy, and Defensive Groups Collectively Falling
Kenneth J. Gruneisen - Passed the CAN SLIM® Master's Exam
Defensive groups provided no reward for investors as the Gold & Silver Index ($XAU -2.27%) and Healthcare Index ($HMO -1.85%) retreated amid widespread weakness on Wednesday. Energy-related stocks also fell and the Oil Services Index ($OSX -2.51%) and Integrated Oil Index ($XOI -1.79%) both fell. There were unanimous losses for the tech sector indexes as the Semiconductor Index ($SOX -2.22%), Internet Index ($IIX -1.89%), Biotechnology Index ($BTK -1.50%), and Networking Index ($NWX -1.45%) fell. The Retail Index ($RLX -1.16%) and influential financial shares also tumbled further as the Broker/Dealer Index ($XBD -1.85%) and Bank Index ($BKX -1.63%) continued sinking deeper below their respective 50-day moving average (DMA) lines.
Charts courtesy www.stockcharts.com
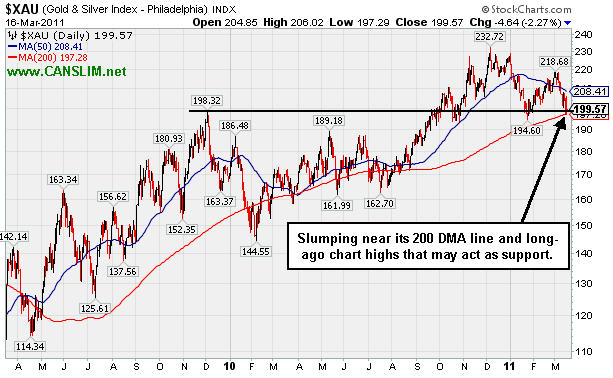
PICTURED: The 2-year chart of the Gold & Silver Index ($XAU -2.27%) shows it slumping near its 200-day moving average line and long-ago chart highs that may act as support.
| Oil Services |
$OSX |
269.13 |
-6.93 |
-2.51% |
+9.80% |
| Healthcare |
$HMO |
1,990.78 |
-37.45 |
-1.85% |
+17.66% |
| Integrated Oil |
$XOI |
1,275.16 |
-23.30 |
-1.79% |
+5.11% |
| Semiconductor |
$SOX |
412.44 |
-9.35 |
-2.22% |
+0.15% |
| Networking |
$NWX |
312.27 |
-4.60 |
-1.45% |
+11.30% |
| Internet |
$IIX |
301.35 |
-5.82 |
-1.89% |
-2.07% |
| Broker/Dealer |
$XBD |
115.35 |
-2.18 |
-1.85% |
-5.07% |
| Retail |
$RLX |
494.83 |
-5.80 |
-1.16% |
-2.67% |
| Gold & Silver |
$XAU |
199.57 |
-4.64 |
-2.27% |
-11.92% |
| Bank |
$BKX |
50.82 |
-0.84 |
-1.63% |
-2.66% |
| Biotech |
$BTK |
1,248.75 |
-19.02 |
-1.50% |
-3.77% |
|
|
|
 |
New Flat Base Formed; Worst Concern Is Difficult Market Environment
Kenneth J. Gruneisen - Passed the CAN SLIM® Master's Exam
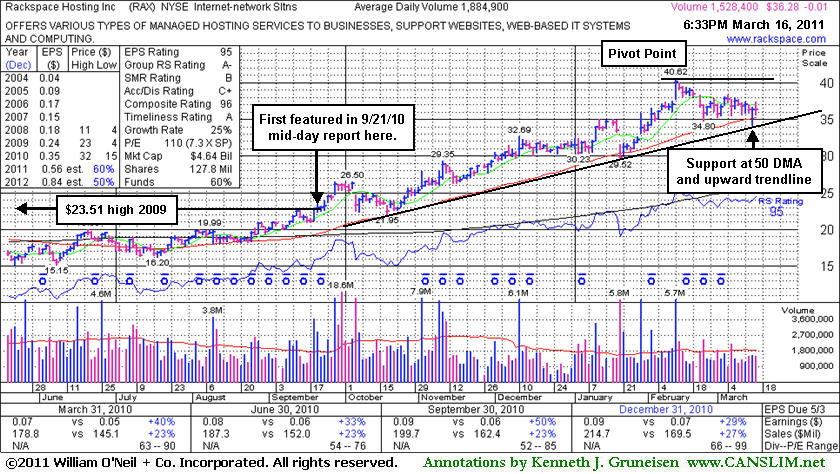
Rackspace Hosting Inc (RAX -$0.01 or -0.03% to $36.28) is consolidating above its 50-day moving average line amid widespread market weakness. Its upward trendline connecting its past October, January and March lows defines another technical support level to watch where violations may raise concerns and trigger technical sell signals. It has recently been noted while testing and its 50-day moving average (DMA) line defining chart support to watch closely coinciding with prior highs near $35. Since its last appearance in this FSU section on 2/09/11 under the headline "Weekly Graph Shows Stock Extended From Sound Base" it has been building a new base. As previously explained, it broke out on 1/11/11, triggering a new (or add-on) buy signal, however a damaging gap down on 1/20/11 likely forced disciplined investors to limit losses (per the sell rules at -7% from your purchase price) on any recent purchases.
Perched -10.7% below its all-time high now, some resistance remains due to recent overhead supply. Keep in mind that the M criteria of the fact-based investment system argues against new buying efforts until a new confirmed rally with a follow-through day from at least one of the major averages occurs. Meanwhile, it should remain on investors' watchlists as an ideal candidate for future consideration if it breaks out again with great volume conviction over the new pivot point being cited. It has traded up as much as +77.8% since first featured in yellow in the 9/21/10 mid-day report (read here) when noted - "Trading pennies from its 52-week high, with no overhead supply remaining to hinder its progress. A solid gain on the prior session reconfirmed a recent technical breakout above prior chart highs. Subsequent gains into new high territory with volume conviction could signal the beginning of a meaningful price advance."
This high-ranked Internet-Networking Solutions firm has earned very high ranks, and the past 4 quarterly earnings comparisons showed better than +25% increases. Its annual earnings history (A criteria) since trading began in 2008 has been good. Increasing institutional ownership (I criteria) is a reassuring sign, as the number of top-rated funds owning its shares rose from 317 in Mar '10 to 437 in Dec '10.
|
|
|
Color Codes Explained :
Y - Better candidates highlighted by our
staff of experts.
G - Previously featured
in past reports as yellow but may no longer be buyable under the
guidelines.
***Last / Change / Volume data in this table is the closing quote data***
Symbol/Exchange
Company Name
Industry Group |
PRICE |
CHANGE
(%Change) |
Day High |
Volume
(% DAV)
(% 50 day avg vol) |
52 Wk Hi
% From Hi |
Featured
Date |
Price
Featured |
Pivot Featured |
|
Max Buy |
BIDU
-
NASDAQ
Baidu Inc Ads
INTERNET - Internet Information Providers
|
$120.56
|
-1.67
-1.37% |
$125.09
|
8,217,732
120.96% of 50 DAV
50 DAV is 6,793,700
|
$131.63
-8.41%
|
2/1/2011
|
$117.74
|
PP = $112.08
|
|
MB = $117.68
|
Most Recent Note - 3/15/2011 10:14:03 AM
G - Gapped down today, slumping toward its 50 DMA line. Its recent chart low ($112.95 on 2/23/11) is the next important chart support to watch below its short-term average.
>>> The latest Featured Stock Update with an annotated graph appeared on 3/9/2011. Click here.
View all notes |
Alert me of new notes |
CANSLIM.net Company Profile |
SEC |
Zacks Reports |
StockTalk |
News |
Chart |
Request a new note
C
A N
S L
I M


|
CMG
-
NYSE
Chipotle Mexican Grill
LEISURE - Restaurants
|
$258.22
|
+0.22
0.09% |
$264.10
|
1,284,471
119.88% of 50 DAV
50 DAV is 1,071,500
|
$275.00
-6.10%
|
2/11/2011
|
$271.15
|
PP = $262.87
|
|
MB = $276.01
|
Most Recent Note - 3/14/2011 8:42:27 PM
G - Positive reversal today was a reassuring sign while consolidating above support at its 50 DMA line and prior highs in the $237 area. Violations and damaging losses would raise greater concerns and trigger technical sell signals. See the latest FSU analysis for more details and a new annotated graph.
>>> The latest Featured Stock Update with an annotated graph appeared on 3/14/2011. Click here.
View all notes |
Alert me of new notes |
CANSLIM.net Company Profile |
SEC |
Zacks Reports |
StockTalk |
News |
Chart |
Request a new note
C
A N
S L
I M
|
CRUS
-
NASDAQ
Cirrus Logic Inc
ELECTRONICS - Semiconductor - Specialized
|
$20.31
|
-0.73
-3.47% |
$21.79
|
4,089,413
106.89% of 50 DAV
50 DAV is 3,825,900
|
$25.48
-20.29%
|
1/28/2011
|
$20.69
|
PP = $19.17
|
|
MB = $20.13
|
 Most Recent Note - 3/16/2011 7:38:51 PM
G - Closed near session low and further below its 50 DMA line after erasing early gains today. Finished near recent lows and just under the previously noted high close ($20.54 on 7/26/10). More damaging losses would raise serious concerns and trigger more worrisome technical sell signals.
>>> The latest Featured Stock Update with an annotated graph appeared on 3/4/2011. Click here.
View all notes |
Alert me of new notes |
CANSLIM.net Company Profile |
SEC |
Zacks Reports |
StockTalk |
News |
Chart |
Request a new note
C
A N
S L
I M
|
CTSH
-
NASDAQ
Cognizant Tech Sol Cl A
COMPUTER SOFTWARE and SERVICES - Business Software and Services
|
$72.93
|
-1.07
-1.45% |
$74.22
|
2,330,632
97.65% of 50 DAV
50 DAV is 2,386,600
|
$78.69
-7.32%
|
2/7/2011
|
$75.09
|
PP = $76.46
|
|
MB = $80.28
|
Most Recent Note - 3/16/2011 8:07:27 PM
G - Down today for a 3rd consecutive loss, violating its 50 DMA line and its previously noted chart low ($73.25 on 2/23/11) with losses this week. Color code is changed to green after the damaging technical violations.
>>> The latest Featured Stock Update with an annotated graph appeared on 2/8/2011. Click here.
View all notes |
Alert me of new notes |
CANSLIM.net Company Profile |
SEC |
Zacks Reports |
StockTalk |
News |
Chart |
Request a new note
C
A N
S L
I M
|
DECK
-
NASDAQ
Deckers Outdoor Corp
CONSUMER NON-DURABLES - Textile - Apparel Footwear
|
$80.12
|
-1.09
-1.34% |
$82.50
|
1,313,205
82.38% of 50 DAV
50 DAV is 1,594,100
|
$94.70
-15.40%
|
2/3/2011
|
$79.61
|
PP = $82.67
|
|
MB = $86.80
|
Most Recent Note - 3/16/2011 7:52:17 PM
G - Down again today with below average volume. Slumping further below its 50 DMA line raises greater concerns and hurts its technical outlook.
>>> The latest Featured Stock Update with an annotated graph appeared on 3/3/2011. Click here.
View all notes |
Alert me of new notes |
CANSLIM.net Company Profile |
SEC |
Zacks Reports |
StockTalk |
News |
Chart |
Request a new note
C
A N
S L
I M
|
Symbol/Exchange
Company Name
Industry Group |
PRICE |
CHANGE
(%Change) |
Day High |
Volume
(% DAV)
(% 50 day avg vol) |
52 Wk Hi
% From Hi |
Featured
Date |
Price
Featured |
Pivot Featured |
|
Max Buy |
EBIX
-
NASDAQ
Ebix Inc
COMPUTER SOFTWARE and SERVICES - Business Software and Services
|
$27.74
|
-0.24
-0.86% |
$28.59
|
648,370
106.99% of 50 DAV
50 DAV is 606,000
|
$29.61
-6.32%
|
2/28/2011
|
$25.70
|
PP = $25.97
|
|
MB = $27.27
|
Most Recent Note - 3/15/2011 4:23:30 PM
G - Overcame early weakness today and managed a positive reversal for a gain with above average volume. Wider than usual intra-day swings are a sign of uncertainty while distributional action recently raised concerns. Prior highs in the $25-26 area define important chart support to watch along with its 50 DMA line.
>>> The latest Featured Stock Update with an annotated graph appeared on 2/28/2011. Click here.
View all notes |
Alert me of new notes |
CANSLIM.net Company Profile |
SEC |
Zacks Reports |
StockTalk |
News |
Chart |
Request a new note
C
A N
S L
I M
|
EZCH
-
NASDAQ
Ezchip Semiconductor Ltd
ELECTRONICS - Semiconductor - Specialized
|
$27.63
|
-0.58
-2.06% |
$28.77
|
428,267
105.17% of 50 DAV
50 DAV is 407,200
|
$33.48
-17.47%
|
12/2/2010
|
$27.53
|
PP = $26.00
|
|
MB = $27.30
|
Most Recent Note - 3/16/2011 7:43:42 PM
Slumped to a lower close today raising greater concerns after intra-day trading on the prior session below the neckline (at $27.00) of the previously noted head-and-shoulders pattern. Its rising 200 DMA line and earlier lows define the next support. Based on weakness it will be dropped from the Featured Stocks list tonight.
>>> The latest Featured Stock Update with an annotated graph appeared on 3/1/2011. Click here.
View all notes |
Alert me of new notes |
CANSLIM.net Company Profile |
SEC |
Zacks Reports |
StockTalk |
News |
Chart |
Request a new note
C
A N
S L
I M
|
EZPW
-
NASDAQ
Ezcorp Inc Cl A
SPECIALTY RETAIL - Specialty Retail, Other
|
$26.91
|
-0.46
-1.68% |
$27.45
|
261,321
68.90% of 50 DAV
50 DAV is 379,300
|
$29.94
-10.12%
|
2/18/2011
|
$27.94
|
PP = $30.04
|
|
MB = $31.54
|
Most Recent Note - 3/16/2011 8:00:55 PM
G - Down today for a 6th consecutive loss without great volume conviction while slumping further below its 50 DMA line. The recent low ($25.56 on 1/25/11) defines the next important support level.
>>> The latest Featured Stock Update with an annotated graph appeared on 3/10/2011. Click here.
View all notes |
Alert me of new notes |
CANSLIM.net Company Profile |
SEC |
Zacks Reports |
StockTalk |
News |
Chart |
Request a new note
C
A N
S L
I M
|
FOSL
-
NASDAQ
Fossil Inc
CONSUMER DURABLES - Recreational Goods, Other
|
$81.77
|
-0.78
-0.94% |
$85.01
|
1,064,223
112.78% of 50 DAV
50 DAV is 943,600
|
$85.20
-4.03%
|
2/1/2011
|
$73.30
|
PP = $74.44
|
|
MB = $78.16
|
Most Recent Note - 3/15/2011 10:18:21 AM
G - Pulling back from its all-time high with today's 4th consecutive small loss following a spurt of volume-driven gains. It is still extended from its prior base. It found support at its 50 DMA line while consolidating above prior resistance in the $74 area.
>>> The latest Featured Stock Update with an annotated graph appeared on 2/24/2011. Click here.
View all notes |
Alert me of new notes |
CANSLIM.net Company Profile |
SEC |
Zacks Reports |
StockTalk |
News |
Chart |
Request a new note
C
A N
S L
I M
|
HMSY
-
NASDAQ
H M S Holdings Corp
COMPUTER SOFTWARE and SERVICES - Healthcare Information Service
|
$78.78
|
+0.50
0.64% |
$79.89
|
187,717
108.51% of 50 DAV
50 DAV is 173,000
|
$81.36
-3.17%
|
11/19/2010
|
$61.89
|
PP = $63.01
|
|
MB = $66.16
|
Most Recent Note - 3/15/2011 10:20:31 AM
G - Pulling back from its all-time high with today's 4th consecutive loss. It is extended from any sound base pattern. Support to watch is defined by prior chart highs and its 50 DMA line in the $67 area.
>>> The latest Featured Stock Update with an annotated graph appeared on 2/16/2011. Click here.
View all notes |
Alert me of new notes |
CANSLIM.net Company Profile |
SEC |
Zacks Reports |
StockTalk |
News |
Chart |
Request a new note
C
A N
S L
I M
|
Symbol/Exchange
Company Name
Industry Group |
PRICE |
CHANGE
(%Change) |
Day High |
Volume
(% DAV)
(% 50 day avg vol) |
52 Wk Hi
% From Hi |
Featured
Date |
Price
Featured |
Pivot Featured |
|
Max Buy |
JOBS
-
NASDAQ
Fifty One Job Inc Ads
DIVERSIFIED SERVICES - Staffing and; Outsourcing Service
|
$53.02
|
-1.09
-2.01% |
$56.53
|
123,093
90.05% of 50 DAV
50 DAV is 136,700
|
$64.55
-17.86%
|
2/7/2011
|
$59.23
|
PP = $61.38
|
|
MB = $64.45
|
Most Recent Note - 3/16/2011 7:56:53 PM
Finished near the session low with an 8th loss in 9 sessions today. Slumping to a close further below its 50 DMA line after intra-day lows on the prior session violated a previously noted low ($52.58 on 1/28/11) raising concerns. Based on weak action it will be dropped from the Featured Stocks list tonight.
>>> The latest Featured Stock Update with an annotated graph appeared on 3/11/2011. Click here.
View all notes |
Alert me of new notes |
CANSLIM.net Company Profile |
SEC |
Zacks Reports |
StockTalk |
News |
Chart |
Request a new note
C
A N
S L
I M
|
LULU
-
NASDAQ
Lululemon Athletica
MANUFACTURING - Textile Manufacturing
|
$79.35
|
+0.22
0.28% |
$81.32
|
2,986,173
148.46% of 50 DAV
50 DAV is 2,011,400
|
$85.28
-6.95%
|
1/26/2011
|
$68.11
|
PP = $74.70
|
|
MB = $78.44
|
Most Recent Note - 3/15/2011 4:36:18 PM
G - Overcame early weakness after a gap down today, rallying for a positive reversal and closing near the session high. Color code is changed to green after rising back above its "max buy" level. During its recent consolidation it made a stand at its 50 DMA line, a classic chart support level. As previously noted - "A close below a significant prior high close ($73.51 on 12/21/10) would completely negate its latest breakout, raising more serious concerns."
>>> The latest Featured Stock Update with an annotated graph appeared on 2/25/2011. Click here.
View all notes |
Alert me of new notes |
CANSLIM.net Company Profile |
SEC |
Zacks Reports |
StockTalk |
News |
Chart |
Request a new note
C
A N
S L
I M
|
MG
-
NYSE
Mistras Group Inc
DIVERSIFIED SERVICES - Bulding and Faci;ity Management Services
|
$16.19
|
-0.12
-0.74% |
$16.60
|
183,167
192.60% of 50 DAV
50 DAV is 95,100
|
$16.46
-1.64%
|
3/15/2011
|
$15.48
|
PP = $15.90
|
|
MB = $16.70
|
Most Recent Note - 3/16/2011 1:38:52 PM
Y - Holding its ground today. It triggered a technical buy signal after noted in the 3/15/11 mid-day report - "Finding support at its 50 DMA line this week while still holding its ground stubbornly in a tight trading range since a considerable 'breakaway gap' on 1/12/11 for new highs. No resistance remains due to overhead supply. Color code is changed to yellow with pivot point cited based on its 52-week high plus 10 cents. Market conditions (M criteria) argue against new buying efforts until a new confirmed rally with follow-through day, meanwhile it is poised for a possible breakout. Recent quarterly comparisons showed solid sales and earnings increases versus the year earlier." See the FSU analysis for additional details and an annotated graph.
>>> The latest Featured Stock Update with an annotated graph appeared on 3/15/2011. Click here.
View all notes |
Alert me of new notes |
CANSLIM.net Company Profile |
SEC |
Zacks Reports |
StockTalk |
News |
Chart |
Request a new note
C
A N
S L
I M
|
MWIV
-
NASDAQ
M W I Veterinary Supply
HEALTH SERVICES - Medical Instruments and; Supplies
|
$74.57
|
-1.06
-1.40% |
$76.07
|
58,963
65.66% of 50 DAV
50 DAV is 89,800
|
$78.48
-4.98%
|
11/4/2010
|
$61.79
|
PP = $59.60
|
|
MB = $62.58
|
Most Recent Note - 3/16/2011 8:03:31 PM
G - Today's 5th consecutive loss leaves its -5% off its all-time high, still extended from any sound base.
>>> The latest Featured Stock Update with an annotated graph appeared on 3/8/2011. Click here.
View all notes |
Alert me of new notes |
CANSLIM.net Company Profile |
SEC |
Zacks Reports |
StockTalk |
News |
Chart |
Request a new note
C
A N
S L
I M
|
OPEN
-
NASDAQ
Opentable Inc
INTERNET - Internet Software and Services
|
$88.46
|
+0.44
0.50% |
$91.63
|
1,012,218
89.47% of 50 DAV
50 DAV is 1,131,400
|
$95.97
-7.83%
|
1/5/2011
|
$74.05
|
PP = $76.79
|
|
MB = $80.63
|
Most Recent Note - 3/14/2011 1:27:31 PM
G - Gapped down today after closing the prior week higher despite broader market weakness. Current consolidation of just over 4 weeks has the look of a bullish base-on-base type pattern forming. Support to watch is at its 50 DMA line and prior chart highs.
>>> The latest Featured Stock Update with an annotated graph appeared on 2/15/2011. Click here.
View all notes |
Alert me of new notes |
CANSLIM.net Company Profile |
SEC |
Zacks Reports |
StockTalk |
News |
Chart |
Request a new note
C
A N
S L
I M
|
Symbol/Exchange
Company Name
Industry Group |
PRICE |
CHANGE
(%Change) |
Day High |
Volume
(% DAV)
(% 50 day avg vol) |
52 Wk Hi
% From Hi |
Featured
Date |
Price
Featured |
Pivot Featured |
|
Max Buy |
ORCL
-
NASDAQ
Oracle Corp
COMPUTER SOFTWARE and SERVICES - Application Software
|
$30.20
|
-0.97
-3.11% |
$31.06
|
45,026,258
180.80% of 50 DAV
50 DAV is 24,904,200
|
$33.71
-10.41%
|
1/20/2011
|
$32.31
|
PP = $32.37
|
|
MB = $33.99
|
Most Recent Note - 3/16/2011 7:50:39 PM
Down again today with heavier volume indicative of distributional pressure, slumping further below its 50 DMA line after violating the prior low previously noted ($30.80 on 1/10/11). Its Relative Strength rank (now 69) has fallen below the 80+ guideline required of proper buy candidates. It faces overhead supply up through $33 now after 3 months of trading at higher levels. Based on weak action it will be dropped from the Featured Stocks list tonight.
>>> The latest Featured Stock Update with an annotated graph appeared on 2/22/2011. Click here.
View all notes |
Alert me of new notes |
CANSLIM.net Company Profile |
SEC |
Zacks Reports |
StockTalk |
News |
Chart |
Request a new note
C
A N
S L
I M
|
PAY
-
NYSE
Verifone Systems Inc
COMPUTER HARDWARE - Transaction Automation Systems
|
$52.25
|
+0.79
1.54% |
$52.77
|
2,982,962
161.70% of 50 DAV
50 DAV is 1,844,700
|
$52.49
-0.46%
|
1/27/2011
|
$41.77
|
PP = $44.97
|
|
MB = $47.22
|
Most Recent Note - 3/16/2011 1:44:15 PM
G - Perched at its all-time high today after overcoming early weakness on the prior session and finishing strong. Repeatedly noted - "No resistance remains due to overhead supply, but it is extended from a sound base pattern. Its 50 DMA line defines chart support to watch."
>>> The latest Featured Stock Update with an annotated graph appeared on 3/2/2011. Click here.
View all notes |
Alert me of new notes |
CANSLIM.net Company Profile |
SEC |
Zacks Reports |
StockTalk |
News |
Chart |
Request a new note
C
A N
S L
I M
|
PCLN
-
NASDAQ
Priceline.Com Inc
INTERNET - Internet Software and Services
|
$455.96
|
-5.38
-1.17% |
$466.53
|
1,317,801
111.56% of 50 DAV
50 DAV is 1,181,200
|
$474.74
-3.96%
|
1/3/2011
|
$399.55
|
PP = $428.20
|
|
MB = $449.61
|
Most Recent Note - 3/15/2011 10:25:27 AM
G - Consolidating above support at its 50 DMA line, stubbornly holding its ground just -4.5% off its 52-week high. It has not built a sound base pattern recently.
>>> The latest Featured Stock Update with an annotated graph appeared on 2/14/2011. Click here.
View all notes |
Alert me of new notes |
CANSLIM.net Company Profile |
SEC |
Zacks Reports |
StockTalk |
News |
Chart |
Request a new note
C
A N
S L
I M
|
RAX
-
NYSE
Rackspace Hosting Inc
INTERNET - Internet Software and; Services
|
$36.28
|
-0.01
-0.03% |
$37.41
|
1,534,410
81.41% of 50 DAV
50 DAV is 1,884,900
|
$40.62
-10.68%
|
3/16/2011
|
$36.28
|
PP = $40.72
|
|
MB = $42.76
|
Most Recent Note - 3/16/2011 7:55:36 PM
Y - Color code is changed to yellow with new pivot point cited after a 5-week flat base pattern. However, the negative market environment (M criteria) is an overriding concern for now arguing against new buying efforts until a rally with follow-through day occurs. Currently testing prior highs near $35 and its 50 DMA line defining chart support to watch. See the latest FSU analysis for more details and a new annotated graph.
>>> The latest Featured Stock Update with an annotated graph appeared on 3/16/2011. Click here.
View all notes |
Alert me of new notes |
CANSLIM.net Company Profile |
SEC |
Zacks Reports |
StockTalk |
News |
Chart |
Request a new note
C
A N
S L
I M
|
TIBX
-
NASDAQ
Tibco Software Inc
COMPUTER SOFTWARE and SERVICES - Business Software and Services
|
$23.78
|
-0.16
-0.67% |
$24.52
|
3,089,248
123.22% of 50 DAV
50 DAV is 2,507,000
|
$25.94
-8.33%
|
2/1/2011
|
$24.35
|
PP = $22.18
|
|
MB = $23.29
|
Most Recent Note - 3/15/2011 10:30:13 AM
G - Down today, testing support at its 50 DMA line and matching its recent chart low ($22.87) earlier in the session. More damaging losses would raise concerns and trigger more worrisome technical sell signals.
>>> The latest Featured Stock Update with an annotated graph appeared on 2/10/2011. Click here.
View all notes |
Alert me of new notes |
CANSLIM.net Company Profile |
SEC |
Zacks Reports |
StockTalk |
News |
Chart |
Request a new note
C
A N
S L
I M
|
Symbol/Exchange
Company Name
Industry Group |
PRICE |
CHANGE
(%Change) |
Day High |
Volume
(% DAV)
(% 50 day avg vol) |
52 Wk Hi
% From Hi |
Featured
Date |
Price
Featured |
Pivot Featured |
|
Max Buy |
UA
-
NYSE
Under Armour Inc Cl A
CONSUMER NON-DURABLES - Textile - Apparel Clothing
|
$67.14
|
-0.38
-0.56% |
$68.73
|
554,770
71.68% of 50 DAV
50 DAV is 773,900
|
$70.69
-5.02%
|
1/27/2011
|
$58.31
|
PP = $56.99
|
|
MB = $59.84
|
Most Recent Note - 3/15/2011 10:32:22 AM
G -Gapped down today amid widespread market weakness. Its current consolidation has been healthy while forming a base-on-base type pattern.
>>> The latest Featured Stock Update with an annotated graph appeared on 3/7/2011. Click here.
View all notes |
Alert me of new notes |
CANSLIM.net Company Profile |
SEC |
Zacks Reports |
StockTalk |
News |
Chart |
Request a new note
C
A N
S L
I M
|
ULTA
-
NASDAQ
Ulta Salon Cosm & Frag
SPECIALTY RETAIL - Specialty Retail, Other
|
$46.20
|
-0.99
-2.10% |
$47.93
|
978,050
162.36% of 50 DAV
50 DAV is 602,400
|
$47.85
-3.45%
|
1/6/2011
|
$36.12
|
PP = $37.34
|
|
MB = $39.21
|
Most Recent Note - 3/16/2011 7:58:51 PM
G - Pulling back from its all-time high today after a spurt of volume-driven gains. Its recent 4-week consolidation was too short to be considered a sound new base pattern. Support to watch is at its 50 DMA line and recent chart lows near the $40 level.
>>> The latest Featured Stock Update with an annotated graph appeared on 2/17/2011. Click here.
View all notes |
Alert me of new notes |
CANSLIM.net Company Profile |
SEC |
Zacks Reports |
StockTalk |
News |
Chart |
Request a new note
C
A N
S L
I M
|
|
|
|
THESE ARE NOT BUY RECOMMENDATIONS!
Comments contained in the body of this report are technical
opinions only. The material herein has been obtained
from sources believed to be reliable and accurate, however,
its accuracy and completeness cannot be guaranteed.
This site is not an investment advisor, hence it does
not endorse or recommend any securities or other investments.
Any recommendation contained in this report may not
be suitable for all investors and it is not to be deemed
an offer or solicitation on our part with respect to
the purchase or sale of any securities. All trademarks,
service marks and trade names appearing in this report
are the property of their respective owners, and are
likewise used for identification purposes only.
This report is a service available
only to active Paid Premium Members.
You may opt-out of receiving report notifications
at any time. Questions or comments may be submitted
by writing to Premium Membership Services 665 S.E. 10 Street, Suite 201 Deerfield Beach, FL 33441-5634 or by calling 1-800-965-8307
or 954-785-1121.
|
|
|

