You are not logged in.
This means you
CAN ONLY VIEW reports that were published prior to Monday, April 14, 2025.
You
MUST UPGRADE YOUR MEMBERSHIP if you want to see any current reports.
AFTER MARKET UPDATE - FRIDAY, MARCH 11TH, 2011
Previous After Market Report Next After Market Report >>>
|
|
|
|
DOW |
+59.79 |
12,044.40 |
+0.50% |
|
Volume |
922,194,230 |
-20% |
|
Volume |
1,809,888,110 |
-22% |
|
NASDAQ |
+14.59 |
2,715.61 |
+0.54% |
|
Advancers |
1,773 |
57% |
|
Advancers |
1,382 |
51% |
|
S&P 500 |
+9.17 |
1,304.28 |
+0.71% |
|
Decliners |
1,203 |
39% |
|
Decliners |
1,246 |
46% |
|
Russell 2000 |
+3.30 |
802.83 |
+0.41% |
|
52 Wk Highs |
35 |
|
|
52 Wk Highs |
34 |
|
|
S&P 600 |
+0.74 |
426.21 |
+0.17% |
|
52 Wk Lows |
20 |
|
|
52 Wk Lows |
76 |
|
|
 |
Major Averages Rose With Less Volume Conviction
Kenneth J. Gruneisen - Passed the CAN SLIM® Master's Exam
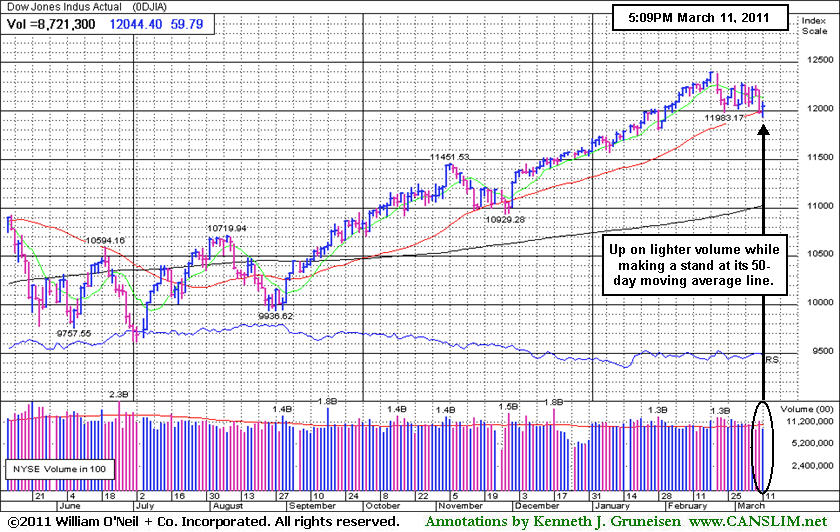
For the week the Dow Jones Industrial Average fell -1.0%, the S&P 500 Index was down -1.3%, and the Nasdaq Composite Index dropped -2.5%. The major averages overcame early weakness and turned higher at mid-session on Friday as fuel, metal, and industrial companies advanced in the wake of a huge earthquake in Japan. Advancing issues beat decliners by nearly 2-1 on the NYSE and by 8-7 on the Nasdaq. Volume totals were reported lighter on the NYSE and on the Nasdaq exchange versus the prior session's totals, whereas gains on higher volume would be considered a more reassuring sign of accumulation by the institutional crowd. New 52-week lows outnumbered new 52-week highs on the Nasdaq exchange for a second consecutive session, meanwhile new highs on the NYSE outnumbered new lows. There were 11 high-ranked companies from the CANSLIM.net Leaders List that made new 52-week highs and appeared on the CANSLIM.net BreakOuts Page, up from a total of 4 on the prior session. On the Featured Stocks Page there were gains from 13 of the 21 high-ranked market leaders currently listed.
Economic data were mixed. The University of Michigan consumer sentiment index for March came in at 68.2, much lower than the expectation for a reading of 76.5. A report on U.S. retail sales was in line with estimates. February retail sales increased 1%, the most in four months. January sales were revised higher.
Oil refiners turned higher as crude oil slumped -1.5% while major protests in Saudi Arabia failed to materialize. Meanwhile, the market also anticipated a decline in demand in Japan. Sony Corp (SNE -2.36%) slumped in New York trading after suspending operations at six Japanese factories. Toyota Motor Corp (TM -2.14%) also fell, meanwhile AK Steel Corp (AKS +5.75%) rose as stocks reacted based upon shifting outlooks after the quake.
Thursday marked the first time since November 16, 2010 that new 52-week lows outnumbered new 52-week highs on both the NYSE and on the Nasdaq exchange. The 3 major averages also unanimously suffered damaging losses and closed below their respective 50-day moving average (DMA) lines. Only the Nasdaq Composite Index finished the week below its 50 DMA line, however, after Friday's gains boosted the S&P 500 and Dow back above their short-term averages.
More damaging distributional action has the potential to lead to a much more substantial correction for the major averages (bad M criteria). During a correction investors should raise their cash levels and reduce stock market exposure. New buying efforts should be avoided until a new rally with a follow-through day (FTD) provides a fresh confirmation that buying demand from the institutional crowd is returning again. Even after a FTD, marked by an expansion in volume and stocks hitting new highs with higher volume, buying efforts should only be cautiously and carefully made when all of the investment system's key criteria are met.
PICTURED: The Dow Jones Industrial Average was up on lighter volume while making a stand at its 50-day moving average line.
|
 Kenneth J. Gruneisen started out as a licensed stockbroker in August 1987, a couple of months prior to the historic stock market crash that took the Dow Jones Industrial Average down -22.6% in a single day. He has published daily fact-based fundamental and technical analysis on high-ranked stocks online for two decades. Through FACTBASEDINVESTING.COM, Kenneth provides educational articles, news, market commentary, and other information regarding proven investment systems that work in good times and bad.
Comments contained in the body of this report are technical opinions only and are not necessarily those of Gruneisen Growth Corp. The material herein has been obtained from sources believed to be reliable and accurate, however, its accuracy and completeness cannot be guaranteed. Our firm, employees, and customers may effect transactions, including transactions contrary to any recommendation herein, or have positions in the securities mentioned herein or options with respect thereto. Any recommendation contained in this report may not be suitable for all investors and it is not to be deemed an offer or solicitation on our part with respect to the purchase or sale of any securities. |
|
 |
Commodity-Linked Groups Led Gainers
Kenneth J. Gruneisen - Passed the CAN SLIM® Master's Exam
Commodity-linked groups were some of Friday's best gainers as the Gold & Silver Index ($XAU +1.92%), Oil Services Index ($OSX +2.46%), and Integrated Oil Index ($XOI +1.47%) posted solid gains. The Networking Index ($NWX +2.06%) set a strong pace for the tech sector while the Semiconductor Index ($SOX +0.99%), Biotechnology Index ($BTK +1.04%), and Internet Index ($IIX +0.86%) followed with smaller gains. The Retail Index ($RLX +0.78%) and financial shares were among the groups having a positive influence as the Broker/Dealer Index ($XBD +0.33%) and Bank Index ($BKX +0.96%) posted modest gains. The Healthcare Index ($HMO -0.04%) was a laggard.
Charts courtesy www.stockcharts.com
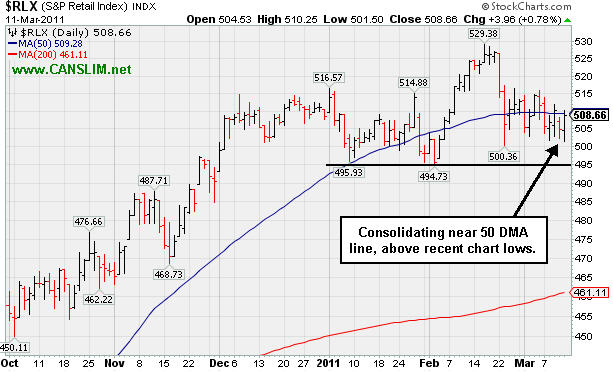
PICTURED: The Retail Index ($RLX +0.78%) is consolidating near its 50-day moving average (DMA) line, above recent chart lows.
| Oil Services |
$OSX |
278.09 |
+6.68 |
+2.46% |
+13.45% |
| Healthcare |
$HMO |
2,059.56 |
-0.83 |
-0.04% |
+21.72% |
| Integrated Oil |
$XOI |
1,314.89 |
+19.05 |
+1.47% |
+8.39% |
| Semiconductor |
$SOX |
427.91 |
+4.18 |
+0.99% |
+3.91% |
| Networking |
$NWX |
321.84 |
+6.49 |
+2.06% |
+14.72% |
| Internet |
$IIX |
311.65 |
+2.65 |
+0.86% |
+1.28% |
| Broker/Dealer |
$XBD |
121.25 |
+0.40 |
+0.33% |
-0.22% |
| Retail |
$RLX |
508.66 |
+3.96 |
+0.78% |
+0.06% |
| Gold & Silver |
$XAU |
206.81 |
+3.89 |
+1.92% |
-8.73% |
| Bank |
$BKX |
52.55 |
+0.50 |
+0.96% |
+0.65% |
| Biotech |
$BTK |
1,285.26 |
+13.25 |
+1.04% |
-0.95% |
|
|
|
 |
Recently Stalled Without Triggering New Buy Signal
Kenneth J. Gruneisen - Passed the CAN SLIM® Master's Exam
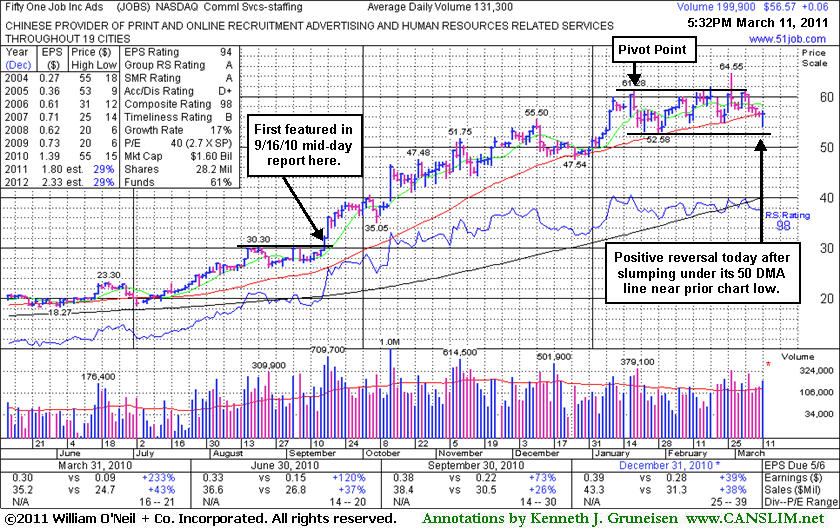
Fifty One Job Inc Ads (JOBS +$0.06 or +0.11% to $56.57) closed near the session high today after positively reversing, a sign of support near its 50-day moving average (DMA) line. Action indicative of distributional pressure recently raised concerns as it slumped below its pivot point noted more than a month ago. Gains for new highs with well above average volume would be a reassuring sign of accumulation by institutional investors, meanwhile its recent low ($52.58 on 1/28/11) defines support below its 50 DMA line where violations would trigger technical sell signals.
Its last appearance in this FSU section was on 2/07/11 with an annotated graph under the headline "Advanced Ascending Base After Rally From Earlier Breakout", but subsequent gains never materialized to trigger a new (or add-on) buy signal. It is an even later-stage candidate now, while long ago it was explained that - "It may be considered a riskier 'late-stage' breakout after having impressively rallied from March '09 lows near $6.00". JOBS has subsequently traded as much as +104% higher from $31.59 when noted in yellow in the 9/16/10 mid-day report while rising from a short flat base to a new 52-week high and within a penny of its 2006 high. It went on to trade above its 2004 highs near $55.
The number of top-rated funds owning its shares rose from 39 in Mar '10 to 69 in Dec '10, a reassuring sign with respect to the I criteria. Its small supply (S criteria) of only 28.2 million shares outstanding could contribute to greater volatility in the event of institutional buying or selling. The 4 latest quarterly comparisons show good sales growth and earnings improvement better than the +25% guideline. As previously noted, its annual earnings history (A criteria) was below strict guidelines of the fact-based investment system because of the downturn in its FY '08 earnings. Longtime readers may note that prior mid-day report appearances for JOBS earlier last year included cautionary remarks concerning its fundamentals, yet stronger sales growth in recent comparisons were cited as a very reassuring sign.
|
|
|
Color Codes Explained :
Y - Better candidates highlighted by our
staff of experts.
G - Previously featured
in past reports as yellow but may no longer be buyable under the
guidelines.
***Last / Change / Volume data in this table is the closing quote data***
Symbol/Exchange
Company Name
Industry Group |
PRICE |
CHANGE
(%Change) |
Day High |
Volume
(% DAV)
(% 50 day avg vol) |
52 Wk Hi
% From Hi |
Featured
Date |
Price
Featured |
Pivot Featured |
|
Max Buy |
BIDU
-
NASDAQ
Baidu Inc Ads
INTERNET - Internet Information Providers
|
$124.96
|
+4.09
3.38% |
$125.30
|
6,843,292
103.45% of 50 DAV
50 DAV is 6,615,100
|
$131.63
-5.07%
|
2/1/2011
|
$117.74
|
PP = $112.08
|
|
MB = $117.68
|
 Most Recent Note - 3/11/2011 4:15:26 PM
G - Positive action this week was reassuring in the face of widespread market weakness. Consolidating above its 50 DMA line and recent chart low defining important chart support to watch. See latest FSU analysis for details and a new annotated graph.
>>> The latest Featured Stock Update with an annotated graph appeared on 3/9/2011. Click here.
View all notes |
Alert me of new notes |
CANSLIM.net Company Profile |
SEC |
Zacks Reports |
StockTalk |
News |
Chart |
Request a new note
C
A N
S L
I M


|
CMG
-
NYSE
Chipotle Mexican Grill
LEISURE - Restaurants
|
$252.76
|
-0.46
-0.18% |
$255.66
|
687,511
64.99% of 50 DAV
50 DAV is 1,057,800
|
$275.00
-8.09%
|
2/11/2011
|
$271.15
|
PP = $262.87
|
|
MB = $276.01
|
Most Recent Note - 3/10/2011 4:10:03 PM
G - Positive reversal today was a reassuring sign while consolidating above support at its 50 DMA line and prior highs in the $237 area. Violations and damaging losses would raise greater concerns and trigger technical sell signals.
>>> The latest Featured Stock Update with an annotated graph appeared on 2/11/2011. Click here.
View all notes |
Alert me of new notes |
CANSLIM.net Company Profile |
SEC |
Zacks Reports |
StockTalk |
News |
Chart |
Request a new note
C
A N
S L
I M
|
CRUS
-
NASDAQ
Cirrus Logic Inc
ELECTRONICS - Semiconductor - Specialized
|
$21.00
|
-0.25
-1.18% |
$21.20
|
2,054,200
57.89% of 50 DAV
50 DAV is 3,548,200
|
$25.48
-17.58%
|
1/28/2011
|
$20.69
|
PP = $19.17
|
|
MB = $20.13
|
Most Recent Note - 3/10/2011 4:08:32 PM
G - Positive reversal today was a reassuring sign of prompt support after a gap down below a recent low (2/23/11 low $21.17) and below its 50 DMA line for the first time since November. Further deterioration below a previously noted high close ($20.54 on 7/26/10) would hurt its outlook and raise more serious concerns.
>>> The latest Featured Stock Update with an annotated graph appeared on 3/4/2011. Click here.
View all notes |
Alert me of new notes |
CANSLIM.net Company Profile |
SEC |
Zacks Reports |
StockTalk |
News |
Chart |
Request a new note
C
A N
S L
I M
|
CTSH
-
NASDAQ
Cognizant Tech Sol Cl A
COMPUTER SOFTWARE and SERVICES - Business Software and Services
|
$76.37
|
+0.26
0.34% |
$76.69
|
2,240,947
100.31% of 50 DAV
50 DAV is 2,234,100
|
$78.69
-2.95%
|
2/7/2011
|
$75.09
|
PP = $76.46
|
|
MB = $80.28
|
Most Recent Note - 3/10/2011 3:59:07 PM
Y - Down today on above average volume, erasing its prior gain and more as distributional pressure again weighs on it and the broader market. Support to watch is at its 50 DMA line.
>>> The latest Featured Stock Update with an annotated graph appeared on 2/8/2011. Click here.
View all notes |
Alert me of new notes |
CANSLIM.net Company Profile |
SEC |
Zacks Reports |
StockTalk |
News |
Chart |
Request a new note
C
A N
S L
I M
|
DECK
-
NASDAQ
Deckers Outdoor Corp
CONSUMER NON-DURABLES - Textile - Apparel Footwear
|
$84.23
|
+0.66
0.79% |
$84.94
|
994,878
61.75% of 50 DAV
50 DAV is 1,611,100
|
$94.70
-11.06%
|
2/3/2011
|
$79.61
|
PP = $82.67
|
|
MB = $86.80
|
Most Recent Note - 3/10/2011 4:00:35 PM
G - Down today on light volume, slumping near support at its pivot point and 50 DMA line.
>>> The latest Featured Stock Update with an annotated graph appeared on 3/3/2011. Click here.
View all notes |
Alert me of new notes |
CANSLIM.net Company Profile |
SEC |
Zacks Reports |
StockTalk |
News |
Chart |
Request a new note
C
A N
S L
I M
|
Symbol/Exchange
Company Name
Industry Group |
PRICE |
CHANGE
(%Change) |
Day High |
Volume
(% DAV)
(% 50 day avg vol) |
52 Wk Hi
% From Hi |
Featured
Date |
Price
Featured |
Pivot Featured |
|
Max Buy |
EBIX
-
NASDAQ
Ebix Inc
COMPUTER SOFTWARE and SERVICES - Business Software and Services
|
$28.13
|
+0.90
3.31% |
$28.25
|
480,840
88.76% of 50 DAV
50 DAV is 541,700
|
$29.61
-5.00%
|
2/28/2011
|
$25.70
|
PP = $25.97
|
|
MB = $27.27
|
Most Recent Note - 3/11/2011 4:13:19 PM
G - Color code is changed to green after today's gain lifted it back above its "max buy" level. Prior highs in the $25-26 area define chart support to watch along with its 50 DMA line.
>>> The latest Featured Stock Update with an annotated graph appeared on 2/28/2011. Click here.
View all notes |
Alert me of new notes |
CANSLIM.net Company Profile |
SEC |
Zacks Reports |
StockTalk |
News |
Chart |
Request a new note
C
A N
S L
I M
|
EZCH
-
NASDAQ
Ezchip Semiconductor Ltd
ELECTRONICS - Semiconductor - Specialized
|
$28.44
|
-0.26
-0.91% |
$28.75
|
274,523
71.27% of 50 DAV
50 DAV is 385,200
|
$33.48
-15.05%
|
12/2/2010
|
$27.53
|
PP = $26.00
|
|
MB = $27.30
|
Most Recent Note - 3/10/2011 10:24:45 AM
G - Gapped down today amid widespread market weakness. Its 50 DMA line recently has acted as resistance while volume totals have cooled. A convincing rebound above its short-term average would help its outlook, meanwhile it faces overhead supply up through the $33 area which may hinder its ability to rally.
>>> The latest Featured Stock Update with an annotated graph appeared on 3/1/2011. Click here.
View all notes |
Alert me of new notes |
CANSLIM.net Company Profile |
SEC |
Zacks Reports |
StockTalk |
News |
Chart |
Request a new note
C
A N
S L
I M
|
EZPW
-
NASDAQ
Ezcorp Inc Cl A
SPECIALTY RETAIL - Specialty Retail, Other
|
$27.59
|
-0.06
-0.22% |
$27.79
|
223,939
60.02% of 50 DAV
50 DAV is 373,100
|
$29.94
-7.85%
|
2/18/2011
|
$27.94
|
PP = $30.04
|
|
MB = $31.54
|
Most Recent Note - 3/10/2011 2:49:53 PM
G - Color code is changed to green while today's loss violating its 50 DMA line raises concerns. Gains with heavy volume above its latest pivot point have not shown up to provide the critical proof of institutional buying demand, meanwhile the recent low ($25.56 on 1/25/11) defines an important support level.
>>> The latest Featured Stock Update with an annotated graph appeared on 3/10/2011. Click here.
View all notes |
Alert me of new notes |
CANSLIM.net Company Profile |
SEC |
Zacks Reports |
StockTalk |
News |
Chart |
Request a new note
C
A N
S L
I M
|
FOSL
-
NASDAQ
Fossil Inc
CONSUMER DURABLES - Recreational Goods, Other
|
$82.55
|
-0.73
-0.88% |
$83.44
|
989,486
110.88% of 50 DAV
50 DAV is 892,400
|
$85.20
-3.11%
|
2/1/2011
|
$73.30
|
PP = $74.44
|
|
MB = $78.16
|
Most Recent Note - 3/10/2011 4:12:01 PM
G - Paused at its all-time high today after 6 consecutive gains, extended from its prior base. It found support at its 50 DMA line while consolidating above prior resistance in the $74 area.
>>> The latest Featured Stock Update with an annotated graph appeared on 2/24/2011. Click here.
View all notes |
Alert me of new notes |
CANSLIM.net Company Profile |
SEC |
Zacks Reports |
StockTalk |
News |
Chart |
Request a new note
C
A N
S L
I M
|
GSIT
-
NASDAQ
G S I Technology Inc
ELECTRONICS - Semiconductor - Broad Line
|
$8.41
|
-0.01
-0.12% |
$8.42
|
334,629
138.97% of 50 DAV
50 DAV is 240,800
|
$10.20
-17.55%
|
2/18/2011
|
$10.08
|
PP = $10.25
|
|
MB = $10.76
|
Most Recent Note - 3/10/2011 10:30:00 AM
Down today, raising concerns while slumping further below its 50 DMA line and violating prior lows in the $8.60-8.80 range. Based on technical weakness it will be dropped from the Featured Stocks list tonight.
>>> The latest Featured Stock Update with an annotated graph appeared on 2/18/2011. Click here.
View all notes |
Alert me of new notes |
CANSLIM.net Company Profile |
SEC |
Zacks Reports |
StockTalk |
News |
Chart |
Request a new note
C
A N
S L
I M
|
Symbol/Exchange
Company Name
Industry Group |
PRICE |
CHANGE
(%Change) |
Day High |
Volume
(% DAV)
(% 50 day avg vol) |
52 Wk Hi
% From Hi |
Featured
Date |
Price
Featured |
Pivot Featured |
|
Max Buy |
HMSY
-
NASDAQ
H M S Holdings Corp
COMPUTER SOFTWARE and SERVICES - Healthcare Information Service
|
$79.37
|
-0.17
-0.21% |
$79.84
|
157,183
95.20% of 50 DAV
50 DAV is 165,100
|
$81.36
-2.45%
|
11/19/2010
|
$61.89
|
PP = $63.01
|
|
MB = $66.16
|
Most Recent Note - 3/10/2011 4:01:49 PM
G - Perched near its all-time high after a spurt of gains, extended from any sound base pattern. Support to watch is defined by prior chart highs and its 50 DMA line in the $67 area.
>>> The latest Featured Stock Update with an annotated graph appeared on 2/16/2011. Click here.
View all notes |
Alert me of new notes |
CANSLIM.net Company Profile |
SEC |
Zacks Reports |
StockTalk |
News |
Chart |
Request a new note
C
A N
S L
I M
|
JOBS
-
NASDAQ
Fifty One Job Inc Ads
DIVERSIFIED SERVICES - Staffing and; Outsourcing Service
|
$56.57
|
+0.06
0.11% |
$57.13
|
199,933
154.03% of 50 DAV
50 DAV is 129,800
|
$64.55
-12.36%
|
2/7/2011
|
$59.23
|
PP = $61.38
|
|
MB = $64.45
|
Most Recent Note - 3/11/2011 4:24:45 PM
G - Closed near the session high today after positively reversing, a sign of support near its 50 DMA line. Action indicative of distributional pressure recently raised concerns as it slumped below its pivot point noted more than a month ago. Gains for new highs with well above average volume would be a reassuring sign of accumulation by institutional investors, meanwhile its recent low ($52.58 on 1/28/11) defines support below its 50 DMA line where violations would trigger technical sell signals.
>>> The latest Featured Stock Update with an annotated graph appeared on 3/11/2011. Click here.
View all notes |
Alert me of new notes |
CANSLIM.net Company Profile |
SEC |
Zacks Reports |
StockTalk |
News |
Chart |
Request a new note
C
A N
S L
I M
|
LULU
-
NASDAQ
Lululemon Athletica
MANUFACTURING - Textile Manufacturing
|
$76.50
|
+1.78
2.38% |
$76.90
|
1,293,036
65.64% of 50 DAV
50 DAV is 1,969,800
|
$85.28
-10.30%
|
1/26/2011
|
$68.11
|
PP = $74.70
|
|
MB = $78.44
|
Most Recent Note - 3/11/2011 4:11:14 PM
Y - Posted a gain today with below average volume, making a stand at its 50 DMA line. As previously noted - "A close below a significant prior high close ($73.51 on 12/21/10) would completely negate its latest breakout, raising more serious concerns."
>>> The latest Featured Stock Update with an annotated graph appeared on 2/25/2011. Click here.
View all notes |
Alert me of new notes |
CANSLIM.net Company Profile |
SEC |
Zacks Reports |
StockTalk |
News |
Chart |
Request a new note
C
A N
S L
I M
|
MWIV
-
NASDAQ
M W I Veterinary Supply
HEALTH SERVICES - Medical Instruments and; Supplies
|
$76.67
|
-0.32
-0.42% |
$77.91
|
150,905
193.47% of 50 DAV
50 DAV is 78,000
|
$78.48
-2.31%
|
11/4/2010
|
$61.79
|
PP = $59.60
|
|
MB = $62.58
|
Most Recent Note - 3/11/2011 4:25:53 PM
G - Perched at its all-time high, holding its ground following a streak of gains with above average volume. Found support near prior highs and its 50 DMA line recently but did not build a sound new base pattern. See the latest FSU analysis for more details and a new annotated graph.
>>> The latest Featured Stock Update with an annotated graph appeared on 3/8/2011. Click here.
View all notes |
Alert me of new notes |
CANSLIM.net Company Profile |
SEC |
Zacks Reports |
StockTalk |
News |
Chart |
Request a new note
C
A N
S L
I M
|
OPEN
-
NASDAQ
Opentable Inc
INTERNET - Internet Software and Services
|
$91.53
|
+2.59
2.91% |
$92.48
|
1,522,726
143.53% of 50 DAV
50 DAV is 1,060,900
|
$95.97
-4.63%
|
1/5/2011
|
$74.05
|
PP = $76.79
|
|
MB = $80.63
|
Most Recent Note - 3/11/2011 4:30:25 PM
G - Closed the week higher despite broader market weakness. Consolidation of about 4 weeks has the look of a bullish base-on-base type pattern forming, but a proper "flat base" should be a minimum of 5 weeks in length. Support to watch is at its 50 DMA line and prior chart highs.
>>> The latest Featured Stock Update with an annotated graph appeared on 2/15/2011. Click here.
View all notes |
Alert me of new notes |
CANSLIM.net Company Profile |
SEC |
Zacks Reports |
StockTalk |
News |
Chart |
Request a new note
C
A N
S L
I M
|
Symbol/Exchange
Company Name
Industry Group |
PRICE |
CHANGE
(%Change) |
Day High |
Volume
(% DAV)
(% 50 day avg vol) |
52 Wk Hi
% From Hi |
Featured
Date |
Price
Featured |
Pivot Featured |
|
Max Buy |
ORCL
-
NASDAQ
Oracle Corp
COMPUTER SOFTWARE and SERVICES - Application Software
|
$31.91
|
+0.11
0.35% |
$32.40
|
23,747,309
100.62% of 50 DAV
50 DAV is 23,600,200
|
$33.71
-5.34%
|
1/20/2011
|
$32.31
|
PP = $32.37
|
|
MB = $33.99
|
Most Recent Note - 3/10/2011 10:33:58 AM
Y - Gapped down today amid widespread market weakness, slumping below its 50 DMA line again. Its Relative Strength rank has also slumped below the 80+ guideline normally required of buy candidates. Prior low previously noted ($30.80 on 1/10/11) defines the next important chart support level to watch.
>>> The latest Featured Stock Update with an annotated graph appeared on 2/22/2011. Click here.
View all notes |
Alert me of new notes |
CANSLIM.net Company Profile |
SEC |
Zacks Reports |
StockTalk |
News |
Chart |
Request a new note
C
A N
S L
I M
|
PAY
-
NYSE
Verifone Systems Inc
COMPUTER HARDWARE - Transaction Automation Systems
|
$49.00
|
+0.44
0.91% |
$49.35
|
905,310
54.21% of 50 DAV
50 DAV is 1,670,000
|
$51.23
-4.35%
|
1/27/2011
|
$41.77
|
PP = $44.97
|
|
MB = $47.22
|
Most Recent Note - 3/10/2011 10:04:05 AM
G - Gapped down today, pulling back from new 52-week and all-time highs hit this week with a volume-driven gain. No resistance remains due to overhead supply, but it is extended from a sound base pattern. Its 50 DMA line defines chart support to watch.
>>> The latest Featured Stock Update with an annotated graph appeared on 3/2/2011. Click here.
View all notes |
Alert me of new notes |
CANSLIM.net Company Profile |
SEC |
Zacks Reports |
StockTalk |
News |
Chart |
Request a new note
C
A N
S L
I M
|
PCLN
-
NASDAQ
Priceline.Com Inc
INTERNET - Internet Software and Services
|
$463.19
|
-1.22
-0.26% |
$466.76
|
925,341
82.41% of 50 DAV
50 DAV is 1,122,800
|
$474.74
-2.43%
|
1/3/2011
|
$399.55
|
PP = $428.20
|
|
MB = $449.61
|
Most Recent Note - 3/10/2011 10:06:01 AM
G - Hovering near its 52-week high, extended from a sound base. Found impressive support near its 50 DMA line in recent months.
>>> The latest Featured Stock Update with an annotated graph appeared on 2/14/2011. Click here.
View all notes |
Alert me of new notes |
CANSLIM.net Company Profile |
SEC |
Zacks Reports |
StockTalk |
News |
Chart |
Request a new note
C
A N
S L
I M
|
RAX
-
NYSE
Rackspace Hosting Inc
INTERNET - Internet Software and; Services
|
$36.96
|
+0.19
0.52% |
$37.37
|
1,159,236
63.59% of 50 DAV
50 DAV is 1,823,000
|
$40.62
-9.01%
|
1/10/2011
|
$22.84
|
PP = $32.76
|
|
MB = $34.40
|
Most Recent Note - 3/10/2011 10:08:42 AM
G - Gapped down today amid widespread market weakness. Consolidating above prior highs near $35 and its 50 DMA line defining chart support to watch.
>>> The latest Featured Stock Update with an annotated graph appeared on 2/9/2011. Click here.
View all notes |
Alert me of new notes |
CANSLIM.net Company Profile |
SEC |
Zacks Reports |
StockTalk |
News |
Chart |
Request a new note
C
A N
S L
I M
|
TIBX
-
NASDAQ
Tibco Software Inc
COMPUTER SOFTWARE and SERVICES - Business Software and Services
|
$23.97
|
+0.05
0.21% |
$24.31
|
2,157,087
87.18% of 50 DAV
50 DAV is 2,474,300
|
$25.94
-7.59%
|
2/1/2011
|
$24.35
|
PP = $22.18
|
|
MB = $23.29
|
Most Recent Note - 3/10/2011 4:02:40 PM
G - Down today on average volume, finishing -7.8% off its 52-week high. Recently found support above prior highs in the $22 area and well above its 50 DMA line.
>>> The latest Featured Stock Update with an annotated graph appeared on 2/10/2011. Click here.
View all notes |
Alert me of new notes |
CANSLIM.net Company Profile |
SEC |
Zacks Reports |
StockTalk |
News |
Chart |
Request a new note
C
A N
S L
I M
|
Symbol/Exchange
Company Name
Industry Group |
PRICE |
CHANGE
(%Change) |
Day High |
Volume
(% DAV)
(% 50 day avg vol) |
52 Wk Hi
% From Hi |
Featured
Date |
Price
Featured |
Pivot Featured |
|
Max Buy |
UA
-
NYSE
Under Armour Inc Cl A
CONSUMER NON-DURABLES - Textile - Apparel Clothing
|
$69.45
|
+1.76
2.60% |
$69.77
|
631,722
83.84% of 50 DAV
50 DAV is 753,500
|
$70.69
-1.75%
|
1/27/2011
|
$58.31
|
PP = $56.99
|
|
MB = $59.84
|
Most Recent Note - 3/11/2011 4:20:10 PM
G -Perched at its 52-week high, rising this week amid widespread weakness. Its consolidation has been healthy while forming a base-on-base type pattern. See the latest FSU analysis for more details and a new annotated graph.
>>> The latest Featured Stock Update with an annotated graph appeared on 3/7/2011. Click here.
View all notes |
Alert me of new notes |
CANSLIM.net Company Profile |
SEC |
Zacks Reports |
StockTalk |
News |
Chart |
Request a new note
C
A N
S L
I M
|
ULTA
-
NASDAQ
Ulta Salon Cosm & Frag
SPECIALTY RETAIL - Specialty Retail, Other
|
$45.77
|
+3.66
8.70% |
$47.55
|
3,042,711
635.09% of 50 DAV
50 DAV is 479,100
|
$44.06
3.89%
|
1/6/2011
|
$36.12
|
PP = $37.34
|
|
MB = $39.21
|
Most Recent Note - 3/11/2011 1:28:49 PM
G - Gapped up today and spiked to new all-time highs with heavy volume behind its considerable gain after reporting earnings +41% on +20% sales revenues for the quarter ended January 31, 2011 versus the year ago period. Its 4-week consolidation was too short to be considered a sound base pattern. Support to watch above its 50 DMA line.
>>> The latest Featured Stock Update with an annotated graph appeared on 2/17/2011. Click here.
View all notes |
Alert me of new notes |
CANSLIM.net Company Profile |
SEC |
Zacks Reports |
StockTalk |
News |
Chart |
Request a new note
C
A N
S L
I M
|
|
|
|
THESE ARE NOT BUY RECOMMENDATIONS!
Comments contained in the body of this report are technical
opinions only. The material herein has been obtained
from sources believed to be reliable and accurate, however,
its accuracy and completeness cannot be guaranteed.
This site is not an investment advisor, hence it does
not endorse or recommend any securities or other investments.
Any recommendation contained in this report may not
be suitable for all investors and it is not to be deemed
an offer or solicitation on our part with respect to
the purchase or sale of any securities. All trademarks,
service marks and trade names appearing in this report
are the property of their respective owners, and are
likewise used for identification purposes only.
This report is a service available
only to active Paid Premium Members.
You may opt-out of receiving report notifications
at any time. Questions or comments may be submitted
by writing to Premium Membership Services 665 S.E. 10 Street, Suite 201 Deerfield Beach, FL 33441-5634 or by calling 1-800-965-8307
or 954-785-1121.
|
|
|

