You are not logged in.
This means you
CAN ONLY VIEW reports that were published prior to Monday, February 26, 2024.
You
MUST UPGRADE YOUR MEMBERSHIP if you want to see any current reports.
AFTER MARKET UPDATE - FRIDAY, MARCH 8TH, 2019
Previous After Market Report Next After Market Report >>>
|
|
|
|
DOW |
-22.99 |
25,450.24 |
-0.09% |
|
Volume |
816,426,400 |
-11% |
|
Volume |
2,257,561,310 |
-7% |
|
NASDAQ |
-13.32 |
7,408.14 |
-0.18% |
|
Advancers |
1,311 |
45% |
|
Advancers |
1,387 |
45% |
|
S&P 500 |
-5.86 |
2,743.07 |
-0.21% |
|
Decliners |
1,595 |
55% |
|
Decliners |
1,679 |
55% |
|
Russell 2000 |
-1.74 |
1,521.88 |
-0.11% |
|
52 Wk Highs |
45 |
|
|
52 Wk Highs |
39 |
|
|
S&P 600 |
-1.55 |
934.18 |
-0.17% |
|
52 Wk Lows |
51 |
|
|
52 Wk Lows |
57 |
|
|
 |
Thin Leadership as Major Indices Sputter
Kenneth J. Gruneisen - Passed the CAN SLIM® Master's Exam
For the week, the Dow and S&P 500 both lost 2.2%. The Nasdaq snapped its 10-week winning streak, falling 2.5%.Stocks finished lower Friday. The Dow fell 22 points to 25,450 while the S&P 500 lost 5 points to 2,743. The Nasdaq Composite declined 13 points to 7,408. The volume totals reported were lighter than the prior session totals on the NYSE and on the Nasdaq exchange, indicative of less selling pressure from large institutional investors. Breadth was slightly negative as decliners led advancers by an 8-7 margin on the NYSE and on the Nasdaq exchange. Leadership remained thin as there were 4 high-ranked companies from the Leaders List that made a new 52-week high and were listed on the BreakOuts Page. New 52-week lows outnumbered new 52-week highs on the NYSE and on the Nasdaq exchange. The major indices (M criteria) are in an uptrend under pressure while market leadership has thinned (fewer stocks hitting new highs). The Featured Stocks Page provides the most timely analysis on high-ranked leaders. Charts used courtesy of www.stockcharts.com
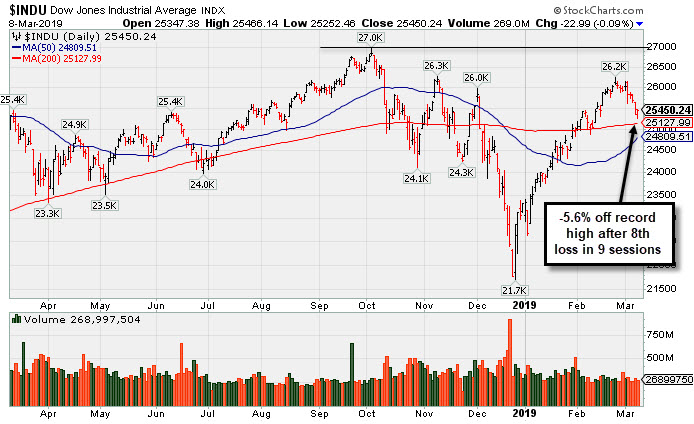
PICTURED: The Dow Jones Industrial Average is -5.6% off its record high after 8 losses in the span of 9 sessions.
The major averages experienced their worst week of 2019 as investors assessed economic data updates. On the data front, non-farm payrolls increased by 20,000 in February, well below consensus expectations of 180,000 and the weakest reading since September 2017. Meanwhile, the unemployment rate eased to 3.8%, near a five decade low. Average hourly earnings advanced at a 3.4% annualized rate, the strongest pace in ten years. In a separately update, U.S. housing starts jumped 18.6% month-over-month in January. A disappointing update out of China also weighed on investor sentiment after a survey revealed Chinese exports tumbled 20% in February.
Six of 11 S&P 500 sectors finished in negative territory with Energy stocks leading the decline in sympathy with lower oil prices. Consumer Staples finished higher with Costco (COST +5.09%) rose after topping Wall Street profit projections. In other corporate news, shares of Netflix (NFLX -0.85%) fell following an analyst downgrade.
Treasuries strengthened with the yield on the 10-year note down one basis point to 2.63%. In commodities, NYMEX WTI crude slipped 1.0% to $56.12/barrel. COMEX gold added 1.2% to $1,300.90/ounce amid a weaker dollar. |
 Kenneth J. Gruneisen started out as a licensed stockbroker in August 1987, a couple of months prior to the historic stock market crash that took the Dow Jones Industrial Average down -22.6% in a single day. He has published daily fact-based fundamental and technical analysis on high-ranked stocks online for two decades. Through FACTBASEDINVESTING.COM, Kenneth provides educational articles, news, market commentary, and other information regarding proven investment systems that work in good times and bad.
Comments contained in the body of this report are technical opinions only and are not necessarily those of Gruneisen Growth Corp. The material herein has been obtained from sources believed to be reliable and accurate, however, its accuracy and completeness cannot be guaranteed. Our firm, employees, and customers may effect transactions, including transactions contrary to any recommendation herein, or have positions in the securities mentioned herein or options with respect thereto. Any recommendation contained in this report may not be suitable for all investors and it is not to be deemed an offer or solicitation on our part with respect to the purchase or sale of any securities. |
|
 |
Energy, Retail, Broker/Dealer and Tech Indexes Fell
Kenneth J. Gruneisen - Passed the CAN SLIM® Master's Exam
The Bank Index ($BKX +0.20%) eked out a small gain while the Broker/Dealer Index ($XBD -0.82%) and the Retail Index ($RLX -0.74%) both ended lower. The tech sector had a slightly negative bias as the Biotech Index ($BTK -0.46%) and the Networking Index ($NWX -0.21%) ended modestly lower and the Semiconductor Index ($SOX -0.07%) finished flat. Commodity-linked groups were mixed as the Gold & Silver Index ($XAU +3.25%) posted a solid gain, meanwhile the Oil Services Index ($OSX -2.99%) and the Integrated Oil Index ($XOI -2.21%) both ended the session solidly lower.
Charts courtesy of www.stockcharts.com
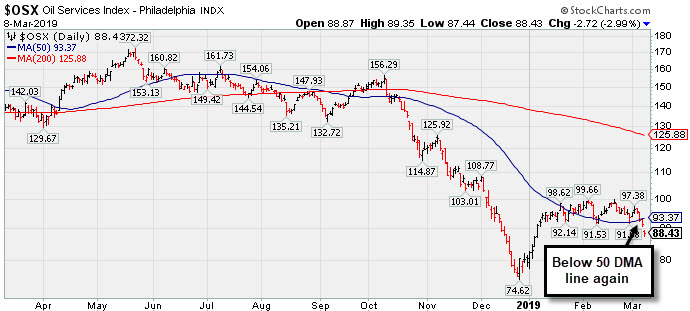 PICTURED: The Oil Services Index ($OSX -2.99%) slumped below its 50-day moving average (DMA) line this week after sputtering in recent weeks.
| Oil Services |
$OSX |
88.43 |
-2.72 |
-2.98% |
+9.71% |
| Integrated Oil |
$XOI |
1,251.29 |
-28.34 |
-2.21% |
+7.95% |
| Semiconductor |
$SOX |
1,318.21 |
-0.88 |
-0.07% |
+14.11% |
| Networking |
$NWX |
568.82 |
-1.19 |
-0.21% |
+16.40% |
| Broker/Dealer |
$XBD |
255.01 |
-2.12 |
-0.82% |
+7.44% |
| Retail |
$RLX |
2,104.82 |
-15.69 |
-0.74% |
+7.86% |
| Gold & Silver |
$XAU |
76.02 |
+2.39 |
+3.25% |
+7.59% |
| Bank |
$BKX |
97.45 |
+0.20 |
+0.21% |
+13.59% |
| Biotech |
$BTK |
4,860.66 |
-22.39 |
-0.46% |
+15.16% |
|
|
|
 |
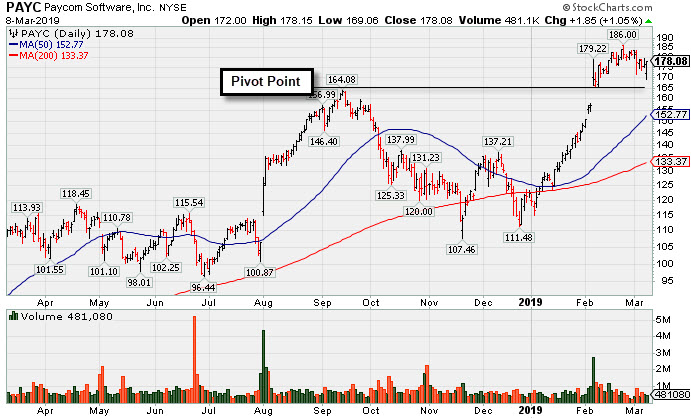
Consolidating Near All-Time High
Kenneth J. Gruneisen - Passed the CAN SLIM® Master's Exam
Paycom Software Inc (PAYC +$1.85 or +1.05% to $178.08) managed a "positive reversal" today after early weakness. It was highlighted in yellow with new pivot point cited based on its 9/14/18 high plus 10 cents in the 2/06/19 mid-day report (read here). A "breakaway gap" cleared all overhead supply and triggered a technical buy signal. Bullish action came after it reported earnings +24% on +32% sales revenues for the Dec '18 quarter, one notch below the +25% minimum earnings guideline (C criteria). Prior comparisons established its strong earnings track record and it has earned a 94 Earnings Per Share Rating.
The high-ranked Computer Software - Enterprise firm was last shown in this FSU section on 2/06/19 with an annotated graph under the headline, "Breakaway Gap Backed by Volume +388% Above Average". It found support after a deep slump below its 200 DMA line since dropped from the Featured Stocks list on 10/10/18.
The current Up/Down Volume Ratio of 1.9 is an unbiased indication its shares have been under heavy accumulation over the past 50 days. Its small supply of only 58.6 million shares outstanding (S criteria) can contribute to greater price volatility in the event of institutional buying or selling. The number of top-rated funds owning its shares rose from 384 in Jun '17 to 461 in Dec '18, a reassuring sign concerning the I criteria. It has a Timeliness rating of A and Sponsorship rating of B. It completed Secondary Offerings on on 11/13/15, 9/16/15, 5/15/15 and 1/14/15 since its $15 IPO on 4/15/14. |
|
|
Color Codes Explained :
Y - Better candidates highlighted by our
staff of experts.
G - Previously featured
in past reports as yellow but may no longer be buyable under the
guidelines.
***Last / Change / Volume data in this table is the closing quote data***
Symbol/Exchange
Company Name
Industry Group |
PRICE |
CHANGE
(%Change) |
Day High |
Volume
(% DAV)
(% 50 day avg vol) |
52 Wk Hi
% From Hi |
Featured
Date |
Price
Featured |
Pivot Featured |
|
Max Buy |
MLR
-
NYSE
Miller Industries Inc
AUTOMOTIVE - Auto Parts
|
$33.50
|
+0.44
1.33% |
$33.50
|
25,920
83.61% of 50 DAV
50 DAV is 31,000
|
$35.26
-4.99%
|
11/30/2018
|
$28.35
|
PP = $29.50
|
|
MB = $30.98
|
Most Recent Note - 3/7/2019 5:22:40 PM
G - Suffered a 3rd consecutive loss today, retreating from its 52-week high. Reported earnings +17% on +13% sales revenues for the Dec '18 quarter, below the +25% minimum guideline (C criteria), raising fundamental concerns. Its 50 DMA line ($30.16) and prior highs in the $29 area define near-term support to watch.
>>> FEATURED STOCK ARTICLE : Extended From Prior Base After Impressive Streak of Gains - 3/1/2019 |
View all notes |
Set NEW NOTE alert |
Company Profile |
SEC
News |
Chart |
Request a new note
C
A
S
I |
NSP
-
NYSE
Insperity Inc
Comml Svcs-Outsourcing
|
$121.58
|
-0.97
-0.79% |
$121.93
|
266,775
76.66% of 50 DAV
50 DAV is 348,000
|
$132.50
-8.24%
|
2/11/2019
|
$127.91
|
PP = $121.25
|
|
MB = $127.31
|
Most Recent Note - 3/4/2019 8:27:52 PM
Y - Quietly consolidating below its "max buy" level. Prior highs in the $119-121 area define initial support to watch on pullbacks.
>>> FEATURED STOCK ARTICLE : Big Breakaway Gap Triggered Technical Buy Signal - 2/11/2019 |
View all notes |
Set NEW NOTE alert |
Company Profile |
SEC
News |
Chart |
Request a new note
C
A
S
I |
ZBRA
-
NASDAQ
Zebra Tech Corp Cl A
COMPUTER HARDWARE - Computer Peripherals
|
$201.90
|
-0.09
-0.04% |
$202.37
|
370,231
76.02% of 50 DAV
50 DAV is 487,000
|
$207.88
-2.88%
|
2/14/2019
|
$198.10
|
PP = $184.85
|
|
MB = $194.09
|
Most Recent Note - 3/5/2019 8:58:51 PM
G - Still stubbornly holding its ground in a tight range near its all-time high with volume totals cooling. Extended from the prior base. Prior highs in the $184 area define initial support to watch on pullbacks.
>>> FEATURED STOCK ARTICLE : Big Volume-Driven Gain for New High - 2/14/2019 |
View all notes |
Set NEW NOTE alert |
Company Profile |
SEC
News |
Chart |
Request a new note
C
A
S
I |
SPSC
-
NASDAQ
S P S Commerce Inc
COMPUTER SOFTWARE and SERVICES - Application Software
|
$106.08
|
+0.54
0.51% |
$106.21
|
97,128
60.71% of 50 DAV
50 DAV is 160,000
|
$113.31
-6.38%
|
2/13/2019
|
$104.30
|
PP = $100.78
|
|
MB = $105.82
|
Most Recent Note - 3/6/2019 6:01:26 PM
Y - Color code is changed to yellow after pulling back below its "max buy" level with today's loss on light volume. Prior highs in the $100 area define initial support to watch.
>>> FEATURED STOCK ARTICLE : Gap Up and Big Volume Driven Gain for New High - 2/13/2019 |
View all notes |
Set NEW NOTE alert |
Company Profile |
SEC
News |
Chart |
Request a new note
C
A
S
I |
SSNC
-
NASDAQ
S S & C Technologies
COMPUTER SOFTWARE and SERVICES - Application Software
|
$60.53
|
-0.43
-0.71% |
$60.62
|
2,193,257
120.05% of 50 DAV
50 DAV is 1,827,000
|
$64.36
-5.95%
|
2/15/2019
|
$59.73
|
PP = $61.07
|
|
MB = $64.12
|
 Most Recent Note - 3/8/2019 12:11:14 PM
Y - Rebounded from a deep loss earlier today after gapping down. Stalled after a 3/01/19 gain above its pivot point backed by +49% above average volume triggered a technical buy signal.
>>> FEATURED STOCK ARTICLE : Volume-Driven Gain for New High Close - 2/19/2019 |
View all notes |
Set NEW NOTE alert |
Company Profile |
SEC
News |
Chart |
Request a new note
C
A
S
I |
Symbol/Exchange
Company Name
Industry Group |
PRICE |
CHANGE
(%Change) |
Day High |
Volume
(% DAV)
(% 50 day avg vol) |
52 Wk Hi
% From Hi |
Featured
Date |
Price
Featured |
Pivot Featured |
|
Max Buy |
IRBT
-
NASDAQ
Irobot Corp
CONSUMER DURABLES - Electronic Equipment
|
$122.20
|
+0.51
0.42% |
$122.88
|
785,690
95.58% of 50 DAV
50 DAV is 822,000
|
$132.88
-8.04%
|
2/8/2019
|
$104.92
|
PP = $103.63
|
|
MB = $108.81
|
Most Recent Note - 3/7/2019 5:24:17 PM
G - Pulled back today for a 3rd consecutive loss with slightly higher (near average) volume. There was a "negative reversal" on 3/05/19 after quietly touching another new all-time high. Recent gains have lacked great volume conviction. It is extended from the previously noted "double bottom" base. Prior high ($103) defines initial support to watch on pullbacks.
>>> FEATURED STOCK ARTICLE : Volume-Driven Gains Cleared Prior High After Double Bottom - 2/8/2019 |
View all notes |
Set NEW NOTE alert |
Company Profile |
SEC
News |
Chart |
Request a new note
C
A
S
I |
LHCG
-
NASDAQ
L H C Group Inc
HEALTH SERVICES - Home Health Care
|
$108.12
|
+1.81
1.70% |
$109.57
|
271,782
108.28% of 50 DAV
50 DAV is 251,000
|
$114.22
-5.34%
|
1/23/2019
|
$107.29
|
PP = $107.61
|
|
MB = $112.99
|
Most Recent Note - 3/5/2019 8:53:38 PM
Y - Hovering near its all-time high with volume totals cooling. Bullish action came after it reported earnings +66% on +75% sales revenues for the Dec '18 quarter.
>>> FEATURED STOCK ARTICLE : Recent Gains for New Highs Lacked Great Volume Conviction - 2/21/2019 |
View all notes |
Set NEW NOTE alert |
Company Profile |
SEC
News |
Chart |
Request a new note
C
A
S
I |
ENSG
-
NASDAQ
Ensign Group Inc
HEALTH SERVICES - Long-Term Care Facilities
|
$48.50
|
+0.33
0.69% |
$48.67
|
203,406
61.08% of 50 DAV
50 DAV is 333,000
|
$54.56
-11.11%
|
2/7/2019
|
$48.71
|
PP = $49.06
|
|
MB = $51.51
|
Most Recent Note - 3/6/2019 3:56:24 PM
Y - Pulling back on light volume, consolidating near prior highs in the $48 area defining initial support to watch.
>>> FEATURED STOCK ARTICLE : Closed Near Pivot Point After Gap Up and Big Volume-Driven Gain - 2/7/2019 |
View all notes |
Set NEW NOTE alert |
Company Profile |
SEC
News |
Chart |
Request a new note
C
A
S
I |
NXST
-
NASDAQ
Nexstar Media Group Cl A
MEDIA - Broadcasting - TV
|
$102.99
|
+0.89
0.87% |
$103.57
|
591,897
108.41% of 50 DAV
50 DAV is 546,000
|
$104.03
-1.00%
|
2/26/2019
|
$94.26
|
PP = $89.76
|
|
MB = $94.25
|
Most Recent Note - 3/6/2019 6:07:02 PM
G - Posted a small gain on light volume today hitting another new all-time high. Disciplined investors avoid chasing stocks more than +5% above the prior high.
>>> FEATURED STOCK ARTICLE : Twice Average Volume Behind Gain for New High - 2/26/2019 |
View all notes |
Set NEW NOTE alert |
Company Profile |
SEC
News |
Chart |
Request a new note
C
A
S
I |
BSTC
-
NASDAQ
Biospecifics Technologie
Medical-Biomed/Biotech
|
$67.68
|
+0.50
0.74% |
$68.62
|
22,528
51.20% of 50 DAV
50 DAV is 44,000
|
$73.31
-7.68%
|
1/18/2019
|
$67.40
|
PP = $66.31
|
|
MB = $69.63
|
Most Recent Note - 3/7/2019 5:18:22 PM
Y - Consolidating near prior highs and above its 50 DMA line ($65.19) defining important near-term support to watch. More damaging losses would raise concerns and trigger a technical sell signal. See the latest FSU analysis for more details and a new annotated graph.
>>> FEATURED STOCK ARTICLE : Consolidating Above 50-Day Moving Average and Prior Highs - 3/7/2019 |
View all notes |
Set NEW NOTE alert |
Company Profile |
SEC
News |
Chart |
Request a new note
C
A
S
I |
Symbol/Exchange
Company Name
Industry Group |
PRICE |
CHANGE
(%Change) |
Day High |
Volume
(% DAV)
(% 50 day avg vol) |
52 Wk Hi
% From Hi |
Featured
Date |
Price
Featured |
Pivot Featured |
|
Max Buy |
UBNT
-
NASDAQ
Ubiquiti Networks
TELECOMMUNICATIONS - Diversified Communication Serv
|
$140.72
|
+1.14
0.82% |
$141.45
|
209,640
57.28% of 50 DAV
50 DAV is 366,000
|
$148.68
-5.35%
|
2/8/2019
|
$121.97
|
PP = $115.54
|
|
MB = $121.32
|
Most Recent Note - 3/5/2019 8:49:08 PM
G - Stubbornly holding its ground perched near its all-time high, very extended from the prior base. Fundamentals remain strong. Prior high ($115) defines initial support to watch on pullbacks. See the latest FSU analysis for more details and a new annotated graph.
>>> FEATURED STOCK ARTICLE : Bullish Action Came Following Another Strong Earnings Report - 3/5/2019 |
View all notes |
Set NEW NOTE alert |
Company Profile |
SEC
News |
Chart |
Request a new note
C
A
S
I |
NOW
-
NYSE
Servicenow Inc
Computer Sftwr-Enterprse
|
$233.95
|
+0.58
0.25% |
$234.03
|
1,397,492
63.84% of 50 DAV
50 DAV is 2,189,000
|
$245.33
-4.64%
|
1/31/2019
|
$218.14
|
PP = $206.40
|
|
MB = $216.72
|
Most Recent Note - 3/6/2019 5:53:13 PM
G - Down today with lighter volume. Prior high ($206) defines initial support to watch on pullbacks. See the latest FSU analysis for more details and a new annotated graph.
>>> FEATURED STOCK ARTICLE : Pulling Back After 6 Straight Weekly Gains - 3/6/2019 |
View all notes |
Set NEW NOTE alert |
Company Profile |
SEC
News |
Chart |
Request a new note
C
A
S
I |
PANW
-
NYSE
Palo Alto Networks
Computer Sftwr-Security
|
$234.63
|
+0.11
0.05% |
$237.54
|
1,020,938
70.56% of 50 DAV
50 DAV is 1,447,000
|
$260.63
-9.98%
|
2/25/2019
|
$233.54
|
PP = $239.60
|
|
MB = $251.58
|
Most Recent Note - 3/5/2019 8:51:02 PM
Y - Pulled back today on higher volume for a 4th consecutive loss, slumping below its pivot point and into the prior base raising concerns. Reported earnings +44% on +30% sales revenues for the Jan '19 quarter, continuing its strong earnings track record.
>>> FEATURED STOCK ARTICLE : Rebounded Near Prior High With Earnings News Due - 2/25/2019 |
View all notes |
Set NEW NOTE alert |
Company Profile |
SEC
News |
Chart |
Request a new note
C
A
S
I |
PAYC
-
NYSE
Paycom Software Inc
COMPUTER SOFTWARE and SERVICES - Application Software
|
$178.08
|
+1.85
1.05% |
$178.15
|
482,614
75.17% of 50 DAV
50 DAV is 642,000
|
$186.00
-4.26%
|
2/6/2019
|
$171.66
|
PP = $164.18
|
|
MB = $172.39
|
Most Recent Note - 3/8/2019 6:56:13 PM
G - Managed a "positive reversal" today after early weakness. It is extended from any sound base. the prior high ($164) defines initial support to watch above its 50 DMA line ($152.77). See the latest FSU analysis for more details and a new annotated graph.
>>> FEATURED STOCK ARTICLE : Consolidating Near All-Time High - 3/8/2019 |
View all notes |
Set NEW NOTE alert |
Company Profile |
SEC
News |
Chart |
Request a new note
C
A
S
I |
PYPL
-
NASDAQ
Paypal Holdings Inc
Finance-CrdtCard/PmtPr
|
$95.69
|
-0.52
-0.54% |
$95.77
|
4,577,709
56.56% of 50 DAV
50 DAV is 8,093,000
|
$99.45
-3.78%
|
1/24/2019
|
$92.56
|
PP = $93.80
|
|
MB = $98.49
|
Most Recent Note - 3/4/2019 8:32:15 PM
Y - Pulled back today with higher (near average) volume. Recent gains into new high territory came with light volume, not indicative of great institutional buying demand. Prior highs in the $92 area define support above its 50 DMA line ($90.54).
>>> FEATURED STOCK ARTICLE : Wedging into New High Territory With Gains Lacking Volume - 2/22/2019 |
View all notes |
Set NEW NOTE alert |
Company Profile |
SEC
News |
Chart |
Request a new note
C
A
S
I |
Symbol/Exchange
Company Name
Industry Group |
PRICE |
CHANGE
(%Change) |
Day High |
Volume
(% DAV)
(% 50 day avg vol) |
52 Wk Hi
% From Hi |
Featured
Date |
Price
Featured |
Pivot Featured |
|
Max Buy |
ALRM
-
NASDAQ
Alarm.com Holdings Inc
Security/Sfty
|
$58.15
|
+0.39
0.68% |
$58.39
|
508,414
88.88% of 50 DAV
50 DAV is 572,000
|
$65.85
-11.69%
|
1/22/2019
|
$60.52
|
PP = $60.30
|
|
MB = $63.32
|
Most Recent Note - 3/5/2019 9:00:57 PM
G - Rebounded above its 50 DMA line ($58.84) with today's big gain. Weak action came after it reported earnings +12% on +25% sales revenues for the Dec '18 quarter, below the +25% minimum earnings guideline (C criteria), raising fundamental concerns.
>>> FEATURED STOCK ARTICLE : Volume Totals Cooling While Perched at All-Time High - 2/20/2019 |
View all notes |
Set NEW NOTE alert |
Company Profile |
SEC
News |
Chart |
Request a new note
C
A
S
I |
PLNT
-
NYSE
Planet Fitness Inc Cl A
Leisure-Services
|
$64.04
|
+0.15
0.23% |
$64.13
|
1,319,370
89.75% of 50 DAV
50 DAV is 1,470,000
|
$64.50
-0.71%
|
11/7/2018
|
$57.10
|
PP = $55.45
|
|
MB = $58.22
|
Most Recent Note - 3/6/2019 6:09:35 PM
G - Posted a 7th consecutive gain today with above average volume hitting another new all-time high. Rallying after testing support at its 50 DMA line ($57.37) last week. Reported earnings +42% on +30% sales revenues for the Dec '18 quarter.
>>> FEATURED STOCK ARTICLE : Met Distributional Pressure While Hitting New High After Earnings - 2/27/2019 |
View all notes |
Set NEW NOTE alert |
Company Profile |
SEC
News |
Chart |
Request a new note
C
A
S
I |
TEAM
-
NASDAQ
Atlassian Corp Plc Cl A
Comp Sftwr-Spec Enterprs
|
$104.25
|
+0.04
0.04% |
$105.06
|
1,094,957
63.77% of 50 DAV
50 DAV is 1,717,000
|
$111.76
-6.72%
|
1/7/2019
|
$94.68
|
PP = $98.31
|
|
MB = $103.23
|
Most Recent Note - 3/4/2019 8:26:25 PM
G - Loss today came with above average volume after wedging to new all-time highs with recent gains lacking great volume conviction. Color code is changed to green after finishing the session back above its "max buy" level. Prior high ($98.21) and 50 DMA line ($96.57) define near-term support to watch on pullbacks. Fundamentals remain strong. See the latest FSU analysis for more details and a new annotated graph.
>>> FEATURED STOCK ARTICLE : Pullback on Higher Volume After Recent Gains With Less Volume - 3/4/2019 |
View all notes |
Set NEW NOTE alert |
Company Profile |
SEC
News |
Chart |
Request a new note
C
A
S
I |
GLOB
-
NYSE
Globant SA
Computer-Tech Services
|
$68.64
|
-0.56
-0.81% |
$69.50
|
132,818
59.56% of 50 DAV
50 DAV is 223,000
|
$74.00
-7.24%
|
2/15/2019
|
$69.35
|
PP = $70.00
|
|
MB = $73.50
|
Most Recent Note - 3/6/2019 5:56:33 PM
Y - Pulled back today with higher (near average) volume than the prior session. Still sputtering since recently rallying from an advanced "3-weeks tight" base. Prior low ($65.73 on 2/08/19) defines near-term support above its 50 DMA line ($64.68).
>>> FEATURED STOCK ARTICLE : Volume-Driven Gain From Advanced "3-Weeks Tight" Base - 2/15/2019 |
View all notes |
Set NEW NOTE alert |
Company Profile |
SEC
News |
Chart |
Request a new note
C
A
S
I |
TTD
-
NASDAQ
The Trade Desk Inc Cl A
Comml Svcs-Advertising
|
$194.35
|
+5.55
2.94% |
$194.76
|
1,681,038
125.17% of 50 DAV
50 DAV is 1,343,000
|
$202.30
-3.93%
|
2/6/2019
|
$148.65
|
PP = $149.00
|
|
MB = $156.45
|
Most Recent Note - 3/6/2019 3:54:49 PM
G - Consolidating near its all-time high, well above its "max buy" level. Prior high ($161) defines initial support to watch. Bullish action came after it recently reported earnings +102% on +56% sales revenues for the Dec '18 quarter.
>>> FEATURED STOCK ARTICLE : Near High After Third Consecutive Gain with Light Volume - 2/12/2019 |
View all notes |
Set NEW NOTE alert |
Company Profile |
SEC
News |
Chart |
Request a new note
C
A
S
I |
Symbol/Exchange
Company Name
Industry Group |
PRICE |
CHANGE
(%Change) |
Day High |
Volume
(% DAV)
(% 50 day avg vol) |
52 Wk Hi
% From Hi |
Featured
Date |
Price
Featured |
Pivot Featured |
|
Max Buy |
|
|
|
THESE ARE NOT BUY RECOMMENDATIONS!
Comments contained in the body of this report are technical
opinions only. The material herein has been obtained
from sources believed to be reliable and accurate, however,
its accuracy and completeness cannot be guaranteed.
This site is not an investment advisor, hence it does
not endorse or recommend any securities or other investments.
Any recommendation contained in this report may not
be suitable for all investors and it is not to be deemed
an offer or solicitation on our part with respect to
the purchase or sale of any securities. All trademarks,
service marks and trade names appearing in this report
are the property of their respective owners, and are
likewise used for identification purposes only.
This report is a service available
only to active Paid Premium Members.
You may opt-out of receiving report notifications
at any time. Questions or comments may be submitted
by writing to Premium Membership Services 665 S.E. 10 Street, Suite 201 Deerfield Beach, FL 33441-5634 or by calling 1-800-965-8307
or 954-785-1121.
|
|
|