You are not logged in.
This means you
CAN ONLY VIEW reports that were published prior to Monday, February 26, 2024.
You
MUST UPGRADE YOUR MEMBERSHIP if you want to see any current reports.
AFTER MARKET UPDATE - WEDNESDAY, MARCH 6TH, 2019
Previous After Market Report Next After Market Report >>>
|
|
|
|
DOW |
-133.17 |
25,673.46 |
-0.52% |
|
Volume |
881,228,270 |
+2% |
|
Volume |
2,237,721,530 |
+3% |
|
NASDAQ |
-70.44 |
7,505.92 |
-0.93% |
|
Advancers |
763 |
26% |
|
Advancers |
653 |
21% |
|
S&P 500 |
-18.20 |
2,771.45 |
-0.65% |
|
Decliners |
2,186 |
74% |
|
Decliners |
2,426 |
79% |
|
Russell 2000 |
-31.46 |
1,536.82 |
-2.01% |
|
52 Wk Highs |
60 |
|
|
52 Wk Highs |
32 |
|
|
S&P 600 |
-19.05 |
945.78 |
-1.97% |
|
52 Wk Lows |
33 |
|
|
52 Wk Lows |
37 |
|
|
 |
Breadth Negative and Leadership Thin as Major Indices Fell
Kenneth J. Gruneisen - Passed the CAN SLIM® Master's Exam
The Dow fell 133 points to 25,673 while the S&P 500 lost 18 points to 2,771. The Nasdaq Composite slipped 70 points to 7,505. The volume totals reported were higher than the prior session totals on the NYSE and on the Nasdaq exchange. Breadth was clearly negative as decliners led advancers by a 3-1 margin on the NYSE and nearly 4-1 on the Nasdaq exchange. Leadership thinned as there were 11 high-ranked companies from the Leaders List that made a new 52-week high and were listed on the BreakOuts Page, versus the total of 19 on the prior session. New 52-week highs outnumbered new 52-week lows on the NYSE but new lows outnumbered new highs on the Nasdaq exchange. The major indices are in a confirmed uptrend (M criteria) while healthy leadership has underpinned the market. The Featured Stocks Page provides the most timely analysis on high-ranked leaders. Charts used courtesy of www.stockcharts.com
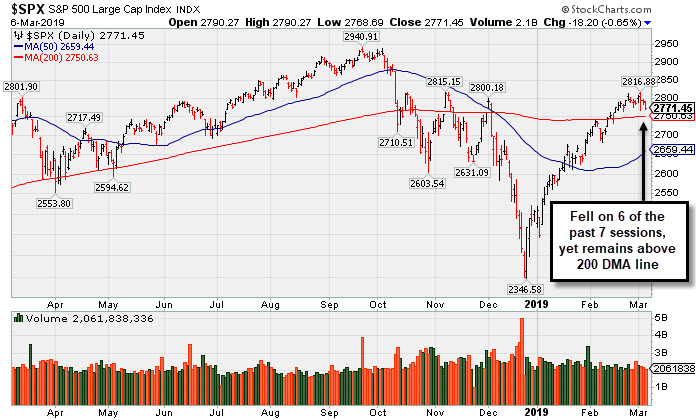
PICTURED: The S&P 500 Index fell on 6 of the past 7 sessions, yet remains above its 200-day moving average (DMA) line and -5.8% off its record high.
The major averages extended losses for a third consecutive day as investors digested economic data updates. A report showed that the U.S. trade deficit widened to a 10-year high of $59.8 billion in December, capping a record annual deficit in 2018. An employment gauge from ADP revealed private payrolls increased 183,000 in February, below expectations of a 190,000 gain. In central bank news, the Federal Reserve’s Beige Book showed most of the Fed districts expanded at a “slight-to-moderate” pace.
Nine of 11 S&P 500 sectors finished in negative territory with the Healthcare and Energy groups leading the decline. Shares of Pfizer (PFE -2.40%) and Exxon Mobil (XOM -1.13%) fell. Materials stocks outperformed with chemical maker LyondellBasell (LYB +6.11%) rising. In corporate news, shares of General Electric (GE -7.89%) extended its recent decline, falling after comments from a key analyst. On the earnings front, Brown-Forman (BFA -3.99%) fell after the alcoholic spirit distributor missed analyst revenue projections.
Treasuries strengthened, with the yield on the 10-year note down three basis point to 2.69%. In commodities, NYMEX WTI crude fell 0.6% to $56.23/barrel. COMEX gold added 0.3% to $1,288.40/ounce despite a stronger dollar. |
 Kenneth J. Gruneisen started out as a licensed stockbroker in August 1987, a couple of months prior to the historic stock market crash that took the Dow Jones Industrial Average down -22.6% in a single day. He has published daily fact-based fundamental and technical analysis on high-ranked stocks online for two decades. Through FACTBASEDINVESTING.COM, Kenneth provides educational articles, news, market commentary, and other information regarding proven investment systems that work in good times and bad.
Comments contained in the body of this report are technical opinions only and are not necessarily those of Gruneisen Growth Corp. The material herein has been obtained from sources believed to be reliable and accurate, however, its accuracy and completeness cannot be guaranteed. Our firm, employees, and customers may effect transactions, including transactions contrary to any recommendation herein, or have positions in the securities mentioned herein or options with respect thereto. Any recommendation contained in this report may not be suitable for all investors and it is not to be deemed an offer or solicitation on our part with respect to the purchase or sale of any securities. |
|
 |
Tech, Financial, and Commodity-Linked Groups Led Decliners
Kenneth J. Gruneisen - Passed the CAN SLIM® Master's Exam
The Bank Index ($BKX -1.22%) and Broker/Dealer Index ($XBD -1.17%) bother outpaced the Retail Index ($RLX -0.56%) to the downside. The tech sector had a negative bias as the Biotech Index ($BTK -2.92%) and Semiconductor Index ($SOX -1.70%) both suffered larger losses and the Networking Index ($NWX -0.45%) also edged lower. Commodity-linked groups also slumped as the Gold & Silver Index ($XAU -2.35%) and Oil Services Index ($OSX -3.24%) both outpaced the Integrated Oil Index ($XOI -1.13%) to the downside.
Charts courtesy of www.stockcharts.com
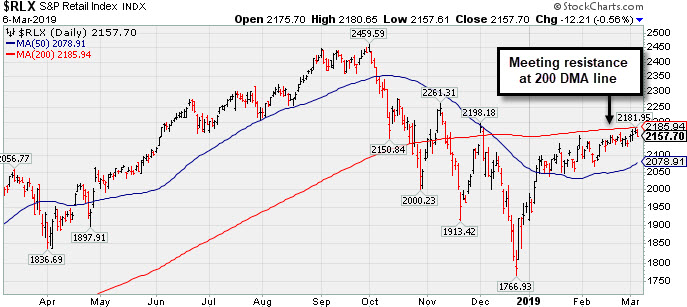 PICTURED: The Retail Index ($RLX -0.56%) has been recently meeting resistance at its 200-day moving average (DMA line.
| Oil Services |
$OSX |
92.59 |
-3.10 |
-3.24% |
+14.88% |
| Integrated Oil |
$XOI |
1,290.54 |
-14.75 |
-1.13% |
+11.34% |
| Semiconductor |
$SOX |
1,333.82 |
-23.08 |
-1.70% |
+15.47% |
| Networking |
$NWX |
576.80 |
-2.64 |
-0.45% |
+18.03% |
| Broker/Dealer |
$XBD |
261.90 |
-3.11 |
-1.17% |
+10.35% |
| Retail |
$RLX |
2,157.70 |
-12.21 |
-0.56% |
+10.57% |
| Gold & Silver |
$XAU |
73.15 |
-1.76 |
-2.35% |
+3.52% |
| Bank |
$BKX |
98.63 |
-1.22 |
-1.22% |
+14.97% |
| Biotech |
$BTK |
4,910.45 |
-147.49 |
-2.92% |
+16.34% |
|
|
|
 |
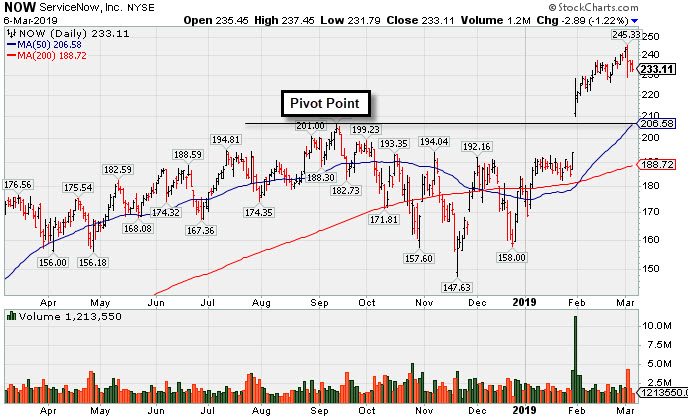
Pulling Back After 6 Straight Weekly Gains
Kenneth J. Gruneisen - Passed the CAN SLIM® Master's Exam
ServiceNow Inc (NOW -$2.89 or -1.22% to $233.11) reversed into the red on Monday for a loss on higher volume after wedging to new all-time highs with recent gains lacking great volume. The prior high ($206) defines initial support to watch on pullbacks.
It was highlighted in yellow with pivot point cited based on its 9/13/18 high plus 10 cents when highlighted in the 1/31/19 mid-day report (read here) as it triggered a technical buy signal with a big "breakaway gap". Bullish action came after it reported earnings +79% on +30% sales revenues for the Dec '18 quarter, continuing its strong earnings track record. Prior quarterly comparisons were above the +25% minimum earnings guideline (C criteria). Annual earnings (A criteria) growth has been strong since FY '15. It has the highest possible Earnings Per Share Rating of 99. The Computer Software - Enterprise group has a Group Relative Strength Rating of 97, a reassuring sign concerning the L criteria.
It went through a deep consolidation since last shown in this FSU section on 2/01/19 with an annotated graph under the headline, "Breakaway Gap Followed Strong Earnings Report".The number of top-rated funds owning its shares rose from 1,030 in Jun '17 to 1,431 in Dec '18, a reassuring sign concerning the I criteria. It has a Timeliness Rating of A and a Sponsorship Rating of B. |
|
|
Color Codes Explained :
Y - Better candidates highlighted by our
staff of experts.
G - Previously featured
in past reports as yellow but may no longer be buyable under the
guidelines.
***Last / Change / Volume data in this table is the closing quote data***
Symbol/Exchange
Company Name
Industry Group |
PRICE |
CHANGE
(%Change) |
Day High |
Volume
(% DAV)
(% 50 day avg vol) |
52 Wk Hi
% From Hi |
Featured
Date |
Price
Featured |
Pivot Featured |
|
Max Buy |
MLR
-
NYSE
Miller Industries Inc
AUTOMOTIVE - Auto Parts
|
$34.16
|
-0.68
-1.95% |
$34.81
|
54,188
164.21% of 50 DAV
50 DAV is 33,000
|
$35.26
-3.12%
|
11/30/2018
|
$28.35
|
PP = $29.50
|
|
MB = $30.98
|
Most Recent Note - 3/4/2019 8:37:24 PM
G - Hit another new high with today's volume-driven gain adding to an impressive streak of gains. Prior highs and its 50 DMA line ($29.71) define near-term support to watch on pullbacks. See the latest FSU analysis for more details and an annotated graph.
>>> FEATURED STOCK ARTICLE : Extended From Prior Base After Impressive Streak of Gains - 3/1/2019 |
View all notes |
Set NEW NOTE alert |
Company Profile |
SEC
News |
Chart |
Request a new note
C
A
S
I |
NSP
-
NYSE
Insperity Inc
Comml Svcs-Outsourcing
|
$122.13
|
-2.47
-1.98% |
$124.88
|
224,338
61.97% of 50 DAV
50 DAV is 362,000
|
$132.50
-7.83%
|
2/11/2019
|
$127.91
|
PP = $121.25
|
|
MB = $127.31
|
Most Recent Note - 3/4/2019 8:27:52 PM
Y - Quietly consolidating below its "max buy" level. Prior highs in the $119-121 area define initial support to watch on pullbacks.
>>> FEATURED STOCK ARTICLE : Big Breakaway Gap Triggered Technical Buy Signal - 2/11/2019 |
View all notes |
Set NEW NOTE alert |
Company Profile |
SEC
News |
Chart |
Request a new note
C
A
S
I |
ZBRA
-
NASDAQ
Zebra Tech Corp Cl A
COMPUTER HARDWARE - Computer Peripherals
|
$201.24
|
-0.40
-0.20% |
$203.46
|
209,750
41.29% of 50 DAV
50 DAV is 508,000
|
$207.88
-3.19%
|
2/14/2019
|
$198.10
|
PP = $184.85
|
|
MB = $194.09
|
Most Recent Note - 3/5/2019 8:58:51 PM
G - Still stubbornly holding its ground in a tight range near its all-time high with volume totals cooling. Extended from the prior base. Prior highs in the $184 area define initial support to watch on pullbacks.
>>> FEATURED STOCK ARTICLE : Big Volume-Driven Gain for New High - 2/14/2019 |
View all notes |
Set NEW NOTE alert |
Company Profile |
SEC
News |
Chart |
Request a new note
C
A
S
I |
SPSC
-
NASDAQ
S P S Commerce Inc
COMPUTER SOFTWARE and SERVICES - Application Software
|
$105.40
|
-1.47
-1.38% |
$107.23
|
95,438
57.15% of 50 DAV
50 DAV is 167,000
|
$113.31
-6.98%
|
2/13/2019
|
$104.30
|
PP = $100.78
|
|
MB = $105.82
|
 Most Recent Note - 3/6/2019 6:01:26 PM
Y - Color code is changed to yellow after pulling back below its "max buy" level with today's loss on light volume. Prior highs in the $100 area define initial support to watch.
>>> FEATURED STOCK ARTICLE : Gap Up and Big Volume Driven Gain for New High - 2/13/2019 |
View all notes |
Set NEW NOTE alert |
Company Profile |
SEC
News |
Chart |
Request a new note
C
A
S
I |
SSNC
-
NASDAQ
S S & C Technologies
COMPUTER SOFTWARE and SERVICES - Application Software
|
$61.63
|
-0.63
-1.01% |
$62.49
|
2,259,204
119.41% of 50 DAV
50 DAV is 1,892,000
|
$64.36
-4.24%
|
2/15/2019
|
$59.73
|
PP = $61.07
|
|
MB = $64.12
|
Most Recent Note - 3/6/2019 6:04:30 PM
Y - Pulled back today for a small loss with higher volume. Holding its ground since a 3/01/19 gain above its pivot point backed by +49% above average volume triggered a technical buy signal.
>>> FEATURED STOCK ARTICLE : Volume-Driven Gain for New High Close - 2/19/2019 |
View all notes |
Set NEW NOTE alert |
Company Profile |
SEC
News |
Chart |
Request a new note
C
A
S
I |
Symbol/Exchange
Company Name
Industry Group |
PRICE |
CHANGE
(%Change) |
Day High |
Volume
(% DAV)
(% 50 day avg vol) |
52 Wk Hi
% From Hi |
Featured
Date |
Price
Featured |
Pivot Featured |
|
Max Buy |
IRBT
-
NASDAQ
Irobot Corp
CONSUMER DURABLES - Electronic Equipment
|
$124.74
|
-4.62
-3.57% |
$129.07
|
837,755
102.04% of 50 DAV
50 DAV is 821,000
|
$132.88
-6.13%
|
2/8/2019
|
$104.92
|
PP = $103.63
|
|
MB = $108.81
|
Most Recent Note - 3/6/2019 5:58:37 PM
G - Pulled back today with higher (near average) volume. There was a "negative reversal" on the prior session after quietly touching another new all-time high. Recent gains have lacked great volume conviction. It is extended from the previously noted "double bottom" base. Prior high ($103) defines initial support to watch on pullbacks.
>>> FEATURED STOCK ARTICLE : Volume-Driven Gains Cleared Prior High After Double Bottom - 2/8/2019 |
View all notes |
Set NEW NOTE alert |
Company Profile |
SEC
News |
Chart |
Request a new note
C
A
S
I |
LHCG
-
NASDAQ
L H C Group Inc
HEALTH SERVICES - Home Health Care
|
$105.35
|
-2.77
-2.56% |
$108.31
|
201,510
76.62% of 50 DAV
50 DAV is 263,000
|
$114.22
-7.77%
|
1/23/2019
|
$107.29
|
PP = $107.61
|
|
MB = $112.99
|
Most Recent Note - 3/5/2019 8:53:38 PM
Y - Hovering near its all-time high with volume totals cooling. Bullish action came after it reported earnings +66% on +75% sales revenues for the Dec '18 quarter.
>>> FEATURED STOCK ARTICLE : Recent Gains for New Highs Lacked Great Volume Conviction - 2/21/2019 |
View all notes |
Set NEW NOTE alert |
Company Profile |
SEC
News |
Chart |
Request a new note
C
A
S
I |
ENSG
-
NASDAQ
Ensign Group Inc
HEALTH SERVICES - Long-Term Care Facilities
|
$48.32
|
-1.81
-3.61% |
$50.37
|
286,161
80.61% of 50 DAV
50 DAV is 355,000
|
$54.56
-11.44%
|
2/7/2019
|
$48.71
|
PP = $49.06
|
|
MB = $51.51
|
Most Recent Note - 3/6/2019 3:56:24 PM
Y - Pulling back on light volume, consolidating near prior highs in the $48 area defining initial support to watch.
>>> FEATURED STOCK ARTICLE : Closed Near Pivot Point After Gap Up and Big Volume-Driven Gain - 2/7/2019 |
View all notes |
Set NEW NOTE alert |
Company Profile |
SEC
News |
Chart |
Request a new note
C
A
S
I |
NXST
-
NASDAQ
Nexstar Media Group Cl A
MEDIA - Broadcasting - TV
|
$103.21
|
+0.71
0.69% |
$104.03
|
492,948
83.98% of 50 DAV
50 DAV is 587,000
|
$103.75
-0.52%
|
2/26/2019
|
$94.26
|
PP = $89.76
|
|
MB = $94.25
|
Most Recent Note - 3/6/2019 6:07:02 PM
G - Posted a small gain on light volume today hitting another new all-time high. Disciplined investors avoid chasing stocks more than +5% above the prior high.
>>> FEATURED STOCK ARTICLE : Twice Average Volume Behind Gain for New High - 2/26/2019 |
View all notes |
Set NEW NOTE alert |
Company Profile |
SEC
News |
Chart |
Request a new note
C
A
S
I |
BSTC
-
NASDAQ
Biospecifics Technologie
Medical-Biomed/Biotech
|
$67.31
|
-1.79
-2.59% |
$69.70
|
40,576
90.17% of 50 DAV
50 DAV is 45,000
|
$73.31
-8.18%
|
1/18/2019
|
$67.40
|
PP = $66.31
|
|
MB = $69.63
|
Most Recent Note - 3/5/2019 9:02:16 PM
Y - Color code is changed to yellow after pulling back below its "max buy" level with today's loss on lighter than average volume. Prior highs and its 50 DMA line define near-term support to watch on pullbacks.
>>> FEATURED STOCK ARTICLE : Reversed Into Red After Hitting a New High - 2/5/2019 |
View all notes |
Set NEW NOTE alert |
Company Profile |
SEC
News |
Chart |
Request a new note
C
A
S
I |
Symbol/Exchange
Company Name
Industry Group |
PRICE |
CHANGE
(%Change) |
Day High |
Volume
(% DAV)
(% 50 day avg vol) |
52 Wk Hi
% From Hi |
Featured
Date |
Price
Featured |
Pivot Featured |
|
Max Buy |
UBNT
-
NASDAQ
Ubiquiti Networks
TELECOMMUNICATIONS - Diversified Communication Serv
|
$141.37
|
-2.60
-1.81% |
$143.68
|
277,272
72.58% of 50 DAV
50 DAV is 382,000
|
$148.68
-4.92%
|
2/8/2019
|
$121.97
|
PP = $115.54
|
|
MB = $121.32
|
Most Recent Note - 3/5/2019 8:49:08 PM
G - Stubbornly holding its ground perched near its all-time high, very extended from the prior base. Fundamentals remain strong. Prior high ($115) defines initial support to watch on pullbacks. See the latest FSU analysis for more details and a new annotated graph.
>>> FEATURED STOCK ARTICLE : Bullish Action Came Following Another Strong Earnings Report - 3/5/2019 |
View all notes |
Set NEW NOTE alert |
Company Profile |
SEC
News |
Chart |
Request a new note
C
A
S
I |
NOW
-
NYSE
Servicenow Inc
Computer Sftwr-Enterprse
|
$233.11
|
-2.89
-1.22% |
$237.45
|
1,213,536
53.86% of 50 DAV
50 DAV is 2,253,000
|
$245.33
-4.98%
|
1/31/2019
|
$218.14
|
PP = $206.40
|
|
MB = $216.72
|
Most Recent Note - 3/6/2019 5:53:13 PM
G - Down today with lighter volume. Prior high ($206) defines initial support to watch on pullbacks. See the latest FSU analysis for more details and a new annotated graph.
>>> FEATURED STOCK ARTICLE : Pulling Back After 6 Straight Weekly Gains - 3/6/2019 |
View all notes |
Set NEW NOTE alert |
Company Profile |
SEC
News |
Chart |
Request a new note
C
A
S
I |
PANW
-
NYSE
Palo Alto Networks
Computer Sftwr-Security
|
$234.44
|
+0.10
0.04% |
$237.21
|
1,390,304
93.75% of 50 DAV
50 DAV is 1,483,000
|
$260.63
-10.05%
|
2/25/2019
|
$233.54
|
PP = $239.60
|
|
MB = $251.58
|
Most Recent Note - 3/5/2019 8:51:02 PM
Y - Pulled back today on higher volume for a 4th consecutive loss, slumping below its pivot point and into the prior base raising concerns. Reported earnings +44% on +30% sales revenues for the Jan '19 quarter, continuing its strong earnings track record.
>>> FEATURED STOCK ARTICLE : Rebounded Near Prior High With Earnings News Due - 2/25/2019 |
View all notes |
Set NEW NOTE alert |
Company Profile |
SEC
News |
Chart |
Request a new note
C
A
S
I |
PAYC
-
NYSE
Paycom Software Inc
COMPUTER SOFTWARE and SERVICES - Application Software
|
$175.64
|
-2.93
-1.64% |
$178.99
|
657,280
100.81% of 50 DAV
50 DAV is 652,000
|
$186.00
-5.57%
|
2/6/2019
|
$171.66
|
PP = $164.18
|
|
MB = $172.39
|
Most Recent Note - 3/4/2019 12:27:33 PM
G - Pulling back today with higher volume, encountering distributional pressure. Volume totals had been cooling while hovering near its all-time high, extended from any sound base. Prior high ($164) defines initial support to watch above its 50 DMA line.
>>> FEATURED STOCK ARTICLE : Breakaway Gap Backed by Volume +388% Above Average - 2/6/2019 |
View all notes |
Set NEW NOTE alert |
Company Profile |
SEC
News |
Chart |
Request a new note
C
A
S
I |
PYPL
-
NASDAQ
Paypal Holdings Inc
Finance-CrdtCard/PmtPr
|
$96.46
|
-0.07
-0.07% |
$97.28
|
3,126,807
36.74% of 50 DAV
50 DAV is 8,510,000
|
$99.45
-3.01%
|
1/24/2019
|
$92.56
|
PP = $93.80
|
|
MB = $98.49
|
Most Recent Note - 3/4/2019 8:32:15 PM
Y - Pulled back today with higher (near average) volume. Recent gains into new high territory came with light volume, not indicative of great institutional buying demand. Prior highs in the $92 area define support above its 50 DMA line ($90.54).
>>> FEATURED STOCK ARTICLE : Wedging into New High Territory With Gains Lacking Volume - 2/22/2019 |
View all notes |
Set NEW NOTE alert |
Company Profile |
SEC
News |
Chart |
Request a new note
C
A
S
I |
Symbol/Exchange
Company Name
Industry Group |
PRICE |
CHANGE
(%Change) |
Day High |
Volume
(% DAV)
(% 50 day avg vol) |
52 Wk Hi
% From Hi |
Featured
Date |
Price
Featured |
Pivot Featured |
|
Max Buy |
ALRM
-
NASDAQ
Alarm.com Holdings Inc
Security/Sfty
|
$57.63
|
-1.59
-2.68% |
$59.65
|
698,134
120.99% of 50 DAV
50 DAV is 577,000
|
$65.85
-12.48%
|
1/22/2019
|
$60.52
|
PP = $60.30
|
|
MB = $63.32
|
Most Recent Note - 3/5/2019 9:00:57 PM
G - Rebounded above its 50 DMA line ($58.84) with today's big gain. Weak action came after it reported earnings +12% on +25% sales revenues for the Dec '18 quarter, below the +25% minimum earnings guideline (C criteria), raising fundamental concerns.
>>> FEATURED STOCK ARTICLE : Volume Totals Cooling While Perched at All-Time High - 2/20/2019 |
View all notes |
Set NEW NOTE alert |
Company Profile |
SEC
News |
Chart |
Request a new note
C
A
S
I |
PLNT
-
NYSE
Planet Fitness Inc Cl A
Leisure-Services
|
$63.78
|
+0.16
0.25% |
$64.50
|
2,081,785
142.30% of 50 DAV
50 DAV is 1,463,000
|
$63.93
-0.23%
|
11/7/2018
|
$57.10
|
PP = $55.45
|
|
MB = $58.22
|
Most Recent Note - 3/6/2019 6:09:35 PM
G - Posted a 7th consecutive gain today with above average volume hitting another new all-time high. Rallying after testing support at its 50 DMA line ($57.37) last week. Reported earnings +42% on +30% sales revenues for the Dec '18 quarter.
>>> FEATURED STOCK ARTICLE : Met Distributional Pressure While Hitting New High After Earnings - 2/27/2019 |
View all notes |
Set NEW NOTE alert |
Company Profile |
SEC
News |
Chart |
Request a new note
C
A
S
I |
TEAM
-
NASDAQ
Atlassian Corp Plc Cl A
Comp Sftwr-Spec Enterprs
|
$103.50
|
-0.93
-0.89% |
$105.00
|
855,527
47.66% of 50 DAV
50 DAV is 1,795,000
|
$111.76
-7.39%
|
1/7/2019
|
$94.68
|
PP = $98.31
|
|
MB = $103.23
|
Most Recent Note - 3/4/2019 8:26:25 PM
G - Loss today came with above average volume after wedging to new all-time highs with recent gains lacking great volume conviction. Color code is changed to green after finishing the session back above its "max buy" level. Prior high ($98.21) and 50 DMA line ($96.57) define near-term support to watch on pullbacks. Fundamentals remain strong. See the latest FSU analysis for more details and a new annotated graph.
>>> FEATURED STOCK ARTICLE : Pullback on Higher Volume After Recent Gains With Less Volume - 3/4/2019 |
View all notes |
Set NEW NOTE alert |
Company Profile |
SEC
News |
Chart |
Request a new note
C
A
S
I |
GLOB
-
NYSE
Globant SA
Computer-Tech Services
|
$69.11
|
-2.01
-2.83% |
$71.31
|
186,202
79.23% of 50 DAV
50 DAV is 235,000
|
$74.00
-6.61%
|
2/15/2019
|
$69.35
|
PP = $70.00
|
|
MB = $73.50
|
Most Recent Note - 3/6/2019 5:56:33 PM
Y - Pulled back today with higher (near average) volume than the prior session. Still sputtering since recently rallying from an advanced "3-weeks tight" base. Prior low ($65.73 on 2/08/19) defines near-term support above its 50 DMA line ($64.68).
>>> FEATURED STOCK ARTICLE : Volume-Driven Gain From Advanced "3-Weeks Tight" Base - 2/15/2019 |
View all notes |
Set NEW NOTE alert |
Company Profile |
SEC
News |
Chart |
Request a new note
C
A
S
I |
TTD
-
NASDAQ
The Trade Desk Inc Cl A
Comml Svcs-Advertising
|
$186.35
|
-4.88
-2.55% |
$190.50
|
1,310,715
96.09% of 50 DAV
50 DAV is 1,364,000
|
$202.30
-7.88%
|
2/6/2019
|
$148.65
|
PP = $149.00
|
|
MB = $156.45
|
Most Recent Note - 3/6/2019 3:54:49 PM
G - Consolidating near its all-time high, well above its "max buy" level. Prior high ($161) defines initial support to watch. Bullish action came after it recently reported earnings +102% on +56% sales revenues for the Dec '18 quarter.
>>> FEATURED STOCK ARTICLE : Near High After Third Consecutive Gain with Light Volume - 2/12/2019 |
View all notes |
Set NEW NOTE alert |
Company Profile |
SEC
News |
Chart |
Request a new note
C
A
S
I |
Symbol/Exchange
Company Name
Industry Group |
PRICE |
CHANGE
(%Change) |
Day High |
Volume
(% DAV)
(% 50 day avg vol) |
52 Wk Hi
% From Hi |
Featured
Date |
Price
Featured |
Pivot Featured |
|
Max Buy |
|
|
|
THESE ARE NOT BUY RECOMMENDATIONS!
Comments contained in the body of this report are technical
opinions only. The material herein has been obtained
from sources believed to be reliable and accurate, however,
its accuracy and completeness cannot be guaranteed.
This site is not an investment advisor, hence it does
not endorse or recommend any securities or other investments.
Any recommendation contained in this report may not
be suitable for all investors and it is not to be deemed
an offer or solicitation on our part with respect to
the purchase or sale of any securities. All trademarks,
service marks and trade names appearing in this report
are the property of their respective owners, and are
likewise used for identification purposes only.
This report is a service available
only to active Paid Premium Members.
You may opt-out of receiving report notifications
at any time. Questions or comments may be submitted
by writing to Premium Membership Services 665 S.E. 10 Street, Suite 201 Deerfield Beach, FL 33441-5634 or by calling 1-800-965-8307
or 954-785-1121.
|
|
|