You are not logged in.
This means you
CAN ONLY VIEW reports that were published prior to Monday, April 14, 2025.
You
MUST UPGRADE YOUR MEMBERSHIP if you want to see any current reports.
AFTER MARKET UPDATE - MONDAY, MARCH 3RD, 2014
Previous After Market Report Next After Market Report >>>
|
|
|
|
DOW |
-153.68 |
16,168.03 |
-0.94% |
|
Volume |
670,710,880 |
-29% |
|
Volume |
1,942,237,210 |
-17% |
|
NASDAQ |
-30.82 |
4,277.30 |
-0.72% |
|
Advancers |
1,009 |
32% |
|
Advancers |
967 |
36% |
|
S&P 500 |
-13.72 |
1,845.73 |
-0.74% |
|
Decliners |
2,009 |
64% |
|
Decliners |
1,631 |
61% |
|
Russell 2000 |
-6.67 |
1,176.36 |
-0.56% |
|
52 Wk Highs |
80 |
|
|
52 Wk Highs |
66 |
|
|
S&P 600 |
-3.92 |
663.41 |
-0.59% |
|
52 Wk Lows |
19 |
|
|
52 Wk Lows |
20 |
|
|
 |
Leadership Waned and Major Averages Fell Amid Global Tensions
Kenneth J. Gruneisen - Passed the CAN SLIM® Master's Exam
The major averages ended were mostly lower on Monday, kicking off March on a down note. The volume totals were reported lighter than the prior session's volume totals on the NYSE and on the Nasdaq. Breadth was negative as decliners led advancers by a 2-1 ratio on the NYSE and nearly as much on the Nasdaq exchange. There were 17 high-ranked companies from the CANSLIM.net Leaders List that made new 52-week highs and appeared on the CANSLIM.net BreakOuts Page, down abruptly from the total of 75 stocks on the prior session. The list of stocks hitting new 52-week highs easily outnumbered new 52-week lows on the Nasdaq exchange and on the NYSE. There were gains for only 2 of the 10 high-ranked companies currently included on the Featured Stocks Page. The Market (M criteria) environment has been noted as a "Confirmed Uptrend". For any rally to be sustained it is critical for there to be healthy leadership, so it remains crucial for many stocks to continue hitting new 52-week highs.
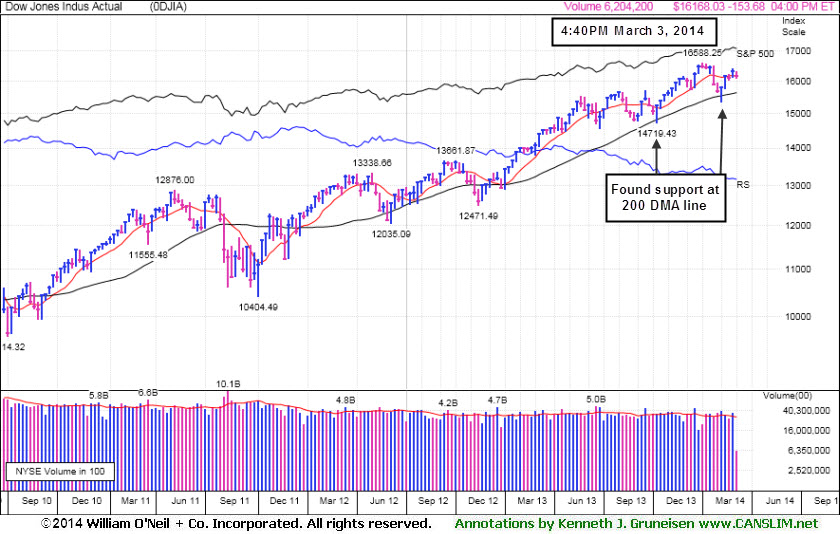
The Dow lost 153 points to 16,168 and the S&P 500 Index fell from an all-time high as it dropped 13 points to 1845. The NASDAQ declined 30 points to 4,277. Equities retreated amid concerns surrounding a potential military conflict in Europe after Russia seized control over the Ukrainian peninsula Crimea. Russia's move prompted the U.S. to warn Vladimir Putin that his nation could face economic sanctions. With the spotlight on Ukraine, positive economic data was overlooked. The ISM reported U.S. manufacturing activity accelerated more than anticipated this month while consumer spending and income figures for January also topped analyst projections.
Overall, every sector closed in negative territory. Financials and technology paced the retreat as JP Morgan Chase & Co (JPM -1.3%) and Qualcomm (QCOM -2%) fell. Exxon Mobil (XOM -1%) was lower as energy and consumer stocks were also under pressure. Ford (F -1.2%) fell after the automaker posted disappointing vehicle sales.
Treasury prices jumped as investors turned to the perceived safety of government paper. The 10-year note gained 13/32 to yield 2.60%. The 30-year bond rose 17/32 to yield 3.55%.
The CANSLIM.net Featured Stocks Page shows the most action-worthy candidates and their latest notes and a Headline Link directs members to the latest detailed analysis with data-packed graphs annotated by a Certified expert along with links to additional resources. The Premium Member Homepage includes "dynamic archives" to all prior pay reports published. Watch for an announcement via email concerning the next WEBCAST.
PICTURED: The Dow Jones Industrial Average is perched -2.5% off its all-time high. It found support near its 200-day moving average (DMA) line on recent pullbacks.
|
 Kenneth J. Gruneisen started out as a licensed stockbroker in August 1987, a couple of months prior to the historic stock market crash that took the Dow Jones Industrial Average down -22.6% in a single day. He has published daily fact-based fundamental and technical analysis on high-ranked stocks online for two decades. Through FACTBASEDINVESTING.COM, Kenneth provides educational articles, news, market commentary, and other information regarding proven investment systems that work in good times and bad.
Comments contained in the body of this report are technical opinions only and are not necessarily those of Gruneisen Growth Corp. The material herein has been obtained from sources believed to be reliable and accurate, however, its accuracy and completeness cannot be guaranteed. Our firm, employees, and customers may effect transactions, including transactions contrary to any recommendation herein, or have positions in the securities mentioned herein or options with respect thereto. Any recommendation contained in this report may not be suitable for all investors and it is not to be deemed an offer or solicitation on our part with respect to the purchase or sale of any securities. |
|
 |
Biotechnology and Gold & Silver Indexes Rose
Kenneth J. Gruneisen - Passed the CAN SLIM® Master's Exam
The Biotechnology Index ($BTK +0.49%) and the Gold & Silver Index ($XAU +1.46%) were gainers while most industry groups finished lower on Monday. Financial shares were a negative influence as the Broker/Dealer Index ($XBD -1.36%) and the Bank Index ($BKX -1.07%) lost ground. The Oil Services Index ($OSX -0.99%) and the Integrated Oil Index ($XOI -0.69%) finished with losses. The Networking Index ($NWX -1.11%) and Semiconductor Index ($SOX -0.64%) lost ground and the Retail Index ($RLX -0.45%) also edged lower.
Charts courtesy www.stockcharts.com
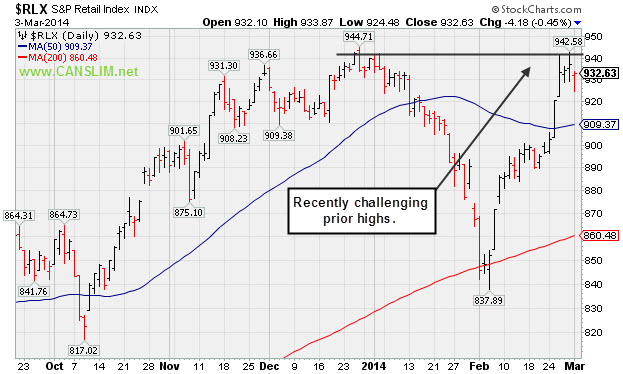
PICTURED: The Retail Index ($RLX -0.45%) has recently been challenging prior highs.
| Oil Services |
$OSX |
277.06 |
-2.78 |
-0.99% |
-1.41% |
| Integrated Oil |
$XOI |
1,464.65 |
-10.12 |
-0.69% |
-2.56% |
| Semiconductor |
$SOX |
560.23 |
-3.60 |
-0.64% |
+4.71% |
| Networking |
$NWX |
342.86 |
-3.86 |
-1.11% |
+5.84% |
| Broker/Dealer |
$XBD |
157.59 |
-2.18 |
-1.36% |
-1.85% |
| Retail |
$RLX |
932.63 |
-4.18 |
-0.45% |
-0.76% |
| Gold & Silver |
$XAU |
101.00 |
+1.45 |
+1.46% |
+20.02% |
| Bank |
$BKX |
68.28 |
-0.74 |
-1.07% |
-1.41% |
| Biotech |
$BTK |
2,828.59 |
+13.88 |
+0.49% |
+21.38% |
|
|
|
 |
Resilient Despite Fundamental Concerns
Kenneth J. Gruneisen - Passed the CAN SLIM® Master's Exam
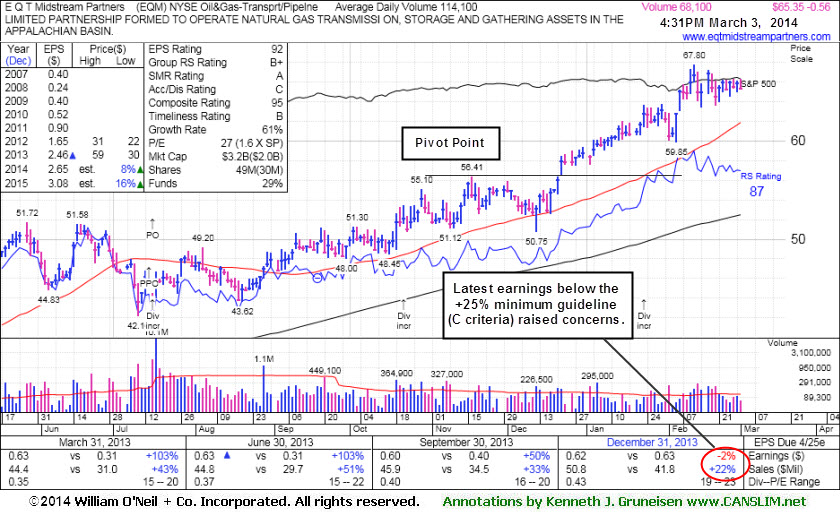
E Q T Midstream Partners (EQM -$0.56 or -0.85% to $65.35) has held its ground stubbornly after recently enduring distributional pressure. It reported earnings -2% on +22% sales revenues for the Dec '13 quarter, below the +25% minimum earnings guideline (C criteria), raising fundamental concerns.
It traded up nearly +20% since first highlighted in yellow in the 12/12/13 mid-day report (read here) with new pivot point cited based on its 11/18/13 high plus 10 cents. The fact-based system suggests watching for technical sell signals rather than selling purely on fundmentals, yet is wise to sometimes lock in gains at the +20% level. For those watching it and still giving it the benefit of the doubt, recent lows in the $63 area define near-term support above its 50-day moving average (DMA) line where subsequent violations may trigger more worrisome technical sell signals.
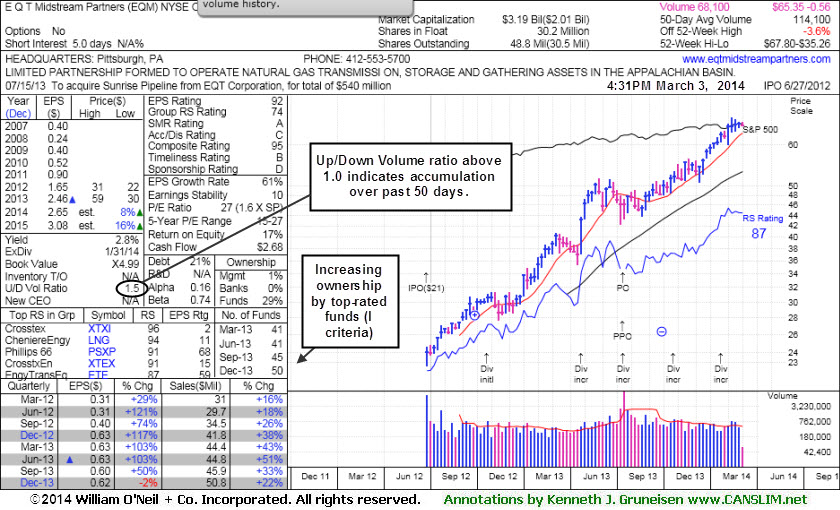
Its last appearance in this FSU section was on 2/07/14 under the headline, "Leader Still Extended From Any Sound Base". It completed a new Public Offering on 7/16/13, then made gradual progress afterward. This MLP in the Natural Gas business has seen the number of top-rated funds owning its shares rise from 20 in Jun '12 to 50 in Dec '13, a reassuring sign concerning the I criteria. Its Up/Down Volume Ratio of 1.5 is an unbiased indication its shares have been under accumulation over the past 50 days.
|
|
|
Color Codes Explained :
Y - Better candidates highlighted by our
staff of experts.
G - Previously featured
in past reports as yellow but may no longer be buyable under the
guidelines.
***Last / Change / Volume data in this table is the closing quote data***
Symbol/Exchange
Company Name
Industry Group |
PRICE |
CHANGE
(%Change) |
Day High |
Volume
(% DAV)
(% 50 day avg vol) |
52 Wk Hi
% From Hi |
Featured
Date |
Price
Featured |
Pivot Featured |
|
Max Buy |
EQM
-
NYSE
E Q T Midstream Partners
ENERGY - Oil and Gas Pipelines
|
$65.50
|
-0.41
-0.62% |
$66.37
|
70,067
61.46% of 50 DAV
50 DAV is 114,000
|
$67.80
-3.39%
|
12/12/2013
|
$53.17
|
PP = $56.51
|
|
MB = $59.34
|
 Most Recent Note - 3/3/2014 5:44:55 PM
G - Stubbornly holding its ground since reporting earnings -2% on +22% sales revenues for the Dec '13 quarter, below the +25% minimum earnings guideline (C criteria), raising fundamental concerns. Its 50 DMA line defines near-term support where a violation may trigger a technical sell signal. See the latest FSU analysis for more details and new annotated graphs.
>>> FEATURED STOCK ARTICLE : Resilient Despite Fundamental Concerns - 3/3/2014
View all notes |
Set NEW NOTE alert |
CANSLIM.net Company Profile |
SEC
News |
Chart |
Request a new note
C
A N
S L
I M


|
FB
-
NASDAQ
Facebook Inc Cl A
INTERNET
|
$67.41
|
-1.05
-1.53% |
$68.05
|
56,698,405
86.57% of 50 DAV
50 DAV is 65,491,000
|
$71.44
-5.64%
|
12/12/2013
|
$51.40
|
PP = $54.93
|
|
MB = $57.68
|
Most Recent Note - 3/3/2014 2:45:51 PM
G - Pulling back on light volume today for a 5th consecutive small loss while retreating from its all-time high. Its 50 DMA line ($60.54 now) defines near-term support to watch.
>>> FEATURED STOCK ARTICLE : High-Ranked Internet Group Leader is Extended From Base - 2/25/2014
View all notes |
Set NEW NOTE alert |
CANSLIM.net Company Profile |
SEC
News |
Chart |
Request a new note
C
A N
S L
I M
|
GNRC
-
NYSE
Generac Hldgs Inc
Electrical-Power/Equipmt
|
$57.49
|
+0.52
0.91% |
$57.65
|
464,569
48.95% of 50 DAV
50 DAV is 949,000
|
$58.48
-1.69%
|
2/14/2014
|
$56.50
|
PP = $57.39
|
|
MB = $60.26
|
Most Recent Note - 3/3/2014 5:39:16 PM
Y - Volume totals have been cooling while consolidating near previously stubborn resistance in the $57 area, while no resistance remains due to overhead supply. Volume should be at least +40% above average as a stock rallies above its pivot point to trigger a proper technical buy signal.
>>> FEATURED STOCK ARTICLE : Following Island Reversal Prior Highs May Act as Resistance - 2/14/2014
View all notes |
Set NEW NOTE alert |
CANSLIM.net Company Profile |
SEC
News |
Chart |
Request a new note
C
A N
S L
I M
|
KORS
-
NYSE
Michael Kors Hldgs Ltd
RETAIL - Apparel Stores
|
$97.98
|
-0.05
-0.05% |
$97.98
|
2,646,151
66.81% of 50 DAV
50 DAV is 3,961,000
|
$101.04
-3.03%
|
2/4/2014
|
$90.92
|
PP = $84.68
|
|
MB = $88.91
|
Most Recent Note - 2/26/2014 3:06:59 PM
G - Perched at its 52-week high after still wedging higher with recent gains lacking great volume conviction, getting very extended from its prior base. Prior highs in the $84 area define the nearest chart support level.
>>> FEATURED STOCK ARTICLE : Extended From Sound Base and Wedging Higher - 2/19/2014
View all notes |
Set NEW NOTE alert |
CANSLIM.net Company Profile |
SEC
News |
Chart |
Request a new note
C
A N
S L
I M
|
LEAF
-
NYSE
Springleaf Holdings Inc
Finance-Consumer Loans
|
$28.09
|
-0.08
-0.28% |
$28.47
|
299,048
87.44% of 50 DAV
50 DAV is 342,000
|
$29.50
-4.78%
|
2/24/2014
|
$28.60
|
PP = $27.44
|
|
MB = $28.81
|
Most Recent Note - 3/3/2014 5:41:03 PM
Y - Pulled back today with below average volume. Prior highs in the $27 area define initial support to watch following its recent technical breakout. Disciplined investors avoid chasing extended stocks more than +5% above prior highs and always limit losses by selling any stock that falls more than -7% from their purchase price. See the annotated daily graph below this note and details with a weekly graph in the latest FSU analysis.

>>> FEATURED STOCK ARTICLE : Breakout Backed by Four Times Average Volume - 2/24/2014
View all notes |
Set NEW NOTE alert |
CANSLIM.net Company Profile |
SEC
News |
Chart |
Request a new note
C
A N
S L
I M
|
Symbol/Exchange
Company Name
Industry Group |
PRICE |
CHANGE
(%Change) |
Day High |
Volume
(% DAV)
(% 50 day avg vol) |
52 Wk Hi
% From Hi |
Featured
Date |
Price
Featured |
Pivot Featured |
|
Max Buy |
PCLN
-
NASDAQ
Priceline.com Inc
INTERNET - Internet Software and Services
|
$1,338.24
|
-10.60
-0.79% |
$1,342.03
|
697,828
90.63% of 50 DAV
50 DAV is 770,000
|
$1,375.41
-2.70%
|
12/18/2013
|
$1,156.20
|
PP = $1,198.85
|
|
MB = $1,258.79
|
Most Recent Note - 3/3/2014 2:47:31 PM
G - Holding its ground near its 52-week high today with volume totals cooling after an impressive streak of gains. Rallied with no resistance due to overhead supply, and it is extended from any sound base.
>>> FEATURED STOCK ARTICLE : Extended From Prior Highs After 6th Straight Gain - 2/13/2014
View all notes |
Set NEW NOTE alert |
CANSLIM.net Company Profile |
SEC
News |
Chart |
Request a new note
C
A N
S L
I M
|
PSIX
-
NASDAQ
Power Solutions Intl Inc
Machinery-Gen Industrial
|
$72.90
|
-1.20
-1.62% |
$75.80
|
46,211
81.07% of 50 DAV
50 DAV is 57,000
|
$78.96
-7.67%
|
2/28/2014
|
$74.65
|
PP = $76.93
|
|
MB = $80.78
|
Most Recent Note - 2/28/2014 6:46:49 PM
Y - Highlighted in yellow with new pivot point cited based on its 2/21/14 high in the earlier mid-day report (read here). Reported earnings +26% on +17% sales revenues for the Dec '13 quarter, its 3rd consecutive quarter with earnings above the +25% minimum guideline (C criteria). Subsequent volume-driven gains above the pivot point may trigger a technical buy signal from a cup-with-handle base. See the latest FSU analysis for more details and a new annotated weekly graph.

>>> FEATURED STOCK ARTICLE : Earnings Solid and Forming a Cup-With-Handle - 2/28/2014
View all notes |
Set NEW NOTE alert |
CANSLIM.net Company Profile |
SEC
News |
Chart |
Request a new note
C
A N
S L
I M
|
SILC
-
NASDAQ
Silicom Ltd
COMPUTER HARDWARE - Networking andamp; Communication Dev
|
$71.94
|
+0.26
0.36% |
$72.09
|
81,833
109.11% of 50 DAV
50 DAV is 75,000
|
$72.18
-0.33%
|
12/23/2013
|
$44.62
|
PP = $46.25
|
|
MB = $48.56
|
Most Recent Note - 2/27/2014 2:10:24 PM
G - Extended from any sound base and on track for an 11th consecutive weekly gain. Patient investors may watch for a new base or secondary buy point to possibly develop and be noted in the weeks ahead.
>>> FEATURED STOCK ARTICLE : Stubbornly Held Ground Following Breakaway Gap - 2/11/2014
View all notes |
Set NEW NOTE alert |
CANSLIM.net Company Profile |
SEC
News |
Chart |
Request a new note
C
A N
S L
I M
|
ULTI
-
NASDAQ
Ultimate Software Group
INTERNET - Internet Software and Services
|
$163.21
|
-2.79
-1.68% |
$164.84
|
190,205
92.78% of 50 DAV
50 DAV is 205,000
|
$171.96
-5.09%
|
1/27/2014
|
$153.75
|
PP = $162.98
|
|
MB = $171.13
|
Most Recent Note - 2/26/2014 3:13:08 PM
Y - Perched near its all-time high stubbornly holding its ground after recently wedging higher with gains lacking great volume conviction. Still trading below its "max buy" level. Found support above its 50 DMA line following a worrisome "negative reversal" on 2/05/14.
>>> FEATURED STOCK ARTICLE : Stalled and Encountering Distributional Pressure - 2/12/2014
View all notes |
Set NEW NOTE alert |
CANSLIM.net Company Profile |
SEC
News |
Chart |
Request a new note
C
A N
S L
I M
|
VRX
-
NYSE
Valeant Pharmaceuticals
DRUGS - Drug Manufacturers - Other
|
$143.38
|
-1.48
-1.02% |
$143.90
|
2,067,823
139.62% of 50 DAV
50 DAV is 1,481,000
|
$153.10
-6.35%
|
9/11/2013
|
$100.26
|
PP = $105.50
|
|
MB = $110.78
|
Most Recent Note - 3/3/2014 1:08:07 PM
G - Reported +76% earnings on +109% sales revenues for the Dec '13 quarter. Pulling back from new all-time highs hit last week. Its 50 DMA line ($132) defines near-term support to watch.
>>> FEATURED STOCK ARTICLE : Strong Earnings Report; On Track for 9th Weekly Gain in 10 Weeks - 2/27/2014
View all notes |
Set NEW NOTE alert |
CANSLIM.net Company Profile |
SEC
News |
Chart |
Request a new note
C
A N
S L
I M
|
Symbol/Exchange
Company Name
Industry Group |
PRICE |
CHANGE
(%Change) |
Day High |
Volume
(% DAV)
(% 50 day avg vol) |
52 Wk Hi
% From Hi |
Featured
Date |
Price
Featured |
Pivot Featured |
|
Max Buy |
|
|
|
THESE ARE NOT BUY RECOMMENDATIONS!
Comments contained in the body of this report are technical
opinions only. The material herein has been obtained
from sources believed to be reliable and accurate, however,
its accuracy and completeness cannot be guaranteed.
This site is not an investment advisor, hence it does
not endorse or recommend any securities or other investments.
Any recommendation contained in this report may not
be suitable for all investors and it is not to be deemed
an offer or solicitation on our part with respect to
the purchase or sale of any securities. All trademarks,
service marks and trade names appearing in this report
are the property of their respective owners, and are
likewise used for identification purposes only.
This report is a service available
only to active Paid Premium Members.
You may opt-out of receiving report notifications
at any time. Questions or comments may be submitted
by writing to Premium Membership Services 665 S.E. 10 Street, Suite 201 Deerfield Beach, FL 33441-5634 or by calling 1-800-965-8307
or 954-785-1121.
|
|
|

