You are not logged in.
This means you
CAN ONLY VIEW reports that were published prior to Wednesday, March 5, 2025.
You
MUST UPGRADE YOUR MEMBERSHIP if you want to see any current reports.
AFTER MARKET UPDATE - FRIDAY, FEBRUARY 28TH, 2014
Previous After Market Report Next After Market Report >>>
|
|
|
|
DOW |
+49.06 |
16,321.71 |
+0.30% |
|
Volume |
944,427,820 |
+38% |
|
Volume |
2,346,128,420 |
+24% |
|
NASDAQ |
-10.81 |
4,308.12 |
-0.25% |
|
Advancers |
1,834 |
58% |
|
Advancers |
1,191 |
44% |
|
S&P 500 |
+5.16 |
1,859.45 |
+0.28% |
|
Decliners |
1,197 |
38% |
|
Decliners |
1,411 |
52% |
|
Russell 2000 |
-4.91 |
1,183.03 |
-0.41% |
|
52 Wk Highs |
224 |
|
|
52 Wk Highs |
206 |
|
|
S&P 600 |
-0.16 |
667.33 |
-0.02% |
|
52 Wk Lows |
18 |
|
|
52 Wk Lows |
16 |
|
|
 |
Benchmark S&P 500 Index at New All-Time High
Kenneth J. Gruneisen - Passed the CAN SLIM® Master's Exam
For the month of February, the Dow Jones Industrial Average gained +4.0%, the S&P 500 Index rose +4.3% and the Nasdaq Composite Index advanced +5.0%. Stocks were mostly higher on Friday and the volume totals were reported much higher than the prior trading session's volume totals on the NYSE and on the Nasdaq. Breadth was positive as advancers led decliners by a 3-2 ratio on the NYSE but decliners led advancers by a 7-6 margin on the Nasdaq exchange. There were 75 high-ranked companies from the CANSLIM.net Leaders List that made new 52-week highs and appeared on the CANSLIM.net BreakOuts Page, up from the total of 55 stocks on the prior session. The list of stocks hitting new 52-week highs expanded and easily outnumbered new 52-week lows on the Nasdaq exchange and on the NYSE. There were gains for only 4 of the 12 high-ranked companies currently included on the Featured Stocks Page. The Market (M criteria) environment has been noted as a "Confirmed Uptrend". For any rally to be sustained it is critical for there to be healthy leadership, so it remains crucial for many stocks to continue hitting new 52-week highs.
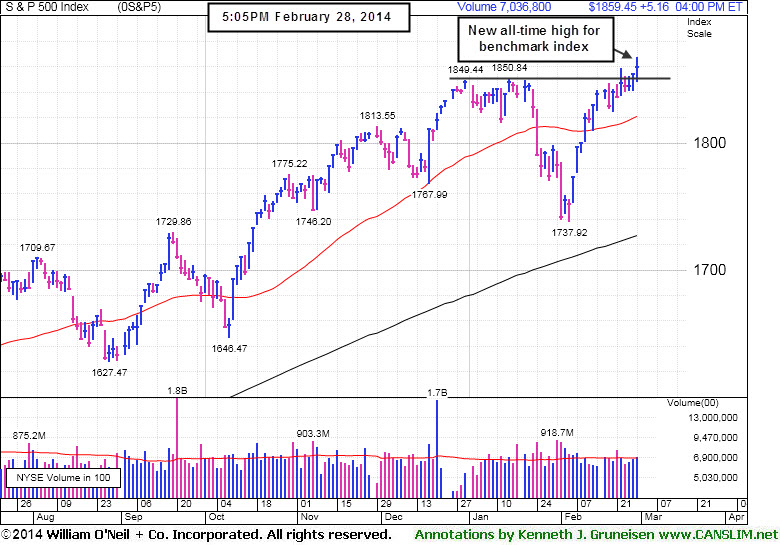
The Dow rose 49 points to 16,321. The S&P 500 added 5 points to reach a new record level of 1,859. The NASDAQ declined 11 points to end the session at 4,308.
The major averages finished the final day of February mixed as investors weighed the latest economic data and increased tension in Eastern Europe. Before the open, fourth-quarter GDP was revised down to a 2.4% annualized rate from 3.2%. Additional reports showed consumer sentiment and Midwest activity unexpectedly improved in February. Pending home sales rose 0.1% in January. The market moved lower in afternoon trading amid reports of possible military action by Russia in the Ukraine.
Seven of 10 sectors in the S&P 500 were up with utilities as the best performing group with gainers including PG&E (PCG +1.54%). Telecom was the biggest decliner on the session with AT&T (T -0.93%) pulling back. Among earnings releases, Monster Beverage (MNST +3.99%) rose after the energy drink maker posted quarterly results above consensus estimates. Shares of Deckers Outdoor (DECK -12.19%) fell on its reduced first quarter guidance.
Treasuries declined with the 10-year note down 4/32 to yield 2.66%.
The CANSLIM.net Featured Stocks Page shows the most action-worthy candidates and their latest notes and a Headline Link directs members to the latest detailed analysis with data-packed graphs annotated by a Certified expert along with links to additional resources. The Premium Member Homepage includes "dynamic archives" to all prior pay reports published. Watch for an announcement via email concerning the next WEBCAST.
PICTURED: The S&P 500 Index hit a new all-time high with a volume-driven gain .
|
 Kenneth J. Gruneisen started out as a licensed stockbroker in August 1987, a couple of months prior to the historic stock market crash that took the Dow Jones Industrial Average down -22.6% in a single day. He has published daily fact-based fundamental and technical analysis on high-ranked stocks online for two decades. Through FACTBASEDINVESTING.COM, Kenneth provides educational articles, news, market commentary, and other information regarding proven investment systems that work in good times and bad.
Comments contained in the body of this report are technical opinions only and are not necessarily those of Gruneisen Growth Corp. The material herein has been obtained from sources believed to be reliable and accurate, however, its accuracy and completeness cannot be guaranteed. Our firm, employees, and customers may effect transactions, including transactions contrary to any recommendation herein, or have positions in the securities mentioned herein or options with respect thereto. Any recommendation contained in this report may not be suitable for all investors and it is not to be deemed an offer or solicitation on our part with respect to the purchase or sale of any securities. |
|
 |
Financials Underpinning Major Averages While Above 50 DMA Lines
Kenneth J. Gruneisen - Passed the CAN SLIM® Master's Exam
Financial shares again underpinned the major averages as the Bank Index ($BKX +0.42%) and Broker/Dealer Index ($XBD +0.42%) posted modest gains. The Retail Index ($RLX +0.26%) eked out a modest gain. Energy-related shares also rose as the Integrated Oil Index ($XOI +0.44%) and the Oil Services Index ($OSX +1.10%) rose. The Biotechnology Index ($BTK -2.20%) pulled back while the other tech sector indices including the Networking Index ($NWX -0.19%) and Semiconductor Index ($SOX -0.07%) ended slightly in the red. The Gold & Silver Index ($XAU -0.54%) edged lower.
Charts courtesy www.stockcharts.com
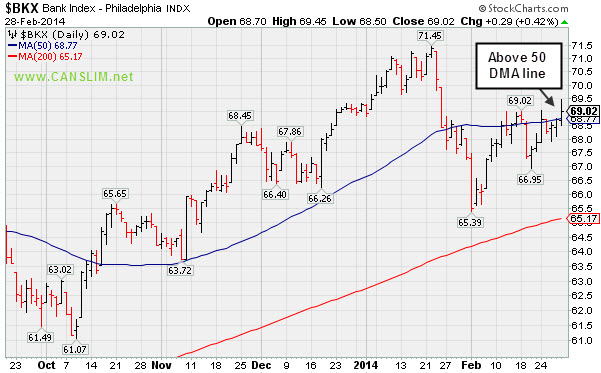
PICTURED 1: The Bank Index ($BKX +0.42%) ended the week above its 50-day moving average (DMA) line.
Charts courtesy www.stockcharts.com

PICTURED 2: The Broker/Dealer Index ($XBD +0.42%) also ended the week above its 50-day moving average (DMA) line. Positive action from financial stocks bodes well as a "leading indicator" for the broader market. Rarely do the major averages suffer bad downdrafts while financial stocks are showing strength.
| Oil Services |
$OSX |
279.84 |
+3.05 |
+1.10% |
-0.42% |
| Integrated Oil |
$XOI |
1,474.77 |
+6.49 |
+0.44% |
-1.89% |
| Semiconductor |
$SOX |
563.83 |
-0.39 |
-0.07% |
+5.38% |
| Networking |
$NWX |
346.72 |
-0.64 |
-0.19% |
+7.03% |
| Broker/Dealer |
$XBD |
159.77 |
+0.67 |
+0.42% |
-0.49% |
| Retail |
$RLX |
936.81 |
+2.39 |
+0.26% |
-0.32% |
| Gold & Silver |
$XAU |
99.55 |
-0.54 |
-0.54% |
+18.30% |
| Bank |
$BKX |
69.02 |
+0.29 |
+0.42% |
-0.35% |
| Biotech |
$BTK |
2,814.71 |
-63.36 |
-2.20% |
+20.78% |
|
|
|
 |
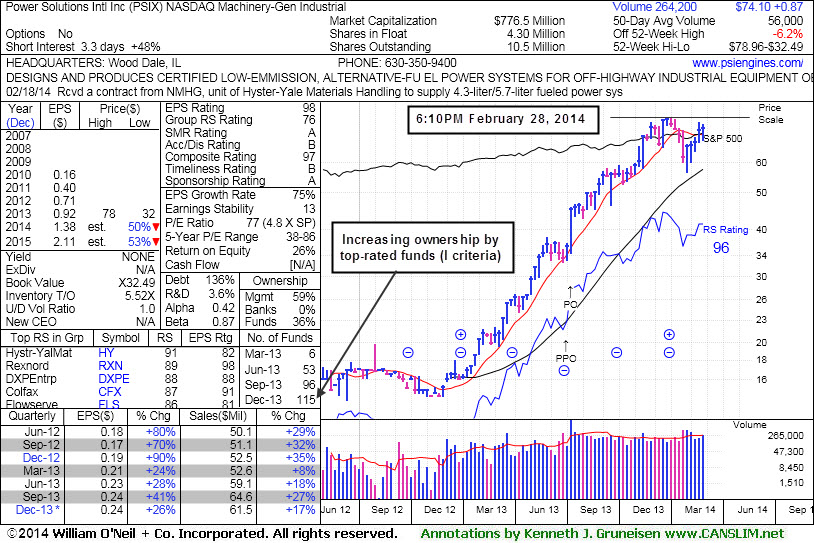
Earnings Solid and Forming a Cup-With-Handle
Kenneth J. Gruneisen - Passed the CAN SLIM® Master's Exam
Power Solutions Intl Inc (PSIX +$3.62 or +5.14% to $74.10) was highlighted in yellow with a pivot point cited based on its 2/21/14 high in the earlier mid-day report (read here). It reported earnings +26% on +17% sales revenues for the Dec '13 quarter, its 3rd consecutive quarter with earnings above the +25% minimum guideline (C criteria). It is rallying from support at its 50-day moving average (DMA) line and perched within striking distance of its 52-week high.
PSIX faces some resistance up through the $78 area while currenly forming a 10-week cup-with-handle base pattern. Subsequent volume-driven gains above the pivot point may trigger a technical buy signal, meanwhile it is ideal for investors' watch lists.
The number of top-rated funds owning its shares rose from 6 in Mar '13 to 115 in Dec '13, a reassuring trend concerning the I criteria. The small supply of only 4.3 million shares (S criteria) can contribute to greater price volatility in the event of institutional buying or selling. The Machinery - General Industrial group is high ranked and leadership in the group (L criteria) is reassuring.

|
|
|
Color Codes Explained :
Y - Better candidates highlighted by our
staff of experts.
G - Previously featured
in past reports as yellow but may no longer be buyable under the
guidelines.
***Last / Change / Volume data in this table is the closing quote data***
Symbol/Exchange
Company Name
Industry Group |
PRICE |
CHANGE
(%Change) |
Day High |
Volume
(% DAV)
(% 50 day avg vol) |
52 Wk Hi
% From Hi |
Featured
Date |
Price
Featured |
Pivot Featured |
|
Max Buy |
EQM
-
NYSE
E Q T Midstream Partners
ENERGY - Oil and Gas Pipelines
|
$65.91
|
+0.41
0.63% |
$66.15
|
102,853
91.02% of 50 DAV
50 DAV is 113,000
|
$67.80
-2.79%
|
12/12/2013
|
$53.17
|
PP = $56.51
|
|
MB = $59.34
|
Most Recent Note - 2/26/2014 6:19:41 PM
G - Posted a gain today with lighter volume. Recently enduring distributional pressure. Reported earnings -2% on +22% sales revenues for the Dec '13 quarter, below the +25% minimum earnings guideline (C criteria), raising fundamental concerns. Its 50 DMA line defines near-term support where a violation may trigger a technical sell signal.
>>> FEATURED STOCK ARTICLE : Leader Still Extended From Any Sound Base - 2/7/2014
View all notes |
Set NEW NOTE alert |
CANSLIM.net Company Profile |
SEC
News |
Chart |
Request a new note
C
A N
S L
I M


|
FB
-
NASDAQ
Facebook Inc Cl A
INTERNET
|
$68.46
|
-0.48
-0.70% |
$69.88
|
66,340,018
100.74% of 50 DAV
50 DAV is 65,855,000
|
$71.44
-4.17%
|
12/12/2013
|
$51.40
|
PP = $54.93
|
|
MB = $57.68
|
Most Recent Note - 2/25/2014 7:49:45 PM
G - Pulled back on light volume today after recent gains on higher volume for new all-time highs. Extended from any sound base and well beyond the "secondary buy point" previously noted. Prior highs and its 50 DMA line coincide near $58 defining very important near-term support to watch on pullbacks. See the latest FSU analysis for more details and new annotated graphs.
>>> FEATURED STOCK ARTICLE : High-Ranked Internet Group Leader is Extended From Base - 2/25/2014
View all notes |
Set NEW NOTE alert |
CANSLIM.net Company Profile |
SEC
News |
Chart |
Request a new note
C
A N
S L
I M
|
GNRC
-
NYSE
Generac Hldgs Inc
Electrical-Power/Equipmt
|
$56.97
|
-0.83
-1.44% |
$58.48
|
640,104
67.74% of 50 DAV
50 DAV is 945,000
|
$58.08
-1.91%
|
2/14/2014
|
$56.50
|
PP = $57.39
|
|
MB = $60.26
|
Most Recent Note - 2/26/2014 3:10:55 PM
Y - Hit a new 52-week high and traded above its pivot point today while volume has been running at a below average pace. Recently encountering resistance near prior highs in the $57 area. Volume should be at least +40% above average as a stock rallies above its pivot point to trigger a proper technical buy signal.
>>> FEATURED STOCK ARTICLE : Following Island Reversal Prior Highs May Act as Resistance - 2/14/2014
View all notes |
Set NEW NOTE alert |
CANSLIM.net Company Profile |
SEC
News |
Chart |
Request a new note
C
A N
S L
I M
|
JAZZ
-
NASDAQ
Jazz Pharmaceuticals Plc
DRUGS - Biotechnology
|
$151.95
|
-14.68
-8.81% |
$166.00
|
2,733,511
263.34% of 50 DAV
50 DAV is 1,038,000
|
$176.60
-13.96%
|
9/30/2013
|
$93.20
|
PP = $89.10
|
|
MB = $93.56
|
 Most Recent Note - 2/28/2014 6:57:42 PM
Down considerably today on heavy volume. It will be dropped from the Featured Stocks list due to weak technical action and sub par earnings growth for the Dec '13 quarter, below the +25% minimum earnings guideline (C criteria). Its 50 DMA line ($145) and recent lows in the $135 area define important support to watch on pullbacks where violations may trigger more worrisome technical sell signals.
>>> FEATURED STOCK ARTICLE : Financial Report May Prompt Greater Volume and Volatility - 2/21/2014
View all notes |
Set NEW NOTE alert |
CANSLIM.net Company Profile |
SEC
News |
Chart |
Request a new note
C
A N
S L
I M
|
KORS
-
NYSE
Michael Kors Hldgs Ltd
RETAIL - Apparel Stores
|
$98.03
|
-1.53
-1.54% |
$100.13
|
2,265,808
57.12% of 50 DAV
50 DAV is 3,967,000
|
$101.04
-2.98%
|
2/4/2014
|
$90.92
|
PP = $84.68
|
|
MB = $88.91
|
Most Recent Note - 2/26/2014 3:06:59 PM
G - Perched at its 52-week high after still wedging higher with recent gains lacking great volume conviction, getting very extended from its prior base. Prior highs in the $84 area define the nearest chart support level.
>>> FEATURED STOCK ARTICLE : Extended From Sound Base and Wedging Higher - 2/19/2014
View all notes |
Set NEW NOTE alert |
CANSLIM.net Company Profile |
SEC
News |
Chart |
Request a new note
C
A N
S L
I M
|
Symbol/Exchange
Company Name
Industry Group |
PRICE |
CHANGE
(%Change) |
Day High |
Volume
(% DAV)
(% 50 day avg vol) |
52 Wk Hi
% From Hi |
Featured
Date |
Price
Featured |
Pivot Featured |
|
Max Buy |
LEAF
-
NYSE
Springleaf Holdings Inc
Finance-Consumer Loans
|
$28.17
|
+1.01
3.72% |
$28.42
|
432,071
126.71% of 50 DAV
50 DAV is 341,000
|
$29.50
-4.51%
|
2/24/2014
|
$28.60
|
PP = $27.44
|
|
MB = $28.81
|
Most Recent Note - 2/28/2014 7:02:07 PM
Y - Posted a gain today with above average volume. Prior highs in the $27 area define initial support to watch following its recent technical breakout. Disciplined investors avoid chasing extended stocks more than +5% above prior highs and always limit losses by selling any stock that falls more than -7% from their purchase price. See the annotated daily graph below this note and details with a weekly graph in the latest FSU analysis.

>>> FEATURED STOCK ARTICLE : Breakout Backed by Four Times Average Volume - 2/24/2014
View all notes |
Set NEW NOTE alert |
CANSLIM.net Company Profile |
SEC
News |
Chart |
Request a new note
C
A N
S L
I M
|
PCLN
-
NASDAQ
Priceline.com Inc
INTERNET - Internet Software and Services
|
$1,348.84
|
-8.95
-0.66% |
$1,367.05
|
923,727
121.54% of 50 DAV
50 DAV is 760,000
|
$1,375.41
-1.93%
|
12/18/2013
|
$1,156.20
|
PP = $1,198.85
|
|
MB = $1,258.79
|
Most Recent Note - 2/25/2014 12:22:28 PM
G - Hitting yet another new 52-week high today, adding to an impressive streak of gains marked by above average volume. Rallying with no resistance due to overhead supply, getting more extended from any sound base.
>>> FEATURED STOCK ARTICLE : Extended From Prior Highs After 6th Straight Gain - 2/13/2014
View all notes |
Set NEW NOTE alert |
CANSLIM.net Company Profile |
SEC
News |
Chart |
Request a new note
C
A N
S L
I M
|
PSIX
-
NASDAQ
Power Solutions Intl Inc
Machinery-Gen Industrial
|
$74.10
|
+3.62
5.14% |
$76.02
|
102,040
182.21% of 50 DAV
50 DAV is 56,000
|
$78.96
-6.16%
|
2/28/2014
|
$74.65
|
PP = $76.93
|
|
MB = $80.78
|
Most Recent Note - 2/28/2014 6:46:49 PM
Y - Highlighted in yellow with new pivot point cited based on its 2/21/14 high in the earlier mid-day report (read here). Reported earnings +26% on +17% sales revenues for the Dec '13 quarter, its 3rd consecutive quarter with earnings above the +25% minimum guideline (C criteria). Subsequent volume-driven gains above the pivot point may trigger a technical buy signal from a cup-with-handle base. See the latest FSU analysis for more details and a new annotated weekly graph.
>>> FEATURED STOCK ARTICLE : Earnings Solid and Forming a Cup-With-Handle - 2/28/2014
View all notes |
Set NEW NOTE alert |
CANSLIM.net Company Profile |
SEC
News |
Chart |
Request a new note
C
A N
S L
I M
|
QCOR
-
NASDAQ
Questcor Pharmaceuticals
DRUGS - Biotechnology
|
$60.75
|
-6.72
-9.96% |
$64.79
|
8,436,124
380.69% of 50 DAV
50 DAV is 2,216,000
|
$80.25
-24.30%
|
2/26/2014
|
$76.30
|
PP = $74.86
|
|
MB = $78.60
|
Most Recent Note - 2/28/2014 6:54:05 PM
Violated its 50 DMA line with today's 4th consecutive loss on above average volume, finishing -24% off its 52-week high hit on Tuesday. A prompt rebound above its 50 DMA line would help its outlook but it faces resistance due to overhead supply up through the $80 area and will be dropped from the Featured Stocks list tonight. Disciplined investors avoid chasing extended stocks more than +5% above prior highs and always limit losses by selling any stock that falls more than -7% from their purchase price.
>>> FEATURED STOCK ARTICLE : Prior Highs Define Initial Support Following Recent Breakout - 2/26/2014
View all notes |
Set NEW NOTE alert |
CANSLIM.net Company Profile |
SEC
News |
Chart |
Request a new note
C
A N
S L
I M
|
SILC
-
NASDAQ
Silicom Ltd
COMPUTER HARDWARE - Networking andamp; Communication Dev
|
$71.68
|
+1.47
2.09% |
$72.18
|
103,236
139.51% of 50 DAV
50 DAV is 74,000
|
$71.49
0.27%
|
12/23/2013
|
$44.62
|
PP = $46.25
|
|
MB = $48.56
|
Most Recent Note - 2/27/2014 2:10:24 PM
G - Extended from any sound base and on track for an 11th consecutive weekly gain. Patient investors may watch for a new base or secondary buy point to possibly develop and be noted in the weeks ahead.
>>> FEATURED STOCK ARTICLE : Stubbornly Held Ground Following Breakaway Gap - 2/11/2014
View all notes |
Set NEW NOTE alert |
CANSLIM.net Company Profile |
SEC
News |
Chart |
Request a new note
C
A N
S L
I M
|
Symbol/Exchange
Company Name
Industry Group |
PRICE |
CHANGE
(%Change) |
Day High |
Volume
(% DAV)
(% 50 day avg vol) |
52 Wk Hi
% From Hi |
Featured
Date |
Price
Featured |
Pivot Featured |
|
Max Buy |
ULTI
-
NASDAQ
Ultimate Software Group
INTERNET - Internet Software and Services
|
$166.00
|
-3.00
-1.78% |
$170.31
|
163,150
79.59% of 50 DAV
50 DAV is 205,000
|
$171.96
-3.47%
|
1/27/2014
|
$153.75
|
PP = $162.98
|
|
MB = $171.13
|
Most Recent Note - 2/26/2014 3:13:08 PM
Y - Perched near its all-time high stubbornly holding its ground after recently wedging higher with gains lacking great volume conviction. Still trading below its "max buy" level. Found support above its 50 DMA line following a worrisome "negative reversal" on 2/05/14.
>>> FEATURED STOCK ARTICLE : Stalled and Encountering Distributional Pressure - 2/12/2014
View all notes |
Set NEW NOTE alert |
CANSLIM.net Company Profile |
SEC
News |
Chart |
Request a new note
C
A N
S L
I M
|
VRX
-
NYSE
Valeant Pharmaceuticals
DRUGS - Drug Manufacturers - Other
|
$144.86
|
-3.14
-2.12% |
$149.22
|
2,151,233
145.75% of 50 DAV
50 DAV is 1,476,000
|
$153.10
-5.38%
|
9/11/2013
|
$100.26
|
PP = $105.50
|
|
MB = $110.78
|
Most Recent Note - 2/27/2014 9:31:09 PM
G - Reported +76% earnings on +109% sales revenues for the Dec '13 quarter. Hit new all-time highs again today. On track for a 9th weekly gain in 10 weeks, very extended from any sound base. See the latest FSU analysis for more details and new annotated graphs.
>>> FEATURED STOCK ARTICLE : Strong Earnings Report; On Track for 9th Weekly Gain in 10 Weeks - 2/27/2014
View all notes |
Set NEW NOTE alert |
CANSLIM.net Company Profile |
SEC
News |
Chart |
Request a new note
C
A N
S L
I M
|
|
|
|
THESE ARE NOT BUY RECOMMENDATIONS!
Comments contained in the body of this report are technical
opinions only. The material herein has been obtained
from sources believed to be reliable and accurate, however,
its accuracy and completeness cannot be guaranteed.
This site is not an investment advisor, hence it does
not endorse or recommend any securities or other investments.
Any recommendation contained in this report may not
be suitable for all investors and it is not to be deemed
an offer or solicitation on our part with respect to
the purchase or sale of any securities. All trademarks,
service marks and trade names appearing in this report
are the property of their respective owners, and are
likewise used for identification purposes only.
This report is a service available
only to active Paid Premium Members.
You may opt-out of receiving report notifications
at any time. Questions or comments may be submitted
by writing to Premium Membership Services 665 S.E. 10 Street, Suite 201 Deerfield Beach, FL 33441-5634 or by calling 1-800-965-8307
or 954-785-1121.
|
|
|

