You are not logged in.
This means you
CAN ONLY VIEW reports that were published prior to Wednesday, March 5, 2025.
You
MUST UPGRADE YOUR MEMBERSHIP if you want to see any current reports.
AFTER MARKET UPDATE - TUESDAY, MARCH 4TH, 2014
Previous After Market Report Next After Market Report >>>
|
|
|
|
DOW |
+227.85 |
16,395.88 |
+1.41% |
|
Volume |
837,497,420 |
+25% |
|
Volume |
2,273,484,840 |
+17% |
|
NASDAQ |
+74.67 |
4,351.97 |
+1.75% |
|
Advancers |
2,563 |
81% |
|
Advancers |
2,153 |
80% |
|
S&P 500 |
+28.18 |
1,873.91 |
+1.53% |
|
Decliners |
495 |
16% |
|
Decliners |
469 |
17% |
|
Russell 2000 |
+32.29 |
1,208.65 |
+2.75% |
|
52 Wk Highs |
302 |
|
|
52 Wk Highs |
282 |
|
|
S&P 600 |
+17.70 |
681.11 |
+2.67% |
|
52 Wk Lows |
10 |
|
|
52 Wk Lows |
9 |
|
|
 |
Breadth Positive as Indices Rose
Kenneth J. Gruneisen - Passed the CAN SLIM® Master's Exam
The major averages posted solid gains on higher volume totals on the NYSE and on the Nasdaq. Breadth was positive as advancers led decliners by a 4-1 ratio on the NYSE and on the Nasdaq exchange. There were 111 high-ranked companies from the CANSLIM.net Leaders List that made new 52-week highs and appeared on the CANSLIM.net BreakOuts Page, up substantially from the total of 17 stocks on the prior session. The list of stocks hitting new 52-week highs easily outnumbered new 52-week lows on the Nasdaq exchange and on the NYSE. There were gains for all of the 10 high-ranked companies currently included on the Featured Stocks Page. The Market (M criteria) environment has been noted as a "Confirmed Uptrend". For any rally to be sustained it is critical for there to be healthy leadership, so it remains crucial for many stocks to continue hitting new 52-week highs.
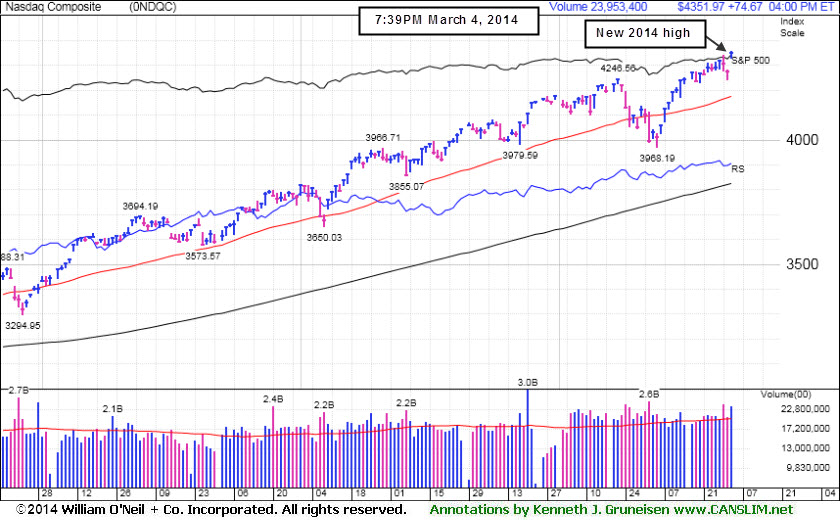
The major averages ended near their best levels of the session. The Dow Jones Industrial Average gained 227 points to 16,395, the S&P 500 added 28 points to 1,873 and the NASDAQ advanced 74 points to close at 4,351.
Stocks rebounded from yesterday's losses as concerns over the tension between the Ukraine and Russia eased. While the situation remains stable, volatility could persist as the situation evolves.
All 10 sectors on the S&P finished higher, led by gains in telecom stocks. Shares of Verizon (VZ +1.25%). On the earnings front, RadioShack (RSH -17.28%) fell after the company posted a wider-than-anticipated loss in the quarter and announced plans to close over 1,000 underperforming store locations. Shares of AutoZone (AZO -0.49%) fell despite posting results ahead of analysts' estimates.
Turning to fixed income markets, Treasuries ended lower along the curve. The benchmark 10 year note was down 13/16 of a point to yield 2.70% and the 30-year bond gave up over a point and a half to yield 3.64%.
The CANSLIM.net Featured Stocks Page shows the most action-worthy candidates and their latest notes and a Headline Link directs members to the latest detailed analysis with data-packed graphs annotated by a Certified expert along with links to additional resources. The Premium Member Homepage includes "dynamic archives" to all prior pay reports published. Watch for an announcement via email concerning the next WEBCAST.
PICTURED: The Nasdaq Composite Index gapped up and posted a solid gain and hit new 2014 highs.
|
 Kenneth J. Gruneisen started out as a licensed stockbroker in August 1987, a couple of months prior to the historic stock market crash that took the Dow Jones Industrial Average down -22.6% in a single day. He has published daily fact-based fundamental and technical analysis on high-ranked stocks online for two decades. Through FACTBASEDINVESTING.COM, Kenneth provides educational articles, news, market commentary, and other information regarding proven investment systems that work in good times and bad.
Comments contained in the body of this report are technical opinions only and are not necessarily those of Gruneisen Growth Corp. The material herein has been obtained from sources believed to be reliable and accurate, however, its accuracy and completeness cannot be guaranteed. Our firm, employees, and customers may effect transactions, including transactions contrary to any recommendation herein, or have positions in the securities mentioned herein or options with respect thereto. Any recommendation contained in this report may not be suitable for all investors and it is not to be deemed an offer or solicitation on our part with respect to the purchase or sale of any securities. |
|
 |
Financial, Tech, Retail and Energy-Linked Groups Rose
Kenneth J. Gruneisen - Passed the CAN SLIM® Master's Exam
The Broker/Dealer Index ($XBD +3.41%) and the Bank Index ($BKX +1.98%) posted solid gains while the Retail Index ($RLX +0.95%) posted a smaller gain on Tuesday. The Biotechnology Index ($BTK +2.02%) led the tech sector while the Networking Index ($NWX +1.69%) and the Semiconductor Index ($SOX +1.77%) posted solid gains. Energy-related shares rose as the Integrated Oil Index ($XOI +1.15%) and the Oil Services Index ($OSX +1.25%) posted gains, meanwhile the Gold & Silver Index ($XAU -0.50%) backpedaled.
Charts courtesy www.stockcharts.com
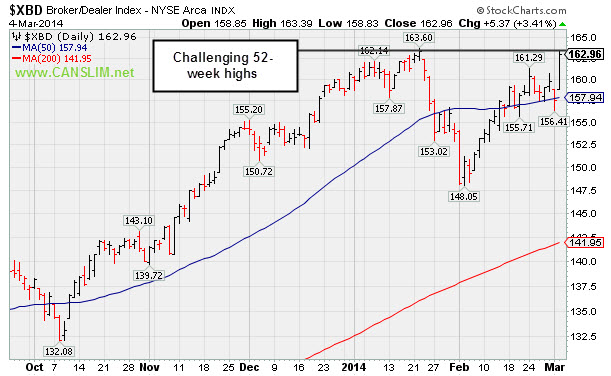
PICTURED: The Broker/Dealer Index ($XBD +3.41%) posted a considerable gain on Tuesday challenging its 52-week high.
| Oil Services |
$OSX |
280.52 |
+3.46 |
+1.25% |
-0.18% |
| Integrated Oil |
$XOI |
1,481.45 |
+16.80 |
+1.15% |
-1.44% |
| Semiconductor |
$SOX |
570.13 |
+9.90 |
+1.77% |
+6.56% |
| Networking |
$NWX |
348.63 |
+5.78 |
+1.69% |
+7.62% |
| Broker/Dealer |
$XBD |
162.96 |
+5.37 |
+3.41% |
+1.50% |
| Retail |
$RLX |
941.46 |
+8.83 |
+0.95% |
+0.18% |
| Gold & Silver |
$XAU |
100.49 |
-0.51 |
-0.50% |
+19.42% |
| Bank |
$BKX |
69.63 |
+1.35 |
+1.98% |
+0.53% |
| Biotech |
$BTK |
2,885.61 |
+57.02 |
+2.02% |
+23.82% |
|
|
|
 |
Near 52--Week High Following Another Volume-Driven Gain
Kenneth J. Gruneisen - Passed the CAN SLIM® Master's Exam
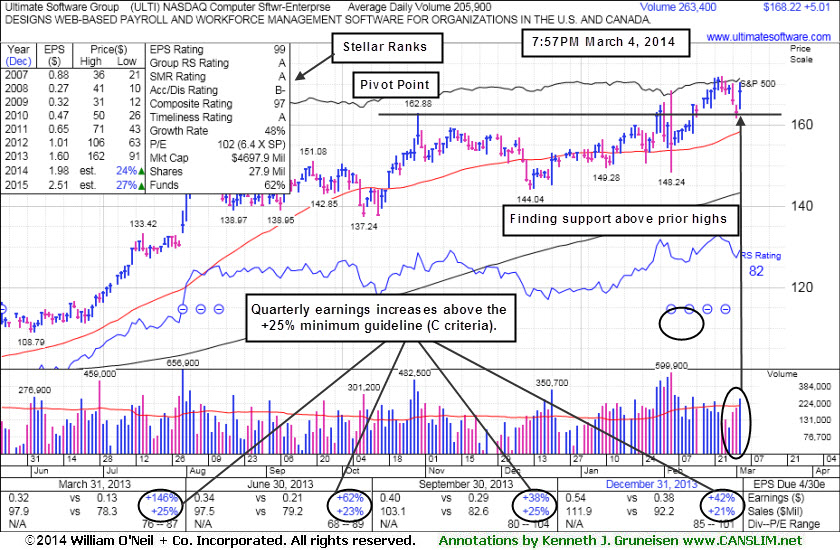
Ultimate Software Group (ULTI +$5.01 or +3.07 to $168.22 is perched near its all-time high stubbornly holding its ground after recently wedging higher with gains lacking great volume conviction. It is still trading below its "max buy" level. It found support above its 50-day moving average (DMA) line following a worrisome "negative reversal" on 2/05/14. It was last shown in this FSU section on 2/12/14 with annotated graphs under the headline, "Stalled and Encountering Distributional Pressure", holding its ground following a "negative reversal" on 2/05/14 and an earlier negative reversal on 2/03/14.
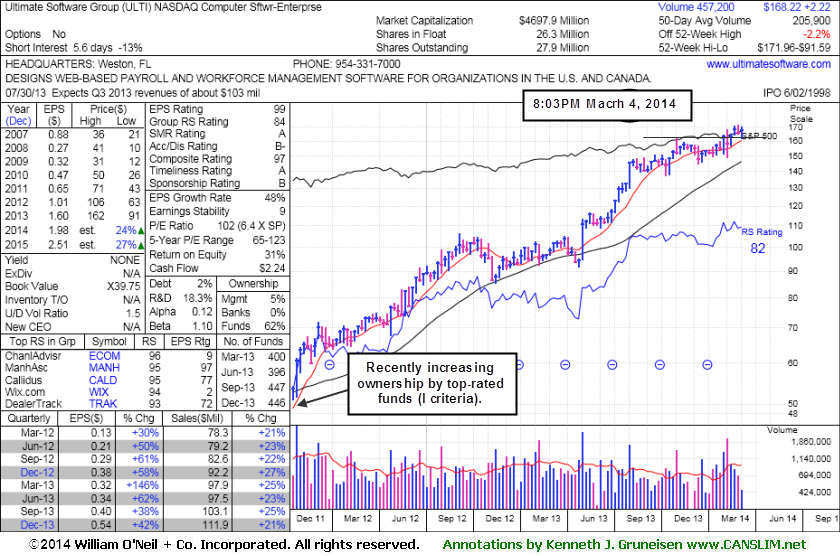
Fundamentals remain strong after solid Dec '13 earnings up +42% on +21% sales revenues, continuing its strong earnings history satisfying the C and A criteria. The Computer Software - Enterprise firm's Relative Strength rating of 82 now, above 80+ minimum level for buy candidates. The number of top-rated funds owning its shares rose from 395 in Dec '12 to 446 funds as of Dec '13, a reassuring trend in place concerning the I criteria. Its small supply of only 26.3 million shares (S criteria) in the public float can contribute to greater price volatility in the event of institutional buying or selling. Disciplined investors avoid chasing stocks extended more than +5% above prior highs and always limit losses by selling if any stock falls more than -7% from their purchase price.
|
|
|
Color Codes Explained :
Y - Better candidates highlighted by our
staff of experts.
G - Previously featured
in past reports as yellow but may no longer be buyable under the
guidelines.
***Last / Change / Volume data in this table is the closing quote data***
Symbol/Exchange
Company Name
Industry Group |
PRICE |
CHANGE
(%Change) |
Day High |
Volume
(% DAV)
(% 50 day avg vol) |
52 Wk Hi
% From Hi |
Featured
Date |
Price
Featured |
Pivot Featured |
|
Max Buy |
EQM
-
NYSE
E Q T Midstream Partners
ENERGY - Oil and Gas Pipelines
|
$66.77
|
+1.27
1.94% |
$66.77
|
90,505
80.09% of 50 DAV
50 DAV is 113,000
|
$67.80
-1.52%
|
12/12/2013
|
$53.17
|
PP = $56.51
|
|
MB = $59.34
|
Most Recent Note - 3/3/2014 5:44:55 PM
G - Stubbornly holding its ground since reporting earnings -2% on +22% sales revenues for the Dec '13 quarter, below the +25% minimum earnings guideline (C criteria), raising fundamental concerns. Its 50 DMA line defines near-term support where a violation may trigger a technical sell signal. See the latest FSU analysis for more details and new annotated graphs.
>>> FEATURED STOCK ARTICLE : Resilient Despite Fundamental Concerns - 3/3/2014
View all notes |
Set NEW NOTE alert |
CANSLIM.net Company Profile |
SEC
News |
Chart |
Request a new note
C
A N
S L
I M


|
FB
-
NASDAQ
Facebook Inc Cl A
INTERNET
|
$68.80
|
+1.39
2.06% |
$68.90
|
42,112,794
64.74% of 50 DAV
50 DAV is 65,054,000
|
$71.44
-3.70%
|
12/12/2013
|
$51.40
|
PP = $54.93
|
|
MB = $57.68
|
Most Recent Note - 3/3/2014 2:45:51 PM
G - Pulling back on light volume today for a 5th consecutive small loss while retreating from its all-time high. Its 50 DMA line ($60.54 now) defines near-term support to watch.
>>> FEATURED STOCK ARTICLE : High-Ranked Internet Group Leader is Extended From Base - 2/25/2014
View all notes |
Set NEW NOTE alert |
CANSLIM.net Company Profile |
SEC
News |
Chart |
Request a new note
C
A N
S L
I M
|
GNRC
-
NYSE
Generac Hldgs Inc
Electrical-Power/Equipmt
|
$58.98
|
+1.49
2.59% |
$59.15
|
771,294
81.10% of 50 DAV
50 DAV is 951,000
|
$58.48
0.85%
|
2/14/2014
|
$56.50
|
PP = $57.39
|
|
MB = $60.26
|
Most Recent Note - 3/3/2014 5:39:16 PM
Y - Volume totals have been cooling while consolidating near previously stubborn resistance in the $57 area, while no resistance remains due to overhead supply. Volume should be at least +40% above average as a stock rallies above its pivot point to trigger a proper technical buy signal.
>>> FEATURED STOCK ARTICLE : Following Island Reversal Prior Highs May Act as Resistance - 2/14/2014
View all notes |
Set NEW NOTE alert |
CANSLIM.net Company Profile |
SEC
News |
Chart |
Request a new note
C
A N
S L
I M
|
KORS
-
NYSE
Michael Kors Hldgs Ltd
RETAIL - Apparel Stores
|
$98.88
|
+0.90
0.92% |
$99.16
|
1,952,611
49.21% of 50 DAV
50 DAV is 3,968,000
|
$101.04
-2.14%
|
2/4/2014
|
$90.92
|
PP = $84.68
|
|
MB = $88.91
|
Most Recent Note - 2/26/2014 3:06:59 PM
G - Perched at its 52-week high after still wedging higher with recent gains lacking great volume conviction, getting very extended from its prior base. Prior highs in the $84 area define the nearest chart support level.
>>> FEATURED STOCK ARTICLE : Extended From Sound Base and Wedging Higher - 2/19/2014
View all notes |
Set NEW NOTE alert |
CANSLIM.net Company Profile |
SEC
News |
Chart |
Request a new note
C
A N
S L
I M
|
LEAF
-
NYSE
Springleaf Holdings Inc
Finance-Consumer Loans
|
$28.44
|
+0.35
1.25% |
$28.89
|
419,163
124.01% of 50 DAV
50 DAV is 338,000
|
$29.50
-3.59%
|
2/24/2014
|
$28.60
|
PP = $27.44
|
|
MB = $28.81
|
Most Recent Note - 3/3/2014 5:41:03 PM
Y - Pulled back today with below average volume. Prior highs in the $27 area define initial support to watch following its recent technical breakout. Disciplined investors avoid chasing extended stocks more than +5% above prior highs and always limit losses by selling any stock that falls more than -7% from their purchase price. See the annotated daily graph below this note and details with a weekly graph in the latest FSU analysis.

>>> FEATURED STOCK ARTICLE : Breakout Backed by Four Times Average Volume - 2/24/2014
View all notes |
Set NEW NOTE alert |
CANSLIM.net Company Profile |
SEC
News |
Chart |
Request a new note
C
A N
S L
I M
|
Symbol/Exchange
Company Name
Industry Group |
PRICE |
CHANGE
(%Change) |
Day High |
Volume
(% DAV)
(% 50 day avg vol) |
52 Wk Hi
% From Hi |
Featured
Date |
Price
Featured |
Pivot Featured |
|
Max Buy |
PCLN
-
NASDAQ
Priceline.com Inc
INTERNET - Internet Software and Services
|
$1,368.32
|
+30.08
2.25% |
$1,369.00
|
671,380
86.97% of 50 DAV
50 DAV is 772,000
|
$1,375.41
-0.52%
|
12/18/2013
|
$1,156.20
|
PP = $1,198.85
|
|
MB = $1,258.79
|
Most Recent Note - 3/3/2014 2:47:31 PM
G - Holding its ground near its 52-week high today with volume totals cooling after an impressive streak of gains. Rallied with no resistance due to overhead supply, and it is extended from any sound base.
>>> FEATURED STOCK ARTICLE : Extended From Prior Highs After 6th Straight Gain - 2/13/2014
View all notes |
Set NEW NOTE alert |
CANSLIM.net Company Profile |
SEC
News |
Chart |
Request a new note
C
A N
S L
I M
|
PSIX
-
NASDAQ
Power Solutions Intl Inc
Machinery-Gen Industrial
|
$74.46
|
+1.56
2.14% |
$75.60
|
43,266
75.91% of 50 DAV
50 DAV is 57,000
|
$78.96
-5.70%
|
2/28/2014
|
$74.65
|
PP = $76.93
|
|
MB = $80.78
|
Most Recent Note - 2/28/2014 6:46:49 PM
Y - Highlighted in yellow with new pivot point cited based on its 2/21/14 high in the earlier mid-day report (read here). Reported earnings +26% on +17% sales revenues for the Dec '13 quarter, its 3rd consecutive quarter with earnings above the +25% minimum guideline (C criteria). Subsequent volume-driven gains above the pivot point may trigger a technical buy signal from a cup-with-handle base. See the latest FSU analysis for more details and a new annotated weekly graph.

>>> FEATURED STOCK ARTICLE : Earnings Solid and Forming a Cup-With-Handle - 2/28/2014
View all notes |
Set NEW NOTE alert |
CANSLIM.net Company Profile |
SEC
News |
Chart |
Request a new note
C
A N
S L
I M
|
SILC
-
NASDAQ
Silicom Ltd
COMPUTER HARDWARE - Networking andamp; Communication Dev
|
$73.00
|
+1.06
1.47% |
$73.44
|
100,096
131.71% of 50 DAV
50 DAV is 76,000
|
$72.18
1.14%
|
12/23/2013
|
$44.62
|
PP = $46.25
|
|
MB = $48.56
|
Most Recent Note - 2/27/2014 2:10:24 PM
G - Extended from any sound base and on track for an 11th consecutive weekly gain. Patient investors may watch for a new base or secondary buy point to possibly develop and be noted in the weeks ahead.
>>> FEATURED STOCK ARTICLE : Stubbornly Held Ground Following Breakaway Gap - 2/11/2014
View all notes |
Set NEW NOTE alert |
CANSLIM.net Company Profile |
SEC
News |
Chart |
Request a new note
C
A N
S L
I M
|
ULTI
-
NASDAQ
Ultimate Software Group
INTERNET - Internet Software and Services
|
$168.22
|
+5.01
3.07% |
$170.34
|
277,398
135.32% of 50 DAV
50 DAV is 205,000
|
$171.96
-2.17%
|
1/27/2014
|
$153.75
|
PP = $162.98
|
|
MB = $171.13
|
Most Recent Note - 2/26/2014 3:13:08 PM
Y - Perched near its all-time high stubbornly holding its ground after recently wedging higher with gains lacking great volume conviction. Still trading below its "max buy" level. Found support above its 50 DMA line following a worrisome "negative reversal" on 2/05/14.
>>> FEATURED STOCK ARTICLE : Near 52--Week High Following Another Volume-Driven Gain - 3/4/2014
View all notes |
Set NEW NOTE alert |
CANSLIM.net Company Profile |
SEC
News |
Chart |
Request a new note
C
A N
S L
I M
|
VRX
-
NYSE
Valeant Pharmaceuticals
DRUGS - Drug Manufacturers - Other
|
$146.23
|
+2.85
1.99% |
$147.02
|
1,499,853
99.72% of 50 DAV
50 DAV is 1,504,000
|
$153.10
-4.49%
|
9/11/2013
|
$100.26
|
PP = $105.50
|
|
MB = $110.78
|
Most Recent Note - 3/3/2014 1:08:07 PM
G - Reported +76% earnings on +109% sales revenues for the Dec '13 quarter. Pulling back from new all-time highs hit last week. Its 50 DMA line ($132) defines near-term support to watch.
>>> FEATURED STOCK ARTICLE : Strong Earnings Report; On Track for 9th Weekly Gain in 10 Weeks - 2/27/2014
View all notes |
Set NEW NOTE alert |
CANSLIM.net Company Profile |
SEC
News |
Chart |
Request a new note
C
A N
S L
I M
|
Symbol/Exchange
Company Name
Industry Group |
PRICE |
CHANGE
(%Change) |
Day High |
Volume
(% DAV)
(% 50 day avg vol) |
52 Wk Hi
% From Hi |
Featured
Date |
Price
Featured |
Pivot Featured |
|
Max Buy |
|
|
|
THESE ARE NOT BUY RECOMMENDATIONS!
Comments contained in the body of this report are technical
opinions only. The material herein has been obtained
from sources believed to be reliable and accurate, however,
its accuracy and completeness cannot be guaranteed.
This site is not an investment advisor, hence it does
not endorse or recommend any securities or other investments.
Any recommendation contained in this report may not
be suitable for all investors and it is not to be deemed
an offer or solicitation on our part with respect to
the purchase or sale of any securities. All trademarks,
service marks and trade names appearing in this report
are the property of their respective owners, and are
likewise used for identification purposes only.
This report is a service available
only to active Paid Premium Members.
You may opt-out of receiving report notifications
at any time. Questions or comments may be submitted
by writing to Premium Membership Services 665 S.E. 10 Street, Suite 201 Deerfield Beach, FL 33441-5634 or by calling 1-800-965-8307
or 954-785-1121.
|
|
|

